
A subscription to JoVE is required to view this content. Sign in or start your free trial.
Method Article
Laboratory and Field Protocol for Estimating Sheet Erosion Rates from Dendrogeomorphology
In This Article
Summary
Characterizing erosion from dendrogeomorphology has usually focused on accurately finding the starting time of root exposure, by examining macroscopic or cell level changes caused by exposure. Here, we offer a detailed description of different novel techniques to obtain more precise erosion rates from highly accurate microtopographic data.
Abstract
Sheet erosion is among the crucial drivers of soil degradation. Erosion is controlled by environmental factors and human activities, which often lead to severe environmental impacts. The understanding of sheet erosion is, consequently, a worldwide issue with implications for both environment and economies. However, the knowledge on how erosion evolves in space and time is still limited, as well as its effects on the environment. Below, we explain a new dendrogeomorphological protocol for deriving eroded soil thickness (Ex) by acquiring accurate microtopographic data using both terrestrial laser scanning (TLS) and microtopographic profile gauges. Additionally, standard dendrogeomorphic procedures, dependent on anatomical variations in root rings, are utilized to establish the timing of exposure. Both TLS and microtopographic profile gauges are used to obtain ground surface profiles, from which Ex is estimated after the threshold distance (TD) is determined, i.e., the distance between the root and the sediment knickpoint, which allows defining the lowering of the ground surface caused by sheet erosion. For each profile, we measured the height between the topside of the root and a virtual plane tangential to the ground surface. In this way, we intended to avoid small-scale impacts of soil deformation, which may be due to pressures exerted by the root system, or by the arrangement of exposed roots. This may provoke small amounts of soil sedimentation or erosion depending on how they physically affect the surface runoff. We demonstrate that an adequate microtopographic characterization of exposed roots and their associated ground surface is very valuable to obtain accurate erosion rates. This finding could be utilized to develop the best management practices designed to eventually halt or perhaps, at least, lessen soil erosion, so that more sustainable management policies can be put into practice.
Introduction
Both economic and environmental impacts produced by sheet erosion makes this topic in a worldwide concern1. Several methods, from direct techniques to physical-based and empirical approaches, are used to calculate soil erosion rates on a variety of temporal and spatial scales. Direct techniques use field measurements under natural conditions and are mainly based on the use of Gerlach troughs2, water collectors3, erosion pins4 and profilometers5. Furthermore, models of soil erosion have been increasingly focused on representing in detail the real physical processes responsible for erosion6.
Dendrogeomorphology7 is a subdivision of dendrochronology8 that it is successful in characterizing frequency and magnitude of geomorphic processes9,10,11,12,13,14,15,16,17. Regarding sheet erosion, dendrogeomorphology is usually employed to enhance or replace the methodologies mentioned above, particularly in areas where erosion rates derived from direct techniques are either scarce or unavailable. Dendrogeomorphology is a very flexible method for assessing soil erosion and can be utilized to calibrate physical-based and empirical models, or perhaps as a data source to enhance the reliability of direct estimation techniques18,19. Dendrogeomorphology enables soil erosion to be established over large areas where exposed roots are available. These exposed roots should show clear tree rings limits and respond to annual growth patterns to be considered as optimum to apply dendrogeomorphological techniques20. Further, exposed roots to be sampled should be preferably located in homogenous units based on their reaction to soil erosion21.
The conventional dendrogeomorphical way of estimating sheet erosion is grounded on measuring in situ the eroded soil thickness (Ex) from the time of the very first exposure to the present22,23,24. The ratio between these two variables is utilized to calculate an erosion value in mm∙yr1. Much of the research conducted to date has focused entirely on efficiently identifying the initial year of exposure. As an outcome, modifications in the root due to exposure are analyzed at the macroscopic level25, or at the tissue and cellular levels26,27,28. The principal anatomical change present in the exposed roots of conifers is increasing growth ring thickness, as a consequence of a significant number of cells within the earlywood (EW)26. A cutback has similarly been found within the lumen area of EW tracheids along with an increased cell wall structure thickness of latewood (LW) tracheids24,27,29. These modifications have been described and quantified as beginning when erosion lowers the ground surface over the root to roughly three cm30. Less attention was granted to the adequate determination of the Ex parameter. The age of exposed roots was typically connected with the height of the root's center axis of growth over the ground surface31,32. The estimation of Ex was consequently corrected considering ongoing secondary growth30,33. More recently, these methodological approaches have also integrated the characterization of soil microtopography to obtain reliable erosion rates34,35,36.
We present a laboratory and field protocol to estimate more accurate and reliable sheet erosion rates from dendrogeomorphology. In this particular protocol, we examine the hypothesis that sampling all exposed roots, regardless of orientation relative to runoff path and in conjunction with microtopographical analysis, enables erosion rates to be precisely reconstructed and quantified. Our objective, therefore, is to provide a protocol to estimate erosion rates from maximizing the sample size of exposed roots, using macroscopic and microscopic information found in growth tree-ring series and also high-resolution topographic data.
Protocol
1. Sampling Strategy
- Geomorphic process identification
- Implement the Hydrologic Response Units approach (HRU)21. To this end, identify homogenous areas within the study site, comprising lithology and surface deposits, canopy cover, vegetative residue in contact with the soil surface and slope. Select among all the HRUs those in which the sheet erosion process is predominant.

Figure 1: Example of HRUs associated to a sandy gully. Regarding the protocol proposed here, the sampling of exposed roots must be conducted in an HRU in which the effective erosive process is sheet erosion (in this figure legend corresponding to exposed sand with moderate slopes). This figure has been modified from Bodoque et al.21. Please click here to view a larger version of this figure.
- Sampling of exposed roots
- Locate in the study site exposed roots corresponding to tree species useful for tree-ring dating (preferably coniferous)20.
- Provide a detailed description of the spatial and morphological characteristics of the surroundings of the exposed roots to be sampled. Collect the following information: geographical location (UTM coordinates); altitude; aspect in sexagesimal degrees, both for the hillside and for the particular root location (local aspect); distance of the root section to the tree trunk; hillside slope and slope of the specific root location (both expressed in degrees); orientation of the exposed root with regard to the runoff path.
- Take one soil sample of about 1 kg from the area surrounding each exposed root. The parameters to characterize are texture, percentage of organic matter and soil structure.
- Measure in situ hydraulic conductivity using a single ring infiltrometer under constant head.
Note: Implement steps 1.2.2 and 1.2.3 to characterize soil erodibility. - Locate exposed roots that are farther than 1.5 m from the trunk. At lesser distances the exposure could be related to tree growth.
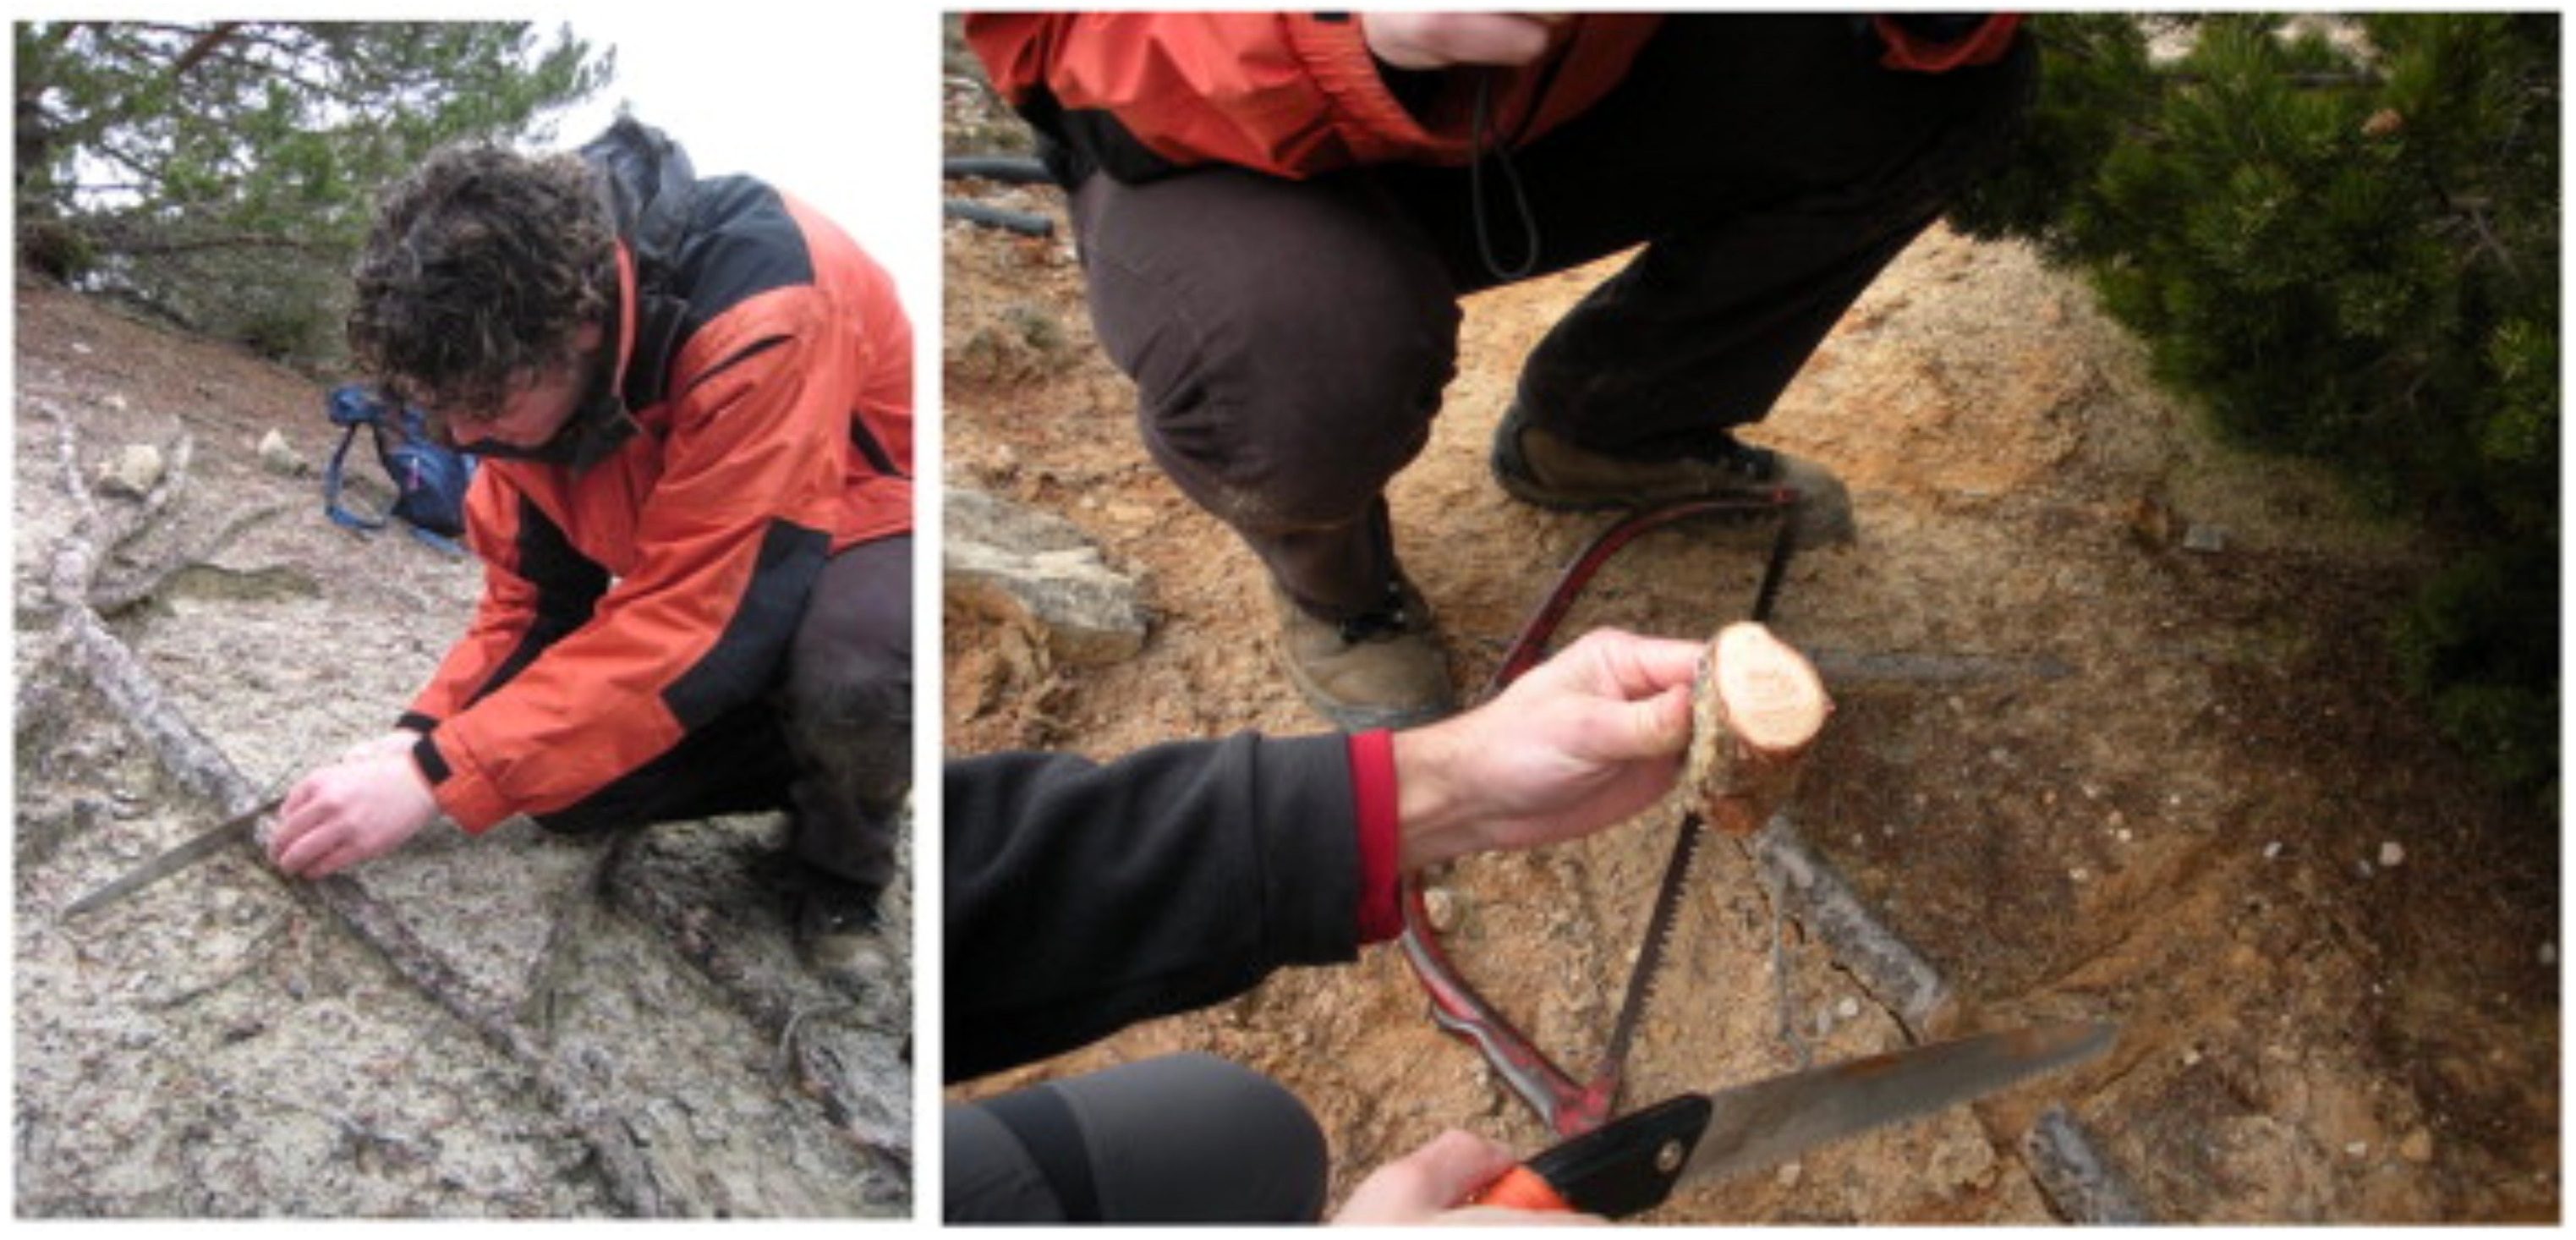
- Cut with a handsaw at least 30 exposed roots, with a diameter greater than 5 cm, into 15 cm-long sections. Subsequently, take two slices of approximately 1.5 cm thick.
- By using a gauging trowel, a handsaw and a measuring tape, sample a subset of buried roots (at least one-third of the total exposed roots sampled) at different soil depths (maximum 20 cm) to establish the minimum soil thickness below which roots begin to have an anatomical response due to exposure.

Figure 2: Example of how to conduct field sampling. At least 30 exposed roots are selected and, subsequently, cut with a handsaw. Please click here to view a larger version of this figure.
2. Microtopographic Characterization of Ground Surface and Exposed Roots at Easily Accessible Locations
- Use a Terrestrial Laser Scanning device that can measure up to 50,000 points per second with a precision of 1 mm at a scanning distance of < 120 m.
- Consider at least two different conventional TLS locations to avoid shadow zones.
- Merge the different locations by using a minimum of four high-definition surveying (HDS) targets positioned to cover the entire area.
- In order to obtain highly accurate topographic data, scan an average area of 300 cm2 from the selected locations using a spatial resolution of 1 mm. Include the exposed roots and the surrounding area that is representative of the ground surface.
3. Microtopographic Characterization of Ground Surface And Exposed Roots, at Locations with Difficult and Steep Terrain (Mountain Environments)
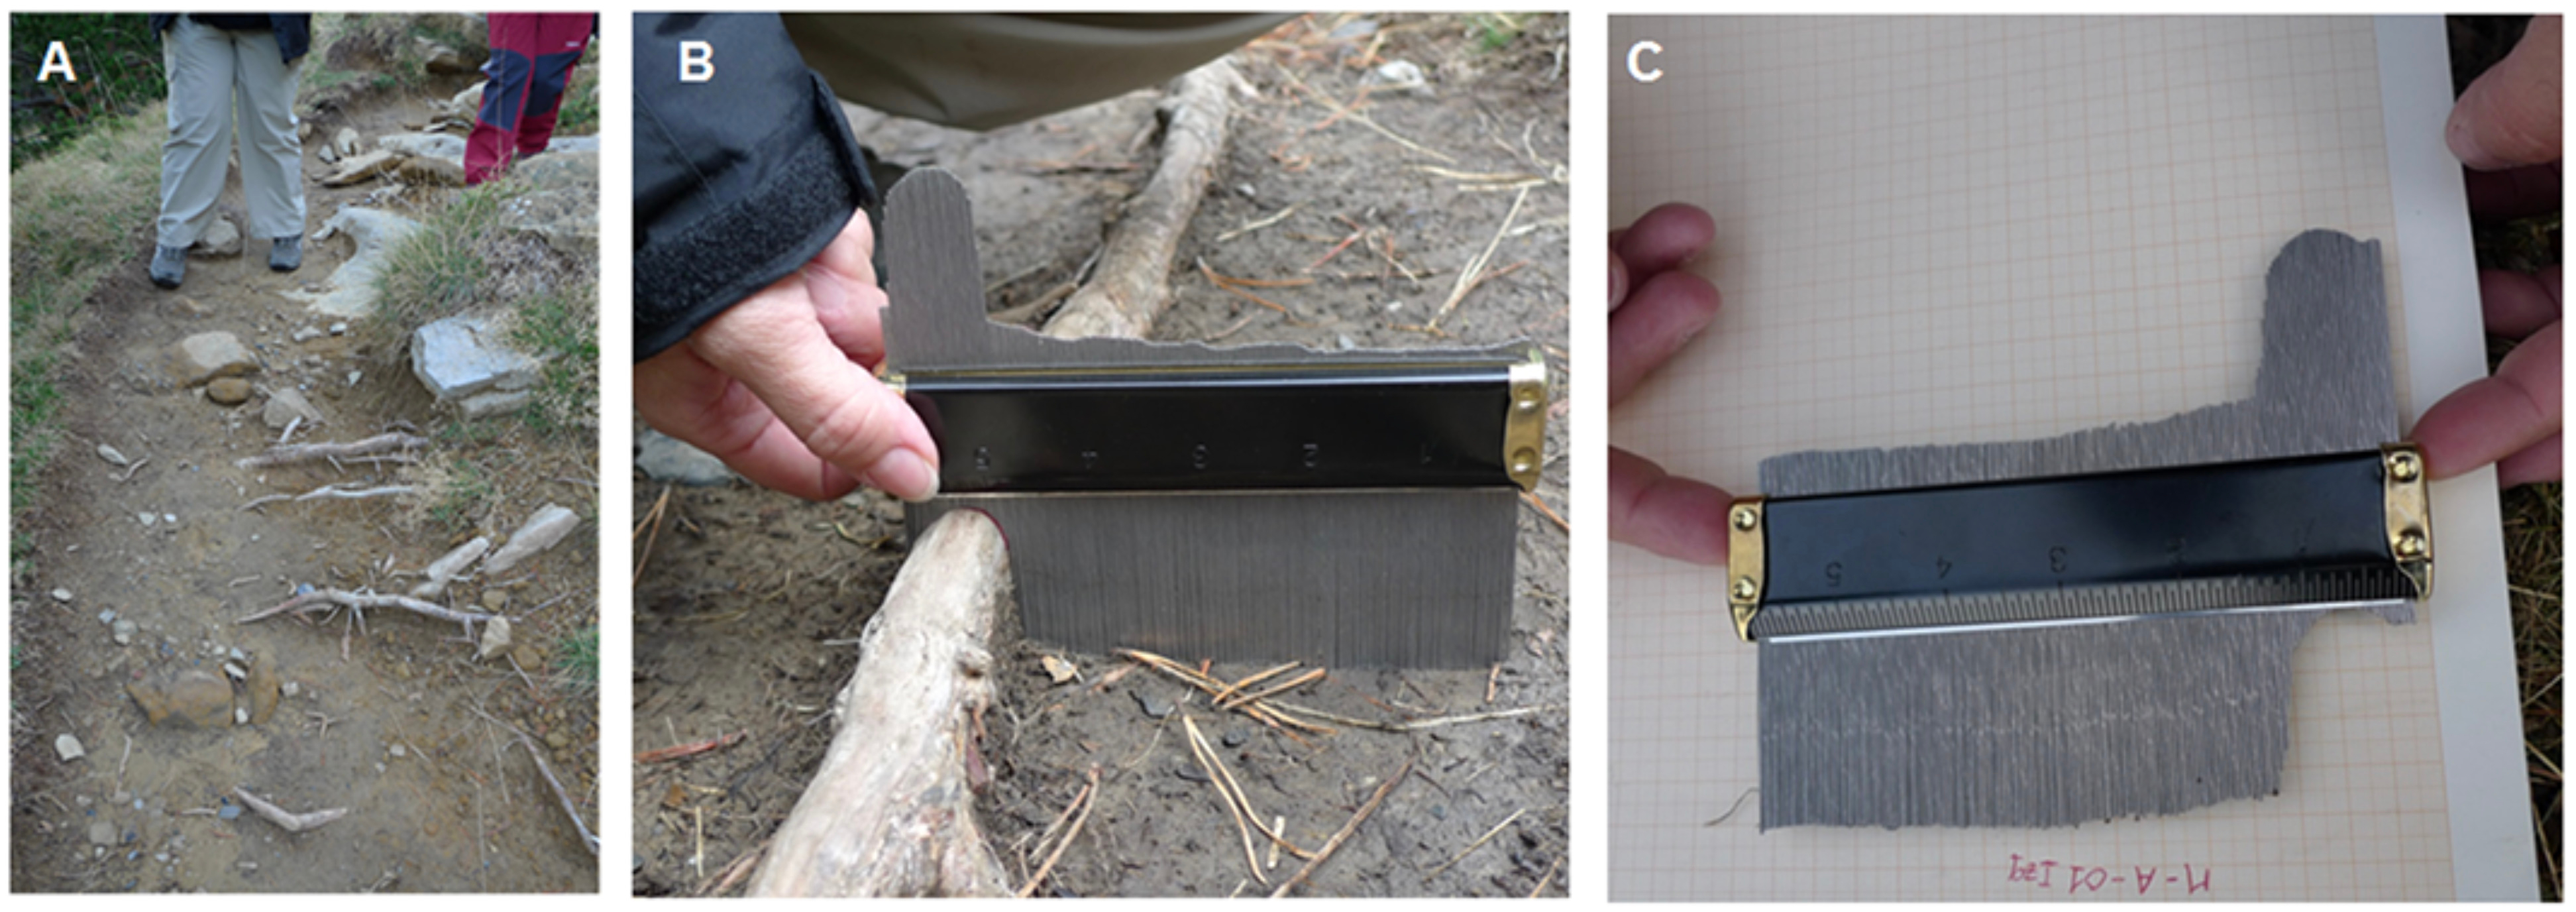
- Place a microtopographic profile gauge perpendicular to the exposed root and, subsequently, level horizontally for all measurements in such a way that different datasets can be compared.
- Draw the profile obtained in step 3.1 on graph paper to be able to infer the amount of eroded soil along the profile with sub-millimeter precision.

Figure 3: Example of characterization of ground microtopography using a microtopographic profile gauge. (A) Illustration of exposed roots as observed along a hiking trail; (B) measurements of soil microtopography using a microtopographic profile gauge; (C) estimation of Ex through the acquisition of microtopographic profiles by drawing them on a graph paper to allow inference of the amount of eroded soil along the profile and with sub-millimeter precision. Please click here to view a larger version of this figure.
4. Determination of the Timing of Root Exposure
- Macroscopic analysis
- Air dry the sections obtained in step 1.2.6 for 2 months.
- Obtain from the initial sections two slices that are each approximately 2 cm thick.
- Sand and polish the slices with sandpaper (up to 400 grit) to facilitate recognition of growth rings.
- Scan slices at a minimum resolution of 2,800 dpi so that they can be accurately analyzed even when rings are particularly thin.
- Use the increase in latewood percentage and larger growth-ring widths as indicators of stress induced by exposure.
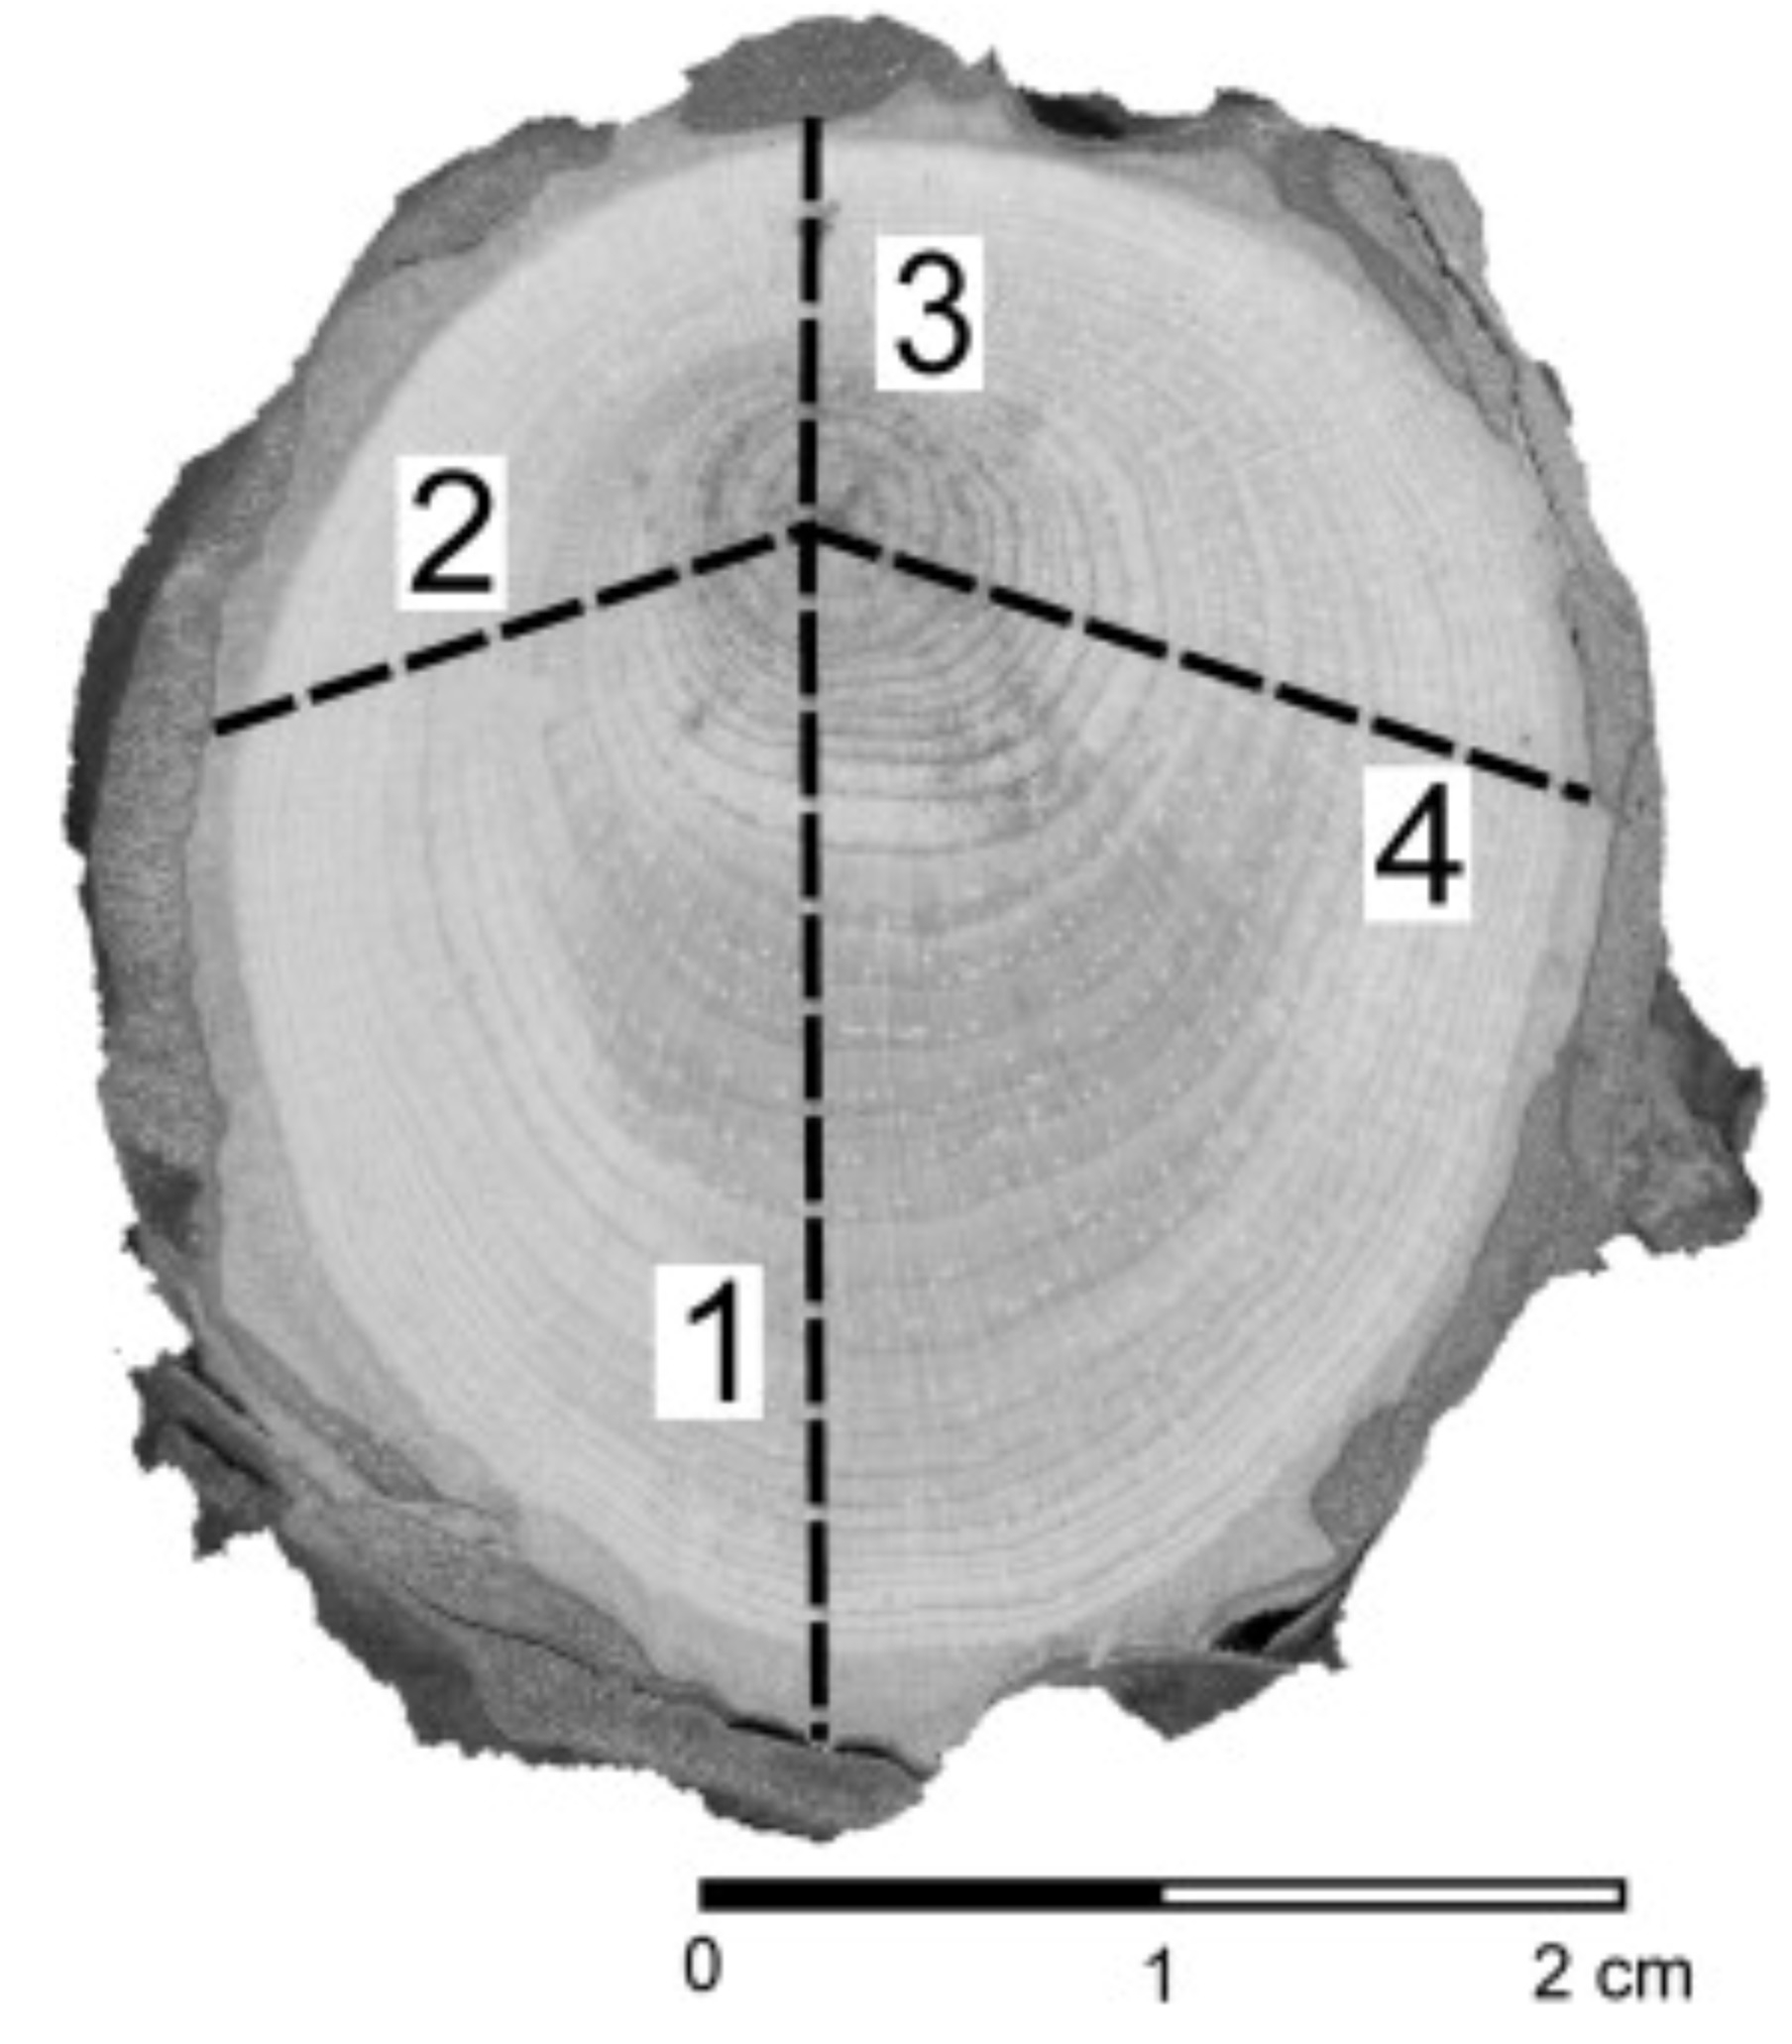
- Mark at least 4-5 radii along the diameters of the slices that show the highest variability in growth-ring widths.
- Use an image analysis system or a measuring table to measure tree-ring width.
- Apply visual cross-dating procedures by comparing variability in growth-ring widths between the different radii, to both improve the dating precision for the first year of exposure to soil erosion and to correctly date subsequent rings and recognize the presence of multiple or discontinuous rings.

Figure 4: Example of how to prepare a section of an exposed root to accomplish dendrochronological dating of growth ring series. In each section, four or five radii are marked along the directions that show the highest variability regarding tree-ring width. Please click here to view a larger version of this figure.
- Microscopic analysis
- For both exposed and non-exposed root samples, use a sliding microtome to obtain radial cross-sections of approximately 1 cm in width and 20 microns thick.
- Stain cross-sections with safranin (i.e., 1 g of safranin + 50 g of water + 50 g of 96% ethanol) and dehydrate with increasingly richer ethanol-water solution up to 96% ethanol (e.g., 50% and 96% ethanol) until the ethanol runs clear. Soak the samples in xylol or a citrus oil clearing agent (e.g., Histoclear).
- Mount cross-sections on coated slides, cover-slip with a hardening epoxy (e.g., Eukitt, Canada balsam and dry at ambient temperature (i.e., about 5-8 h for Eukitt, at least 24 h for Canada balsam).
- Observe (under 125X magnification) and photograph samples with a digital imaging system under optical microscopy.
- Compare under an optical microscope the anatomical footprint of both exposed and non-exposed root samples (steps 1.2.5 and 1.2.6).
- Take microscopic measurements using an image analyzer on the digital photographs of the ensuing parameters: a) width of the growth ring; b) number of cells per ring; c) percentage of latewood; and d) lumen area in earlywood.
- Test with the image analyzer (step 4.2.6) the occurrence of resin ducts and take measurements for each growth ring.
- Perform a one-way analysis ANOVA with multiple range tests (method: 95% LSD –Least Significant Difference) for the anatomical variables considered (step 4.2.6) to verify the existence of statistically significant differences between the two groups of measurements (pre-exposed vs exposed roots).
5. Estimation of the Thickness of the Soil Layer Eroded Since Initial Exposure (Ex)
- Scenario 1: exposed roots that run parallel to the runoff path.
- Based on the data obtained in step 2.4, use inverse distance weighting as the interpolation method to obtain highly accurate digital elevation models (DEMs) with a spatial resolution of 3 mm.
- Use GIS tools to extract from the DEM perpendicular profiles of the exposed root with a rough distance of 150 cm.
- Perform steps 5.1.1 and 5.1.2 at easily accessible locations (step 2).
- Use the perpendicular profiles of the exposed root obtained in step 3.2 when the study site is located in areas where the terrain is difficult and steep (mountain environments) (step 3).
- In the profiles obtained in steps 5.1.2 and 5.1.3 use visual interpretation to locate the threshold distance (TD), defined as the distance between the root and the knickpoint at the ground surface. This establishes the lowering of ground surface for the profiles due to sheet erosion.
- Estimate the thickness of the soil layer eroded, by measuring the height between the top of the root and the knickpoint at the ground surface estimated in step 5.1.5.
- Correct the measurement obtained in step 5.1.6 by subtracting it from the ongoing secondary growth (i.e., growth of the root since the year of exposure) and the bark thickness on the upper/lower side of the root. See Corona et al. 30 for a detailed description.

Figure 5: Example is illustrating how to place TD when the exposed roots sampled are orientated according to the runoff path. This figure shows a common microtopographic transversal profile of uncovered root and its immediate vicinity. Ex1 is the location applied to the traditional dendrogeomorphical approach to determine the eroded soil thickness; Ex2 belongs to the position where this parameter needs to be assessed. TD is taken as a guide position from which the ground surface is changed by sheet erosion only. This figure has been modified from Bodoque et al.34 Please click here to view a larger version of this figure.
- Scenario 2: exposed roots that run perpendicular to the runoff path
- Implement steps 5.1.1 to 5.1.4 as stated under step 5.1.
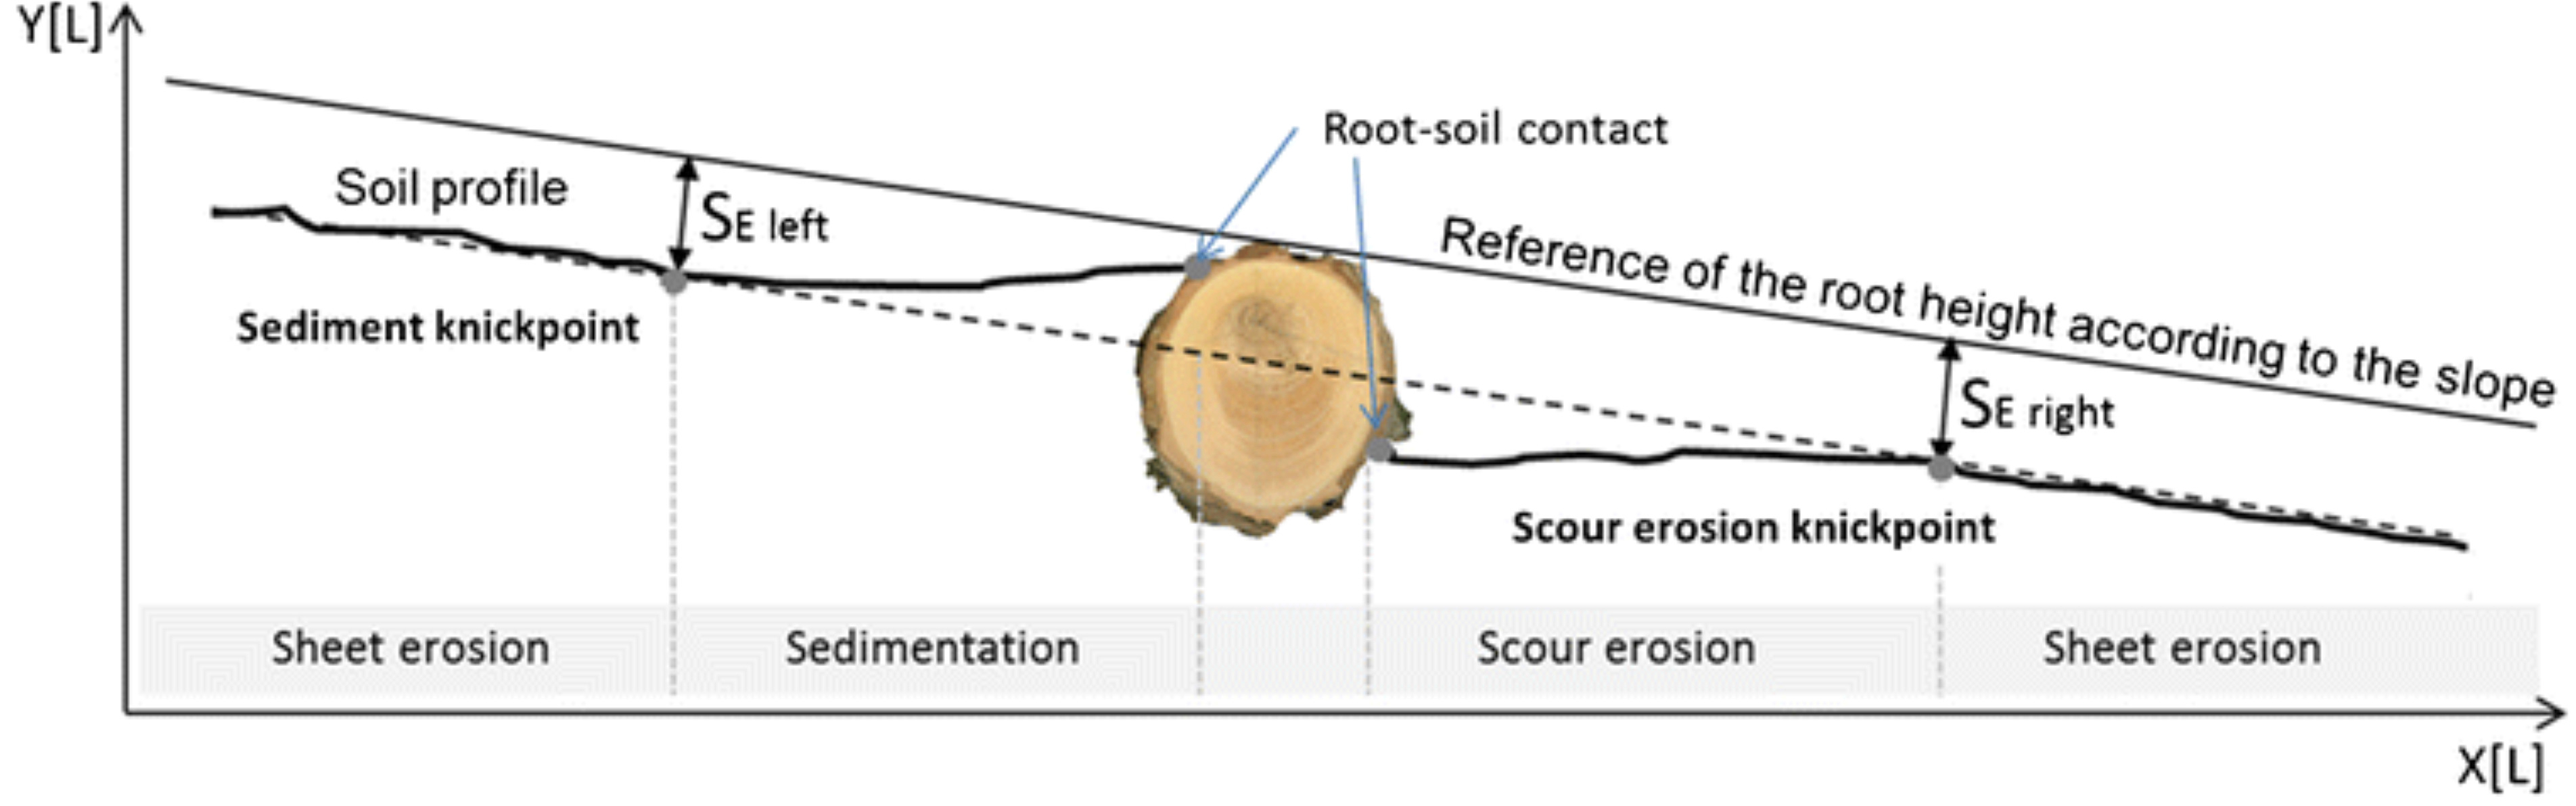
- Using the raster calculator available in any Geographic Information System (GIS) software, for each perpendicular profile measure the height between the top of the root and the ground surface using the knickpoint at the ground surface as a reference. At this point measurements of Ex are not influenced by sedimentation and/or scour erosion and, therefore, it is possible to measure soil erosion.
- Correct the measurement obtained in step 5.2.2 using the procedure in step 5.1.7.

Figure 6: Example drawing how to proceed when the exposed roots sampled are orientated according to the perpendicular to the runoff path. This figure shows a schematic view of a ground surface profile related to an exposed perpendicular root concerning the runoff path. Eroded soil thickness (Ex) is quantified at the knickpoint coinciding to prevailing sedimentation and scour erosion processes nearby the root. This figure has been modified from Ballesteros-Cánovas et al.35 Please click here to view a larger version of this figure.
6. Sheet Erosion Rate Estimation
- Depending on the soil mechanic characteristics of the study site, apply equation 1 (i.e., hypothesizes that the radial growth pressure applied by the root is lower than shear strength of the soil), or equation 2 (i.e., supposes stability of the root axis through time)30:
 (1)
(1)
 (2)
(2)
Where:
ER (mm∙yr-1), is the sheet erosion rate to be estimated.
EX (mm), is the thickness of the soil layer eroded since initial exposure. This is obtained by performing steps 5.1.1 to 5.2.3.
Gr1 and Gr2 (mm) represent the secondary (subsequent) growth on the upward/downward part of the root after exposure. It is obtained after performing step 5.1.7.
B1 and B2 (mm) are the bark thickness on the upper/Lower part of the root. It is obtained with the procedure in step 5.1.7.
ε (mm), is defined as the minimal depth of soil below which root begin to change its anatomical configuration.
NRex (yr), is the number of tree-rings developed after the year of exposure. It is obtained using steps 4.1.1 to 4.2.8.
Results
Samples of exposed roots suffer serious cambial deterioration due to the impact of exposure (e.g., modifications in temperature, incidence of light) plus the physical stress, due to trampling by hikers or animal grazing and browsing that the roots undergo after they are exposed. Determining the existence of discontinuous rings, as well as precisely dating the first year of response to exposure was accomplished in the lab as in Protocol 4 (steps 4.1.6 to 4.1.8). We chose the incre...
Discussion
The protocol deployed demonstrates the value of detailed and proper characterization of ground surface microtopography, as it enables to measure trustworthy sheet erosion rates from dendrogeomorphology. Our methodological approach focuses on the importance of characterizing the microtopography in the surroundings of exposure roots to improve erosion rate estimation. This factor has been largely ignored in previous studies, resulting in a misinterpretation of soil erosion rates derived from dendrogeomorphology
Disclosures
The authors have nothing to disclose.
Acknowledgements
The research projects that funded this research were: MARCoNI (CGL2013-42728-R); Dendro-Avenidas (CGL2007-62063); MAS Dendro-Avenidas (CGL2010-19274) of the Spanish Ministry of Science and Technology and the project IDEA-GESPPNN (OAPN 163/2010), which was funded by the Environmental Ministry of Spain.
Materials
| Name | Company | Catalog Number | Comments |
| Topographic map, soil map, land cover map | To be obtained from public institutions or generate at the first phase of research | ||
| Single ring infiltometer | Turf-Tec International | IN16-W | http://www.turf-tec.com/IN16Lit.html |
| Handsaw | There is noy any specific characteristics to be considered regarding the model | ||
| Measuring tape | With accuracy of 1 mm | ||
| Terrestrial Laser Scanning (TLS) | Leica-Geosystems | Leica ScanStation P16 | https://leica-geosystems.com/products/laser-scanners/scanners/leica-scanstation-p16 |
| Microtopographic Profile Gauge | RS Online | Facom, 19 | https://www.classic-conservation.com/es/herramientas-para-talla-y-escultura-en-madera/511-galga-medidora-de-perfiles.html |
| Sandpaper | from 80 to 400 grit | ||
| Scanner | EPSON | Perfection V800 Photo | https://www.epson.co.uk/products/scanners/consumer-scanners/perfection-v800-photo |
| Image analysis system | Regent Instruments Inc. | WinDENDRO | http://www.regentinstruments.com/assets/windendro_analysisprocess.html |
| Measuring table | IML | https://www.iml-service.com/product/iml-measuringtable/ | |
| Sliding microtome | Thermo Fisher SCIENTIFIC | Microm HM 450-387760 | http://www.thermofisher.com/order/catalog/product/910020 |
| Optical microscope | OLYMPUS | MX63/MX63L | https://www.olympus-ims.com/en/microscope/mx63l/ |
| Digital camera for microscope | OLYMPUS | DP74 | https://www.olympus-ims.com/en/microscope/dc/ |
| Safranin | Empirical Formula (Hill Notation) C20H19ClN4 | ||
| Astrablue | Empirical Formula C47H52CuN14O6S3 | ||
| Alcohol | Alcohol by volume (50%, 75% and 100%) | ||
| Distilled water | H2O | ||
| Citrus oil clearing agent | https://www.nationaldiagnostics.com/histology/product/histo-clear | ||
| Coated slides | Thermo Fisher SCIENTIFIC | https://www.fishersci.com/us/en/products/I9C8JXMT/coated-glass-microscope-slides.html | |
| Hardening epoxy | MERCK | https://www.sigmaaldrich.com/catalog/product/sial/03989?lang=es®ion=ES |
References
- Montgomery, D. R. Soil erosion and agricultural sustainability. Proceedings of the National Academic of Sciences of the United States of America. 104 (33), 13268-13272 (2007).
- Novara, A., Gristina, L., Saladino, S. S., Santoro, A., Cerdà, A. Soil erosion assessment on tillage and alternative soil managements in a Sicilian vineyard. Soil & Tillage Research. 117, 140-147 (2011).
- Desir, G., Marín, C. Factors controlling the erosion rates in a semi-arid zone (Bardenas Reales, NE Spain). Catena. 71 (1), 31-40 (2007).
- Shi, Z., Wen, A., Zhang, X., Yan, D. Comparison of the soil losses from 7Be measurements and the monitoring data by erosion pins and runoff plots in the Three Gorges Reservoir region, China. Applied Radiation and Isotopes. 69 (10), 1343-1348 (2011).
- Sirvent, J., Desir, G., Gutierrez, M., Sancho, C., Benito, G. Erosion rates in badland areas recorded by collectors, erosion pins and profilometer techniques (Ebro Basin, NE-Spain). Geomorphology. 18 (2), 61-75 (1997).
- Flanagan, D., Ascough, J., Nearing, M., Laflen, J., Harmon, R. S., Doe, W. W. The Water Erosion Prediction Project (WEPP) model. Landscape Erosion and Evolution Modelling. , 145-199 (2001).
- Alestalo, J. Dendrochronological interpretation of geomorphic processes. Fennia -International Journal of Geography. 105, 1-139 (1971).
- Cook, E. R., Kalriukstis, L. A. Methods of Dendrochronology. Methods of Dendrochronology. , 97-104 (1990).
- Pelfini, M. Dendrogeomorphological study of glacier fluctuations in the Italian Alps during the Little Ice Age. Annals of Glaciology. 28 (1639), 123-128 (1999).
- Malik, I., Matyja, M. Bank erosion history of a mountain stream determined by means of anatomical changes in exposed tree roots over the last 100 years (Bílá Opava River - Czech Republic). Geomorphology. 98 (1-2), 126-142 (2008).
- Stoffel, M., Bollschweiler, M., Butler, D., Luckman, B. . Tree Rings and Natural Hazards: A State-of-the-art. , (2010).
- Ballesteros, J. A., Bodoque, J. M., Díez-Herrero, A., Sanchez-Silva, M., Stoffel, M. Calibration of floodplain roughness and estimation of flood discharge based on tree-ring evidence and hydraulic modelling. Journal of Hydrology. 403 (1-2), 103-115 (2011).
- Procter, E., Stoffel, M., Schneuwly-Bollschweiler, M., Neumann, M. Exploring debris-flow history and process dynamics using an integrative approach on a dolomitic cone in western Austria. Earth Surface Processes and Landforms. 37 (9), 913-922 (2012).
- Corona, C., Saez, J. L., Stoffel, M., Rovéra, G., Edouard, J. L., Berger, F. Seven centuries of avalanche activity at Echalp (Queyras massif, southern French Alps) as inferred from tree rings. Holocene. 23 (2), 292-304 (2013).
- Ballesteros-Cánovas, J. A., et al. Can tree tilting be used for paleoflood discharge estimations?. Journal of Hydrology. 529 (P2), 480-489 (2015).
- Šilhán, K. Dendrogeomorphic chronologies of landslides: Dating of true slide movements. Earth Surface Processes and Landforms. 42 (13), 2109-2118 (2017).
- Ballesteros Cánovas, J. A., et al. Gully evolution and geomorphic adjustments of badlands to reforestation. Scientific Reports. , (2017).
- Ballesteros-Cánovas, J. A., et al. Dendrogeomorphology in badlands: Methods, case studies and prospects. Catena. 106, 113-122 (2013).
- Stoffel, M., Corona, C., Ballesteros-Cánovas, J. A., Bodoque, J. M. Dating and quantification of erosion processes based on exposed roots. Earth-Science Reviews. 123, 18-34 (2013).
- Grissino-Mayer, H. D. An updated list of species used in tree-ring research. Tree-Ring Bulletin. 53, 17-43 (1993).
- Bodoque, J. M., Lucía, A., Ballesteros, J. A., Martín-Duque, J. F., Rubiales, J. M., Genova, M. Measuring medium-term sheet erosion in gullies from trees: A case study using dendrogeomorphological analysis of exposed pine roots in central Iberia. Geomorphology. 134 (3-4), 417-425 (2011).
- LaMarche, V. Rate of slope erosion in the White Mountains, California. Geological Scociety of America Bulletin. 72 (10), 1579-1580 (1961).
- LaMarche, V. C. Rates of Slope Degradation as Determined from Botanical Evidence White Mountains California Rates of Slope Degradation as Determined from Botanical Evidence White Mountains California. U.S. Geological Survey Professional Paper. 352 (1), 354-376 (1968).
- Bodoque, J. M., Dies-Herrero, A., Martin-Duque, J. F., Rubiales, J. M., Godfrey, A., Pedraza, J., Carrasco, R. M., Sanz, M. A. Sheet erosion rates determined by using dendrogeomorphological analysis of exposed tree roots: Two examples from Central Spain. Catena. 64 (1), 81-102 (2005).
- Carrara, P. E., Carroll, T. R. The determination of erosion rates from exposed tree roots in the piceance basin, colorado. Earth Surface Processes and Landforms. 4 (4), 307-317 (1979).
- Fayle, D. . Radial Growth in Tree Roots - Distribution, Timing, Anatomy. , (1968).
- Gärtner, H., Schweingruber, F., Dikau, R. Determination of erosion rates by analyzing structural changes in the growth pattern of ex- posed roots. Dendrochronologia. 19, 81-91 (2001).
- Hitz, O. M., Gärtner, H., Heinrich, I., Monbaron, M. Application of ash (Fraxinus excelsior L.) roots to determine erosion rates in mountain torrents. Catena. 72 (2), 248-258 (2008).
- Rubiales, J. M., Bodoque, J. M., Ballesteros, J. A., Diez-Herrero, A. Response of Pinus sylvestris roots to sheet-erosion exposure: An anatomical approach. Natural Hazards and Earth System Science. 8 (2), 223-231 (2008).
- Corona, C., Lopez Saez, J., Rovéra, G., Stoffel, M., Astrade, L., Berger, F. High resolution, quantitative reconstruction of erosion rates based on anatomical changes in exposed roots at Draix, Alpes de Haute-Provence - critical review of existing approaches and independent quality control of results. Geomorphology. 125 (3), 433-444 (2011).
- McAuliffe, J. R., Scuderi, L. A., McFadden, L. D. Tree-ring record of hillslope erosion and valley floor dynamics: Landscape responses to climate variation during the last 400 yr in the Colorado Plateau, northeastern Arizona. Global and Planetary Change. 50 (3-4), 184-201 (2006).
- Danzer, S., Dean, J., Meko, D. M., Sewtnam, T. W. Rates of slope erosion determined from exposedroots of ponderosa pine at Rose Canyon Lake, Arizona. Tree Rings, Environment, and Humanity. , 671-678 (1996).
- Gärtner, H. Tree roots - Methodological review and new development in dating and quantifying erosive processes. Geomorphology. 86 (3-4), 243-251 (2007).
- Bodoque, J. M., Ballesteros-Cánovas, J. A., Lucía, A., Díez-Herrero, A., Martín-Duque, J. F. Source of error and uncertainty in sheet erosion rates estimated from dendrogeomorphology. Earth Surface Processes and Landforms. 40 (9), 1146-1157 (2015).
- Ballesteros-Cánovas, J. A., Corona, C., Stoffel, M., Lucia-Vela, A., Bodoque, J. M. Combining terrestrial laser scanning and root exposure to estimate erosion rates. Plant and Soil. 394 (1-2), 127-137 (2015).
- Bodoque, J. M., Ballesteros-Cánovas, J. A., Rubiales, J. M., Perucha, M. &. #. 1. 9. 3. ;., Nadal-Romero, E., Stoffel, M. Quantifying Soil Erosion from Hiking Trail in a Protected Natural Area in the Spanish Pyrenees. Land Degradation & Development. 28, 2255-2267 (2017).
- Misra, R., Dexter, A., Alston, A. Maximum axial and radial growth pressures of plant-roots. Plant and Soil. 95 (3), 315-326 (1996).
- Clark, L. J., Bengough, A. G., Whalley, W. R., Dexter, A. R., Barraclough, P. B. Maximum axial root growth pressure in pea seedlings: Effects of measurement techniques and cultivars. Plant and Soil. 209 (1), 101-109 (1999).
- Gärtner, H., Cherubini, P., Fonti, P., von Arx, G., Schneider, L., Nievergelt, D., Verstege, A., Bast, A., Schweingruber, F. H., Büntgen, U. A. A Technical Perspective in Modern Tree-ring Research - How to Overcome Dendroecological and Wood Anatomical Challenges. Journal of Visualized Experiments. (97), 1-10 (2015).
- Antonova, G., Stasova, V. Effects of environmental factors on wood formation in Scots pine stems. Trees. 7 (4), 214-219 (1993).
- Saez, J. L., Corona, C., Stoffe, M., Rovéra, G., Astrade, L., Berger, F. Mapping of erosion rates in marly badlands based on a coupling of anatomical changes in exposed roots with slope maps derived from LiDAR data. Earth Surface Processes and Landforms. 36 (9), 1162-1171 (2011).
- Zimmermann, M. . Xylem Structure and the Ascent of Sap. , (1983).
- Tyree, M., Sperry, J. Characterization and propagation of acoustic emission signals in woody plants: towards an improved acoustic emission counter. Plant, Cell and Environment. 12, 371-382 (1989).
- Zheng, M., Chen, X. Statistical determination of rainfall-runoff erosivity indices for single storms in the Chinese Loess Plateau. PLoS One. 10 (3), 1-18 (2015).
- Morgan, R. P., Quiton, J. N., Smith, R. E., Govers, G., Poesen, J. W., Auerswald, K., Chisci, G., Torri, D., Stycaen, M. E. The European Soil Erosion Model (Eurosem): a Dynamic Approach for Predicting Sediment Transport From. Earth Surface Processes and Landforms. 23, 527-544 (1998).
- Ciampalini, R., Follain, S., Le Bissonnais, Y. LandSoil: A model for analysing the impact of erosion on agricultural landscape evolution. Geomorphology. 175, 25-37 (2012).
- Hammitt, W., Cole, D. . Wildland recreation: ecology and management. , (1998).
- Marion, J. L., Leung, Y. F., Nepal, S. K. Monitoring trail conditions: new methodological considerations. George Wright Society Forum. 23 (2), 36-49 (2006).
- Tomczyk, A. M., Ewertowski, M. W. Recreational trails in Poprad Landscape Park , Poland the spatial pattern of trail impacts and use-related, environmental and managerial factors. Journal of Maps. 12, 1227-1235 (2015).
- Jewell, M. C., Hammitt, W. E., Cole, D. N., McCool, S. F., Borrie, W. T., O'Loughlin, J. Assessing soil erosion on trails: A comparison of techniques. Proceedings: Wilderness Science in a time of change Conference Volume 5: Wilderness Ecosystems, Threats, and Management (Proceedings RMRS-P-15-VOL-5). , 133-140 (2000).
- Krause, C., Eckstein, D. Dendrochronology of roots. Dendrochronologia. 11, 9-23 (1993).
- Krause, C., Morin, H. Root growth and absent rings in mature black spruce and balsam fir, Quebec, Canada. Dendrochronologia. 16, 21-35 (1999).
- Poesen, J. Gully erosion and environmental change: importance and research needs. Catena. 50 (2-4), 91-133 (2003).
- Favis-Mortlock, D., Boardman, J. Nonlinear responses of soil erosion to climate change: a modelling study on the UK South Downs. Catena. 25 (1-4), 365-387 (1995).
- Boardman, J., Favis-mortlock, D. Frequency-magnitude distributions for soil erosion, runoff and rainfall - a comparative analysis. Zeitschrift für Geomorphologie. 115, 51-70 (1999).
- Haubrock, S. N., Kuhnert, M., Chabrillat, S., Güntner, A., Kaufmann, H. Spatiotemporal variations of soil surface roughness from in situ laser scanning. Catena. 79 (2), 128-139 (2009).
Reprints and Permissions
Request permission to reuse the text or figures of this JoVE article
Request PermissionThis article has been published
Video Coming Soon
Copyright © 2025 MyJoVE Corporation. All rights reserved