
A subscription to JoVE is required to view this content. Sign in or start your free trial.
Method Article
Leaf Area Index Estimation Using Three Distinct Methods in Pure Deciduous Stands
In This Article
Summary
An accurate estimation of leaf area index (LAI) is crucial for many models of material and energy fluxes within plant ecosystems and between an ecosystem and the atmospheric boundary layer. Therefore, three methods (litter traps, needle technique, and PCA) for taking precise LAI measurements were in the presented protocol.
Abstract
Accurate estimations of leaf area index (LAI), defined as half of the total leaf surface area per unit of horizontal ground surface area, are crucial for describing the vegetation structure in the fields of ecology, forestry, and agriculture. Therefore, procedures of three commercially used methods (litter traps, needle technique, and a plant canopy analyzer) for performing LAI estimation were presented step-by-step. Specific methodological approaches were compared, and their current advantages, controversies, challenges, and future perspectives were discussed in this protocol. Litter traps are usually deemed as the reference level. Both the needle technique and the plant canopy analyzer (e.g., LAI-2000) frequently underestimate LAI values in comparison with the reference. The needle technique is easy to use in deciduous stands where the litter completely decomposes each year (e.g., oak and beech stands). However, calibration based on litter traps or direct destructive methods is necessary. The plant canopy analyzer is a commonly used device for performing LAI estimation in ecology, forestry, and agriculture, but is subject to potential error due to foliage clumping and the contribution of woody elements in the field of view (FOV) of the sensor. Eliminating these potential error sources was discussed. The plant canopy analyzer is a very suitable device for performing LAI estimations at the high spatial level, observing a seasonal LAI dynamic, and for long-term monitoring of LAI.
Introduction
LAI, defined as half of the total leaf surface area per unit of horizontal ground surface area1, is a key variable used in many bio-geophysical and chemical exchange models focused on carbon and water fluxes2,3,4. LAI is directly proportional to the active surface of leaves where it drives primary production (photosynthesis), transpiration, energy exchange, and other physiological attributes connected with a range of ecosystem processes in plant communities5.
Numerous approaches and instruments for performing LAI estimation have been developed, and they are currently available on the market6,7,8,9. Ground-based methods for performing LAI estimation can be grouped into two main categories: (i) direct, and (ii) indirect methods10,11,12. The first group includes methods measuring leaf area directly, while the indirect methods infer LAI from measurements of more readily measurable parameters, using radiative transfer theory (in terms of time, labour-intensiveness, and technology)13,14.
This protocol deals with the practical use of litter traps and the needle technique, as non-destructive semi-direct methods10; and the optical device plant canopy analyzer as an indirect method6,7 for performing LAI estimation on a chosen sample from temperate deciduous forest stands in Central Europe (see its structural and dendrometric characteristics in Appendix A and Appendix B).
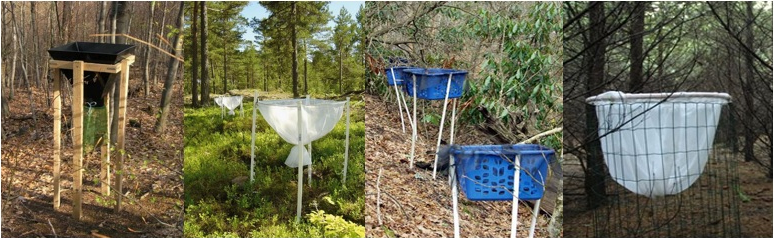
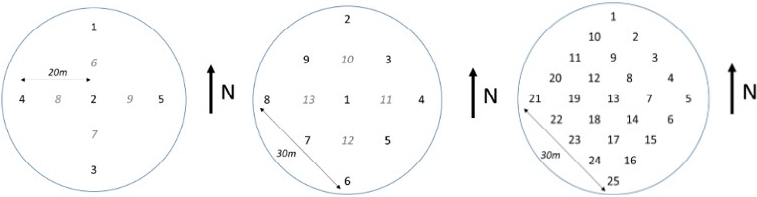
In deciduous forests and crops, it is possible to perform non-destructive semi-direct LAI estimation using litter traps11 distributed below the canopy layer15. Litter traps provide precise LAI values for deciduous species in which LAI reaches a plateau within the growing season. However, for species that can replace leaves during the growing season, such as poplar, the method overestimates LAI11. This method assumes that the content of the traps represents the average amount of leaves that fall during a leaf-fall period in the stand16, especially during the autumn months. Traps are opened boxes or nets (Figure 1) with a predetermined sufficient size (minimum 0.18 m2, but preferably over 0.25 m2)10,17, lateral sides preventing the wind from blowing leaves into/out of the traps, and with a perforated bottom avoiding decomposition of the leaves; which are located below the canopy layer of the studied stand, however, above the ground surface11. The distribution of the traps can be either random18 or systematic in transects19 or a regular spacing grid20. The number and distribution of traps are a crucial methodological step for performing an accurate LAI estimation reflecting the unique stand structure, spatial homogeneity, expected wind speed and direction, especially in the case of sparse stands (or alleys and orchards), and the work capacity for evaluating data. The precision of LAI estimation increases with the rising frequency of traps within studied stands11,21 (see Figure 2).
The recommended frequency of collecting samples of the litter-fall from each trap is at least monthly10 and even twice per week in periods of heavy fall, which may coincide with heavy rainfall. It is necessary to prevent decomposition of the litter in the traps and the leaching of nutrients from the material during rain episodes in the case of chemical analysis. After collecting leaves in a field, a mixed sub-sample is used for estimating the specific leaf area (SLA, cm2 g-1)22, defined as the fresh projected area of leaves to its dry mass weight ratio. The rest of the collected litter is dried to a constant weight and used for calculating the dry mass of the litter as g cm-2 in the lab. Leaf dry mass on each collection date is converted into the leaf area by multiplying the collected biomass by SLA or leaf dry mass per area (LMA, g cm-2) as the inverse parameter to SLA23,24. A fresh projected area of particular leaves can be determined using a planimetric approach. The planimetric method is based on the dependency between the area of a specific leaf and the area covered by the leaf in the horizontal surface. The leaf is horizontally fixed to the scan screen, and its average is measured using a leaf area meter. Then, its area is calculated. Many leaf area meters based on different measurement principles are available on the market. Some of them include, for instance, the LI-3000C Portable Leaf Area Meter, which uses the orthogonal projection method, and the LI-3100C Area Meter, which measures leaf average using a fluorescent light source and a semi-conducted scanning camera. The next device, the CI-202 portable laser leaf area meter, codes a leaf length using a code reader. Besides them, the AM350 and BSLM101 Portable Leaf Area Meters are also commonly used for performing accurate leaf area estimation.
Furthermore, leaf area meters based on systems that analyze video exist. These leaf area meters consist of a video camera, a digitalisation frame, a screen, and a PC, including suitable software for making the data analysis such as WD3 WinDIAS Leaf Image Analysis System11. Currently, conventional scanners connected to a PC can be used for an estimating leaf area. Afterwards, the leaf area is calculated as a multiple of the number of black pixels and its size depends on the selected resolution (dots per inch – dpi), or the leaf area is measured through specific software, for instance, WinFOLIA. Finally, the total dry mass of leaves collected within a known ground surface area is converted into the LAI by multiplying by SLA and a shrinkage coefficient25 which reflects the changes in the area of fresh and dried leaves. Shrinkage depends on the tree species, water content and leaf softness. The shrinkage of leaves in length and width (what affect the projected area) is usually up to 10%26, for instance, it ranges from 2.6 to 6.8% for oak27. Sorting leaves by species for weighing and establishing the specific leaf area ratio is necessary to determine the contribution of each species to the total LAI28.
LAI determination by the needle technique is an inexpensive method derived from the inclined point quadrat method29,30,31,32. In deciduous stands, it is an alternative for performing LAI estimation without using traps10 based on the assumption that the total leaf number and their area in a tree are equal to what is collected on the soil surface after a complete leaf-fall20. A thin sharp needle is pierced vertically into the litter lying on the ground immediately after the leaf-fall10. After the complete leaf-fall, the leaves are collected from the ground onto a needle of a vertical probe, are related to the contact number and equal the actual LAI value. An intensive sampling (100-300 sampling points per studied stand per field probe) by the needle technique is required to quantify a mean contact number and to derive the LAI value correctly10,20,33.
The plant canopy analyzer (e.g., LAI-2000 or LAI-2200 PCA) is a commonly used portable instrument for performing an indirect LAI estimation by taking a measurement of the light transmission throughout the canopy7 within the filtered blue portion of the light spectrum (320-490 nm)34,35 to minimize the contribution of the light which has passed through the leaves, was scattered by the canopy and is passing through the foliage7,34. In the blue part of the light spectrum, the maximum contrast between the leaf and sky is achieved, and the foliage appears black against the sky34. Therefore, it is based on the canopy gap fraction analysis7. The instrument has been widely used for making eco-physiological studies in plant communities such as crops36, grasslands37, coniferous stands8, and deciduous stands38. The plant canopy analyzer uses a fisheye optical sensor with a FOV of 148° 35 to project a hemispherical image of the canopy onto silicon detectors to arrange them into five concentric rings39 with central zenith angles of 7°, 23°, 38°, 53°, and 68° 9,40,41. Five view caps (i.e., 270°, 180°, 90°, 45°, and 10°) can be used to restrict the azimuth view of the optical sensor27 to avoid shading by obstacles in an open area (for the above-referenced reading) or the operator in the sensor’s FOV during LAI estimation can adjust the FOV sensor to an open area for above-canopy readings. Measurements using the plant canopy analyzer are taken above (or in a sufficiently extended open area) and below the studied canopy7. The same view caps must be used for both above and below readings to avoid biases of gap fraction estimation34. The LAI-2000 PCA produces an effective leaf area index (LAIe) as introduced by Chen et al.42, or rather an effective plant area index (PAIe) as woody elements are included in the sensor reading value. In deciduous stands with flat leaves, the LAIe is the same as the hemi-surface LAI. In the case of evergreen forest stands, the LAIe is necessary to correct for the clumping effect at the shoot level (SPAR, STAR)43, the clumping index at scales larger than the shoot (ΩE)44, and the contribution of woody elements including stems and branches (i.e., woody-to-total area ratio),45 which cause a systematic LAI underestimation20. The clumping index on a higher spatial scale than the shoot or leaf could be quantified as an apparent clumping index (ACF), which can be estimated using the plant canopy analyzer when more restrictive view caps are used27. As these authors state that this ACF is deduced from a ratio of LAI values calculated from transmittance by different procedures for homogeneous and non-homogeneous canopies according to Lang46, we presume that this clumping index describes rather canopy homogeneity. Besides the ACF calculation, new diffuser caps that enable a more extensive application of LAI-2200 PCA in respect of weather conditions, a user menu instead of Fct codes, and the possibility to take many more measurements per file session are among the main technological upgrades compared to the former LAI-2000 PCA34,47. Measurements and subsequent internal software calculations are based on four assumptions: (1) light blocking plant elements including leaves, branches, and stems, are randomly distributed in the canopy, (2) foliage is an optically black body that absorbs all the light it receives, (3) all plant elements are the same projection to the horizontal ground surface as a simple geometric convex shape, (4) plant elements are small compared to the area covered by each ring11.
Protocol
1. LAI estimated using litter traps
- First, perform a field survey, investigating the site conditions and structure of the studied stands (i.e., inclination and exposition of the slope, forest or vegetation type, forest or vegetation density, homogeneity of the canopy closure, the crown size, and the crown base height).
- Select a suitable litter trap type for positioning below the canopy by choosing the mesh size of the net based on the size of the assimilation apparatus of the studied stands (i.e., the mesh size has to be smaller than the size of the captured assimilation apparatus), then number and distribute the traps within the studied stands, and subsequently label them.
- Typically, use a number of traps ranging from 15 to 25 per investigated stand25,48 with a capturing area ranging from 0.18 m2 up to 0.5 m2 or more, especially for tree species with large leaves such as poplar10,17,48.
- Place the traps at regular spacing throughout the studied stand within one or two mutually perpendicular transects or a regular grid (Figure 2). The proper sampling design, procedure, and analysis of the litter-fall are also described by Ukonmaanaho et al.17 or Fleck et al.21.
- Determine the distance between the traps on crown sizes, canopy closure and stand texture.
- Increase the number of litter traps both with rising stand area and stand heterogeneity in texture.

Figure 1: Different types of litter traps´ construction and their location within the stand.
From the left: woody, plastic, plastic boxes, and metal construction. Please click here to view a larger version of this figure.
- Install the traps at the beginning of the growing season (soon after the leaf flushing because a leaf-fall can occur due to either damage by insects or extremely dry weather events in the summer period).
- Firmly fix each of the traps above the ground surface and below the stand canopy so that there are no changes of the capturing area. Maintain each of the traps in a horizontal position and stable normalized capturing area. Examples of different kinds of traps are presented in Figure 1 or, for instance, in Ukonmaanaho et al.17.

Figure 2: The regular schematic pattern of litter trap distribution in forest stands with distinct homogeneity.
The homogeneity decreases from the left. Please click here to view a larger version of this figure.
- Place the traps above the ground surface (minimum 0.1 m) to enable air to blow beneath the collecting part of the traps. Commonly, the height of the traps is 1 m above the ground surface25,38,49.
- Choose the time step for litter collection with regards to the typical course of weather in the studied site and litter-fall intensity. The standard time step ranges from 1 to 4 weeks (a shorter time step should be used during rainy weather to eschew litter decomposition and during intensive leaf falls).
- During each of the measurements, check the strength of the trap frames, the compactness of the nets or boxes, and the levelling of the whole trap (i.e., the horizontal position of the trap).
- Place the collected litter from each of the traps into previously labelled paper bags.
- Transport all samples preferably in cool boxes, or if necessary, temporarily stored at 4 °C, but not frozen17 due to damage to the leaf tissues.
- After transporting the samples to the lab, separate the assimilation apparatus from the other litter components (branches, seeds, bark, flowers; according to tree species if necessary).
- Immediately after sorting, analyze a part of a mixed (intermingled) sample of each litter trap for performing SLA estimation (i.e., the ratio between the projected area of leaves and its dry mass weight).
- Given that different tree species and even types of foliage (sunny and shaded) with differences in properties occur within the crown vertical profile, thoroughly mix the sample from each trap before selecting leaves for performing SLA (LMA) estimation11. As there is a difference between fresh and dry leaf projected area due to shrinkage, estimate a shrinkage correction coefficient from the subsample of fresh (green) leaves26.
- Collect leaves proportionally (similarly as in the mixed subsample from the trap) from all tree species located in the stand.
- Separate the sub-sample counting at least 100-200 leaves from all used traps21,27 for performing SLA estimation.
- Place leaves in a flat, straight manner either onto the scan board or the leaf area meter, and it is necessary to eschew overlapping the leaves there.
- As the dried litter leaves can fold or curl, soak them in hot water (60-70 °C) for a short time17,21. This has been found to flatten leaves sufficiently for taking measurements, but especially after a long time of soaking, they lose weight.
- If the scanner or leaf area meter does not enable upper illumination (to avoid reflectance and shadowing), use a suitable distribution of leaves either on a scan board or a leaf area meter conveyor (i.e. leaves are placed perpendicularly to the scan headlight) so that shadows do not form during scan headlight movement because it is difficult to remove the shadows during subsequent data processing.
- If a scanner connected to a PC is used, use a resolution of the black-and-white pictures of 200 dpi at a minimum based on sufficient accuracy of the area.
- To avoid reflectance, which is visible as light pixels within the leaves, when an ordinary scanner is used, adjust the scan brightness to reach an appropriate threshold (Figure 3). Software (e.g., WinFOLIA) then estimates leaf area by counting the dark pixels in the scan and converts them using the known dpi resolution.
- Dry this sub-sample designated for SLA estimation for 48 hours at 80 or 105 °C to attain a constant weight. Use a ventilated oven with a thermostat to homogenize and maintain the internal temperature (e.g., IncuMax CV150).
NOTE: The water content in leaves remains as fixed water in cells when oven-drying occurs at lower temperatures. When drying at 105 °C, no water remains in the plant sample17. - Weigh the dry-mass of this sub-sample using lab scales with a high degree of accuracy of 1 g at a minimum.
- Check the levelling of the lab scales and avoid external effects (e.g., the blowing of strong wind in the lab during weighing).
- Calculate the SLA value as the fresh projected area of leaves of the sub-sample designated for SLA estimation divided by its dry mass weight.
- Given that different tree species and even types of foliage (sunny and shaded) with differences in properties occur within the crown vertical profile, thoroughly mix the sample from each trap before selecting leaves for performing SLA (LMA) estimation11. As there is a difference between fresh and dry leaf projected area due to shrinkage, estimate a shrinkage correction coefficient from the subsample of fresh (green) leaves26.

Figure 3: The scan of a leaf sample with an example of a correct quality scan (on left side) and an incorrect scan (right side)
when brightness should be adjusted to eliminate reflectance visible as white pixels inside the leaf bodies and/or where surface dirt (a) and any edge effect (b) should be deleted before making an analysis of area.
- Oven-dry the rest of the sample (i.e., collected leaves) for each trap for 48 hours at the same temperature that was used for SLA estimation, i.e., at 80 or 105 °C to reach a constant weight.
- Multiply the dry mass weight of the rest of the sample for each particular litter trap by the correct SLA value to reach the total projected leaf area per trap.
- Repeat steps from 1.5 to 1.9 for each of the studied stands and each litter collection date.
- Calculate the LAI as the ratio of the cumulative total leaf area estimated using litter traps and the capturing area of the litter traps.
2. Needle technique for taking LAI measurements
- Initially, perform a field survey, investigate the site conditions and the structure of the studied stands (i.e., inclination and exposition of the slope, forest or vegetation type, forest or vegetation density, homogeneity of the canopy closure, the crown size, and the crown base height).
- Immediately after a complete leaf-fall, prepare all necessary equipment including a sufficiently long sharp metallic needle with as small a diameter as possible (maximally 2.0 mm in diameter).
- Select a suitable number of randomly distributed sampling points (at least 100)10,20,38 based on the canopy structure of each studied stand.
NOTE: Generally, the more sampling points, the higher the accuracy of the LAI estimation in the studied stand (the number of sampling points should increase in relation to the size of the investigated plot and the structure of the canopy). - Using the metallic needle, puncture the leaves at a more or less similar angle through the layer of freshly fallen leaves that are lying on the ground surface at each of the probed sampling points.
- Use any angle of stab since these fallen leaves have no relationships to their previous position within the canopy.
- Check to make sure only freshly fallen leaves are present on the needle. In the case of the presence of partially decomposed leaves from the previous year, remove them from the needle.
- Count the number of leaves pierced by the needle with each stab at each sampling point.
- Repeat steps from 2.4 to 2.6 for all probed sampling points.
- Count the total of all leaves pierced by the needle within the whole stand (i.e., for at least 100 sampling points).
- Divide this sum by the number of stabs (i.e., counting the arithmetic mean). The resulted arithmetic average is equal to the actual LAI value at the stand level. Note: The average number of all fresh leaves collected on the needle corresponds to the true LAI value of the investigated forest stand.
3. Plant canopy analyzer optical device for performing LAI estimation
- At the beginning, perform a field survey, including investigating the site conditions and the structure of the studied stands (i.e., inclination and exposition of the slope, forest or vegetation type, forest or vegetation density, homogeneity of the canopy closure, the crown size, and the crown base height).
- Find a suitable open area (clearing) with identical sky conditions as above the observed plot, located a maximum distance of 1 km away21, which is required for above-canopy sensor readings.
- As the plant canopy analyzer enables the user to use a different FOV in both azimuth (by restriction view caps) as well as zenith (through software processing by ring masking) directions, apply the same cap (and its orientation) for both above- and below-canopy readings.
- Derive the size of the open area and the utilization of the appropriate view cap from the scope of the FOV. The known FOV of the sensor from the vertical in the zenith orientation and the estimation of the height of the nearest obstacles (trees, terrain, buildings) provide the most suitable solution, where the sufficient size of the open area can be calculated according to equation 1:
Y = H∙tg∙α (1),
Where Y is the required distance from the nearest barrier; H means the height of the obstacle; α denotes the FOV in a direction from vertical (Figure 4). Instead of the open area, a tower higher than the stand being investigated stand can be used for taking above-canopy readings21.- Take the slope and heterogeneity of the terrain into consideration when calculating the size of the open area.

Figure 4: A schematic depiction of the sensor´s FOV (a grey area).
α is the sensor´s FOV; H denotes the height of the nearest obstacle; Y means the horizontal distance between the operator and the obstacle63.
- Based on the structural parameters of the stand (canopy homogeneity), determine a suitable sampling point number, the location of equidistant sampling points situated in either transect, or a grid for taking below-canopy readings in the studied stand9.
- Deduce the appropriate distance from the variability of below-canopy readings in the field.
- Slowly move with the sensor below the canopy in transect and watch the variability of the most upper ring readings. Slight variability interrupted by higher values is a common result. Half of the distance between these peak values in variability should be considered appropriate.
- If an observation of the seasonal LAI dynamic is being performed, use permanent fixation of transects or sampling points within the studied stand (e.g., by wooden stakes or geological metal sticks).
NOTE: The number and spacing of transects depend on the particular canopy structure of the stand (Figure 5). - In homogenous stands, a sufficient number of transects ranges from 1 to 3. In the case of high heterogeneity, apply a regular grid of sampling points. Choose the orientation of transects with regards to slope and distribution of the trees in the stand, especially in case of row spacing. Spacing among particular sampling points is determined with respect to the heterogeneity of the stand, the crown sizes, the crown base height, and the sensor´s FOV (Figure 6). In homogenous stands, the number of sampling points commonly ranges between 5 and 36 46,50. Particular sampling designs are also described by Baret et al.51; Majasalmi et al.52; Woodgate et al.50; Fleck et al.21; Calders et al.53.
- With a sloping terrain, orient the sensor view along level curves.
- Deduce the appropriate distance from the variability of below-canopy readings in the field.

Figure 5: Layouts of measurements in pure deciduous stands.
(A), (B) Layouts of the optimal placing of particular transects in a pure plantation established by line planting (i.e., rectangular spacing). (C) The layout of the optimal placing of particular transects in a pure plantation established by line planting at triangular spacing. (D) The layout of the optimal placing of particular transects in a pure plantation established by line planting with two distinctly different parts. (E) The layout of the optimal placing of particular transects in a stand with four markedly distinct parts of the stand. (F) The layout of the optimal placing of particular transects in a pure plantation established by line planting with two different parts. (G) The layout of the optimal placing of particular transects in a pure plantation established by line planting with three markedly distinct parts representing 50%, 25%, and 25% of the whole area of the stand. (H) The layout of placing transects in stands established by natural regeneration, where approximately 12 measurement points per transect are sufficient from the accuracy point of view. Grey transects could be alternatively omitted from the measurement.

Figure 6: A schematic depiction of a spacing choice between measurement points within transects with regards to FOV, stand density, and height of the crown base.
a: suitable spacing distance in the case of the schematically displayed sensor height and view, and crown base height, c: unsuitable spacing distance as some canopy parts (d – in white) are not visible by the sensor. Thus, the spacing should be corrected (by b, i.e., a = c – b), c*: also corrected, suitable spacing distance due to the corrected enlarged sensor view angle (fine dashed line).
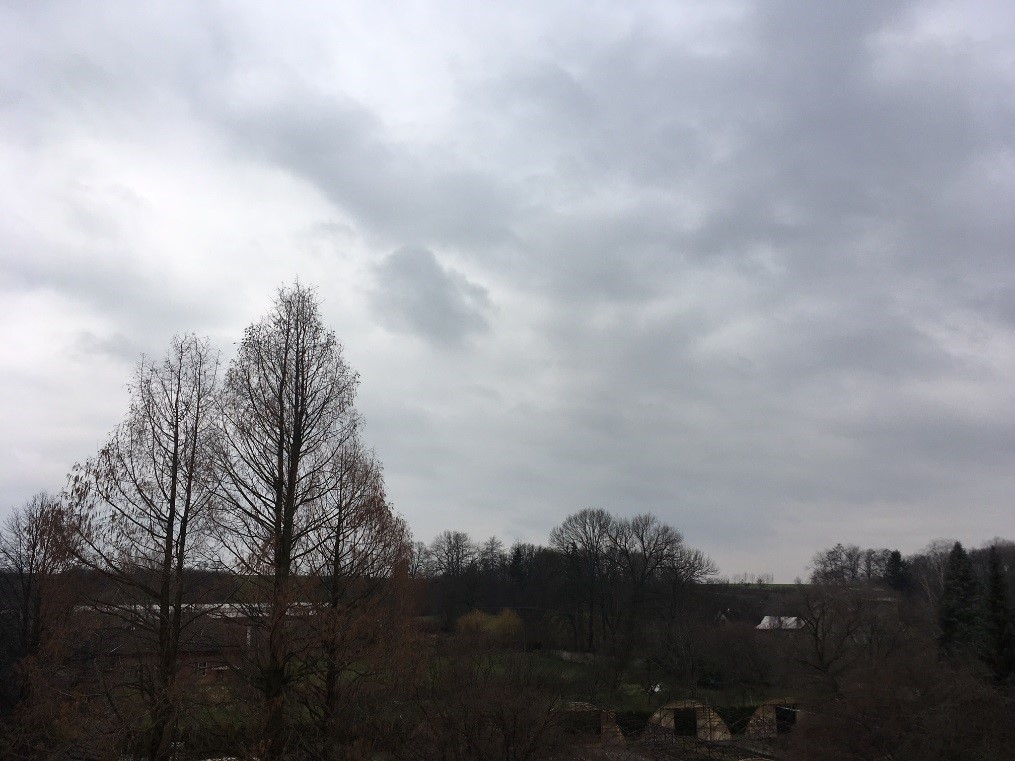
- Although some possibilities and corrections of LAI estimation under sunny conditions are presented47,54, conduct all measurements under a diffuse light sky (standard overcast) and windless conditions55,56 (see Figure 7). Despite the fact that the plant canopy analyzer enables correction of light scattering for measurements under sunny conditions21, the sensor’s producer recommends using it under standard overcast conditions34.
- Use the plant canopy analyzer out of direct sunlight, as sunlit foliage might appear as bright pixels on the image and improperly classify as the sky (the penumbra effect). Ideally, take the measurements under entirely overcast conditions (with uniform cloud cover), when diffuse light is evenly scattered throughout the sky.
- Reflectance is also obviously higher under sunlight compared to diffuse sky conditions. As an alternative, take measurements before sunrise or after sunset, when the sun is hidden below the horizon, and the vegetation is not backlit by the sun (keep in mind that during these times of the day, the light environment changes rapidly). However, also keep in mind that, due to the sensitivity of the sensor, reading values should be higher than ca. 3 in an open area.
- Avoid rain because raindrops on the sensor affect the precision of measurements. A wet canopy reflects more light, which can lead to LAI underestimation.
- Prevent heavy wind because moving plant elements might influence below-canopy readings, and thus they could cause incorrect results.
- Avoid foggy conditions within the canopy as well.

Figure 7: Optimal weather conditions for performing LAI estimation using a plant canopy analyzer. Please click here to view a larger version of this figure.
- If an observation of a seasonal course of the LAI is not needed, take all measurements from June to mid-September because the LAI of most tree species reaches its maximum value and remains (except during dry summers). Therefore, this period is the most suitable for making a LAI comparison during the growing season38,57,58,59.
NOTE: This period should be shorter or modified under drought conditions of on leaf fall or senescence. - Estimate the woody area index (WAI, Figure 10) during the leaf-off period (i.e., both before bud breaking in early spring and after complete leaf-fall in late autumn).
NOTE: Given that the plant canopy analyzer has only one visible band (320-490 nm)34,35 and cannot distinguish leaf and woody components, the results obtained during a growing season represent a plant area index (PAI) which is the sum of the LAI and WAI (PAI = LAI + WAI)60. Therefore, subtract the mean value of both WAI measurements taken in a leaf-off period from each of the PAI measurements estimated in the leaf-on period to obtain correct LAI values (LAI = PAI – WAI)20,38.- Perform the above canopy readings as the first measurement of each stand transect or grid in a sufficient open area (see step 3.2).
NOTE: It is possible to take dual-mode measurements because the LAI-2000 PCA (or its improved versions LAI-2200 PCA and LAI-2200C) enable making simultaneous estimations with two sensors together (i.e., one for below- and one for above-readings). In this case, the sensors should be calibrated in accordance with the instruction manual (LI-COR 2011). Briefly, it is recommended that the user connect both sensors to one control unit to unify readings and time, placing the sensor for above-canopy readings at the top of a tripod in an open area, levelling it, and using the same restriction view cap. The sensor view orientation should be the same in the azimuth direction as was used for taking below-canopy readings. - Perform the below-canopy readings in the spatial measurement design described in detail in 3.3. The sensor is usually held from 0.5 to 2.0 m above the ground21,38, i.e., above understory vegetation, below the canopy and with the visible sensor bubble-level.
- A bubble level is a component of the sensor. Use the restriction view caps if the sensor is held below 2.0 m to exclude the operator from the FOV. Use the identical view cap for both below- and above-readings.
- Use a minimum distance between the sensor and the nearest element of the plant´s above-ground parts (stems, branches) of at least four times the diameter or width of the component.
- Calculate the WAI values from field measured raw data using the LAI-2200 File Viewer (FV2200) freeware, which is available at https://www.licor.com/env/products/leaf_area/LAI-2200C/software.html.
- Restrict the sensor´s FOV in zenith direction to the upper three rings (i.e., 0-43°) to exclude an edge effect and big gap sizes20,61,62.
- Process the data using the standard algorithms for LAI-2000 PCA, and set parameters for making evaluations using FV2200 according to the user manual34.
- Determine annual WAI value as the arithmetic mean of both measurements performed before the beginning of the growing season (i.e., before bud breaking) and after complete leaf-fall (Figure 10).
- Perform the above canopy readings as the first measurement of each stand transect or grid in a sufficient open area (see step 3.2).
- Estimate PAI using the same procedure as was used for making the WAI estimation (from step 3.6.1-3.6.3.)
- Calculate the actual LAI value at the stand level as the difference between the mean PAI and WAI values (LAI = PAI – WAI)20,38.
Results
Average LAI values at the stand level of all studied stands in the 2013 growing season are presented in Figure 8. On all plots except A, the highest values were measured by litter traps, which serve as the reference level. Contrarily, the highest mean LAI value was estimated through the needle technique on plot A. All differences between LAI values estimated using litter traps and a plant canopy analyzer were not significant (p > 0.05; Figure 8, left). On pl...
Discussion
Litter traps are deemed as one of the most accurate methods for performing LAI estimation8, but they are more labor-intensive and time-consuming than the indirect methods35,64 which were incorporated into this protocol. Within the entire LAI estimation procedure using litter traps, a precise estimation of the SLA is the most critical point10 because the SLA can vary with plant species65, date...
Disclosures
The authors have nothing to disclose. The representative results were used from the article Černý J, Haninec P, Pokorný R (2018) Leaf area index estimated by direct, semi-direct, and indirect methods in European beech and sycamore maple stands. Journal of Forest Research. doi: 10.1007/s11676-018-0809-0 (online version) based on the kind permission of the Journal of Forestry Research editorial board.
Acknowledgements
We are indebted to the editorial board of the Journal of Forestry Research for encouraging and authorizing us to use the representative results in this protocol from the article published there. We also kindly thank two anonymous reviewers for their valuable comments, which have substantially improved the manuscript. The research was funded by the Ministry of Agriculture of the Czech Republic, institutional support MZE-RO0118 and the National Agency of Agricultural Research (Project No. QK1810126).
Materials
| Name | Company | Catalog Number | Comments |
| Area Meter | LI-COR Biosciences Inc., NE, USA | LI-3100C | https://www.licor.com/env/products/leaf_area/LI-3100C/ |
| Computer Image Analysis System | Regent Instruments Inc., CA | WinFOLIA | http://www.regentinstruments.com/assets/images_winfolia2/WinFOLIA2018-s.pdf |
| File Viewer | LI-COR Biosciences Inc., NE, USA | FV2200C Software | https://www.licor.com/env/products/leaf_area/LAI-2200C/software.html |
| Laboratory oven | Amerex Instruments Inc., CA, USA | CV150 | https://www.labcompare.com/4-Drying-Ovens/2887-IncuMax-Convection-Oven-250L/?pda=4|2887_2_0||| |
| Leaf Image Analysis System | Delta-T Devices, UK | WD3 WinDIAS | https://www.delta-t.co.uk/product/wd3/ |
| Litter traps | Any | NA | See Fig. 2 |
| Needle | Any | NA | Maximum diameter of 2 mm |
| Plant Canopy Analyser | LI-COR Biosciences Inc., NE, USA | LAI-2000 PCA | LAI-2200 PCA or LAI-2200C as improved versions of LAI-2000 PCA can be used, see: https://www.licor.com/env/products/leaf_area/LAI-2200C/ |
| Portable Laser Leaf Area Meter | CID Bio-Science, WA, USA | CI-202 | https://cid-inc.com/plant-science-tools/leaf-area-measurement/ci-202-portable-laser-leaf-area-meter/ |
| Portable Leaf Area Meter | ADC, BioScientic Ltd., UK | AM350 | https://www.adc.co.uk/products/am350-portable-leaf-area-meter/ |
| Portable Leaf Area Meter | Bionics Scientific Technogies (P). Ltd., India | BSLM101 | http://www.bionicsscientific.com/measuring-meters/leaf-area-index-meter.html |
| Portable Leaf Area Meter | LI-COR Biosciences Inc., NE, USA | LI-3000C | https://www.licor.com/env/products/leaf_area/LI-3000C/ |
References
- Chen, J. M., Black, T. A. Defining leaf area index for non-flat leaves. Plant, Cell and Environment. 15 (4), 421-429 (1992).
- Sellers, J. P., et al. Modelling the exchanges of energy, water, and carbon between continents and the atmosphere. Science. 275, 502-509 (1997).
- Calvet, J. C., et al. An interactive vegetation SVAT model tested against data from six contrasting sites. Agricultural and Forest Meteorology. 92 (2), 73-95 (1998).
- Wang, Y. P., Leuning, R. A two-leaf model for canopy conductance, photosynthesis and partitioning of available energy. I. Model description and comparison with multi-layered model. Agricultural and Forest Meteorology. 91 (1-2), 89-111 (1998).
- Asner, G. P., Scurlock, J. M. O., Hicke, J. A. Global synthesis of leaf area index observations: implications for ecological and remote sensing studies. Global Ecology and Biogeography. 12, 191-205 (2003).
- Welles, J. M. Some indirect methods of estimating canopy structure. Remote Sensing Reviews. 5 (1), 31-43 (1990).
- Welles, J. M., Cohen, S. Canopy structure measurement by gap fraction analysis using commercial instrumentation. Journal of Experimental Botany. 47 (302), 1335-1342 (1996).
- Chen, J. M., Rich, P. M., Gower, S. T., Norman, J. M., Plummer, S. Leaf area index of boreal forests: Theory, techniques, and measurement. Journal of Geophysical Research. 102 (D24), 29429-29443 (1997).
- Weiss, M., Baret, F., Smith, G. J., Jonckheere, I., Coppin, P. Review of methods for in situ leaf area index (LAI) determination. Part II. Estimation of LAI, errors and sampling. Agricultural and Forest Meteorology. 121, 37-53 (2004).
- Bréda, N. J. J. Ground-based measurements of leaf area index: a review of methods, instruments and current controversies. Journal of Experimental Botany. 54, 2403-2417 (2003).
- Jonckheere, I., et al. Review of methods for in situ leaf area index determination. Part I. Theories, sensors, and hemispherical photography. Agricultural and Forest Meteorology. 121 (1-2), 19-35 (2004).
- Zheng, G., Moskal, M. Retrieving leaf area index (LAI) using remote sensing: theories, methods and sensors. Sensors. 9 (4), 2719-2745 (2009).
- Fassnacht, K. S., Gower, S. T., Norman, J. M., McMurtrie, R. E. A comparison of optical and direct methods for estimating foliage surface area index in forests. Agricultural and Forest Meteorology. 71 (1-2), 183-207 (1994).
- Gower, S. T., Kucharik, C. J., Norman, J. M. Direct and indirect estimation of leaf area index, fAPAR, and net primary production of terrestrial ecosystems. Remote Sensing of Environment. 70 (1), 29-51 (1999).
- Chason, J. W., Baldocchi, D. D., Huston, M. A. A comparison of direct and indirect methods for estimating forest canopy leaf area. Agricultural and Forest Meteorology. 57 (1-3), 107-128 (1991).
- Eriksson, H., Eklundh, L., Hall, K., Lindroth, A. Estimating LAI in deciduous forest stands. Agricultural and Forest Meteorology. 129 (1-2), 27-37 (2005).
- Ukonmaanaho, L., Pitman, R., Bastrup-Birk, A., Bréda, N. J. J., Rautio, P. . Sampling and analysis of litterfall. Manual Part XIII. In: UNECE ICP Forests Programme Co-ordinating Centre (ed.): Manual on methods and criteria for harmonized sampling, assessment, monitoring and analysis of the effects of air pollution on forests. , (2016).
- McShane, M. C., Carlile, D. W., Hinds, W. T. The effect of collector size on forest litter-fall collection and analysis. Canadian Journal of Forest Research. 13 (6), 1037-1042 (1993).
- Battaglia, M., Cherry, M., Beadle, C., Sands, P., Hingston, A. Prediction of leaf area index in eucalypt plantations: effects of water stress and temperature. Tree Physiology. 18 (8-9), 521-528 (1998).
- Dufrêne, E., Bréda, N. J. J. Estimation of deciduous forest leaf area index using direct and indirect methods. Oecologia. 104 (2), 156-162 (1995).
- Fleck, S., et al. . Leaf area measurements. Manual Part XVII. In: UNECE ICP Forests Programme Co-ordinating Centre (Ed.) Manual of methods and criteria for harmonized sampling, assessment, monitoring and analysis of the effects of air pollution on forests. , (2016).
- Fellner, H., Dirnberger, G. F., Sterba, H. Specific leaf area of European larch (Larix decidua Mill.). Trees-Structure and Function. 30 (4), 1237-1244 (2016).
- Niinemets, &. #. 2. 2. 0. ;. Acclimation to low irradiance in Picea abies: influence of past and present light climate on foliage structure and function. Tree Physiology. 17 (11), 723-732 (1997).
- Čermák, J. Leaf distribution in large trees and stands of the floodplain forest in southern Moravia. Tree Physiology. 18 (11), 727-737 (1998).
- Chianucci, F., Cutini, A. Estimation of canopy properties in deciduous forests with digital hemispherical and cover photography. Agricultural and Forest Meteorology. 168, 130-139 (2013).
- Essaghi, S., Hachmi, M., Yessef, M., Dehhaoui, M. Leaf shrinkage: a predictive indicator of the potential variation of the surface area-to-volume ratio according to the leaf moisture content. SpringerPlus. 5, 1229 (2016).
- Chianucci, F., MacFarlane, C., Pisek, J., Cutini, A., Casa, R. Estimation of foliage clumping from the LAI-2000 Plant Canopy Analyser: effect of view caps. Trees-Structure and Function. 29, 355-366 (2015).
- Bequet, R. Environmental determinants of the temporal and spatial variability in leaf area index of Fagus sylvatica L., Quercus robur L., and Pinus sylvestris L. Thesis. , (2011).
- Goodall, D. W. Some considerations in the use of point quadrats for the analysis of vegetation. Australian Journal of Biological Sciences. 5 (1), 1-41 (1952).
- Warren Wilson, J. Analysis of the spatial distribution of foliage by two-dimensional point quadrats. New Phytologist. 58 (1), 92-99 (1959).
- Warren Wilson, J. Inclined point quadrats. New Phytologist. 59 (1), 1-7 (1960).
- Warren Wilson, J. Estimation of foliage denseness and foliage angle by inclined point quadrants. Australian Journal of Botany. 11 (1), 95-105 (1963).
- Nizinski, J. J., Saugier, B. A model of leaf budding and development for a mature Quercus forest. Journal of Applied Ecology. 25 (2), 643-655 (1988).
- LI-COR. . Instruction manual. LAI-2200 Plant Canopy Analyzer. , (2011).
- Yan, G., et al. Review of indirect optical measurements of leaf area index: Recent advances, challenges, and perspectives. Agricultural and Forest Meteorology. 265, 390-411 (2018).
- Hicks, S. K., Lascano, R. J. Estimation of leaf area index for cotton canopies using the Li-Cor LAI 2000 plant canopy analyser. Agronomy Journal. 87, 458-464 (1995).
- He, Y., Guo, X., Wilmshurst, J. F. Comparison of different methods for measuring leaf area index in a mixed grassland. Canadian Journal of Plant Science. 87 (4), 803-813 (2007).
- Černý, J., Haninec, P., Pokorný, R. Leaf area index estimated by direct, semi-direct, and indirect methods in European beech and sycamore maple stands. Journal of Forestry Research. online version, 1-10 (2018).
- Gower, S. T., Norman, J. M. Rapid estimation of leaf area index in conifer and broad-leaf plantations. Ecology. 72 (5), 1896-1900 (1991).
- Planchais, I., Pontailler, J. Y. Validity of leaf areas and angles estimated in a beech forest from analysis of gap frequencies, using hemispherical photographs and a plant canopy analyser. Annals of Forest Science. 56 (1), 1-10 (1999).
- Danner, M., Locherer, M., Hank, T., Richter, K. Measuring leaf area index (LAI) with the Li-Cor LAI 2200C or LAI-2200 (+2200 Clear Kit) – Theory, measurement, problems, interpretation. EnMAP Field Guide Technical Report, GFZ Data Services. , (2015).
- Chen, J. M., Black, T. A., Adams, R. S. Evaluation of hemispherical photography for determining plant area index and geometry of a forest stand. Agricultural and Forest Meteorology. 56 (1-2), 129-143 (1991).
- Stenberg, P. Correcting LAI-2000 estimates for the clumping of needles in shoots of conifer. Agricultural and Forest Meteorology. 79 (1-2), 1-8 (1996).
- Chen, J. M., Cihlar, J. Quantifying the effect of canopy architecture on optical measurements of leaf area index using two gap size analysis methods. IEEE Transactions on Geosciences and Remote Sensing. 33 (3), 777-787 (1995).
- Chen, J. M. Optically-based methods for measuring seasonal variation of leaf area index in boreal conifer stands. Agricultural and Forest Meteorology. 80 (2-4), 135-163 (1996).
- Lang, A. R. G. Application of some Cauchy’s theorems to estimation of surface area of leaves, needles and branches of plants and light transmittance. Agricultural and Forest Meteorology. 55 (3-4), 191-212 (1991).
- Kobayashi, H., Ryu, Y., Baldocchi, D. D., Welles, J. M., Norman, J. M. On the correct estimation of gap fraction: How to remove scattered radiation in gap fraction measurements?. Agricultural and Forest Meteorology. 170-183, 170-183 (2013).
- Sprintsin, M., Cohen, S., Maseyk, K., Rotenberg, E., Grünzweig, J., Karnieli, A., Berliner, P., Yakir, D. Long term and seasonal courses of leaf area index in semi-arid forest plantation. Agricultural and Forest Meteorology. 151 (5), 565-574 (2011).
- Cutini, A., Matteucci, G., Mugnozza, G. S. Estimation of leaf area index with the Li-Cor LAI 2000 in deciduous forests. Forest Ecology and Management. 105 (1-3), 55-65 (1998).
- Woodgate, W., Soto-Berelov, M., Suarez, L., Jones, S., Hill, M., Wilkes, P., Axelsson, C., Haywood, A., Mellor, A. Searching for the optimal sampling design for measuring LAI in an upland rainforest. , (2012).
- Baret, F., et al. VALERI: a network of sites and a methodology for the validation of medium spatial resolution land satellite products. Remote Sensing of Environment. 76 (3), 1-20 (2008).
- Majasalmi, T., Rautiainen, M., Stenberg, P., Rita, H. Optimizing the sampling scheme for LAI-2000 measurements in a boreal forest. Agricultural and Forest Meteorology. 154-155, 38-43 (2012).
- Calders, K., et al. Variability and bias in active and passive ground-based measurements of effective plant, wood and leaf area index. Agricultural and Forest Meteorology. 252, 231-240 (2018).
- Leblanc, S. G., Chen, J. M. A practical method for correcting multiple scattering effects on optical measurements of leaf area index. Agricultural and Forest Meteorology. 110, 125-139 (2001).
- Rich, P. M. Characterizing plant canopies with hemispherical photographs. Remote Sensing Reviews. 5 (1), 13-29 (1990).
- Čater, M., Schmid, I., Kazda, M. Instantaneous and potential radiation effect on underplanted European beech below Norway spruce canopy. European Journal of Forest Research. 132 (1), 23-32 (2013).
- Le Dantec, V., Dufrêne, E., Saugier, B. Interannual and spatial variation in maximum leaf area index of temperate deciduous stands. Forest Ecology and Management. 134 (1-3), 71-81 (2000).
- Mussche, S., Samson, R., Nachtergale, L., De Schrijver, A., Lemeur, R., Lust, N. A comparison of optical and direct methods for monitoring the seasonal dynamics of leaf area index in deciduous forests. Silva Fennica. 35 (4), 373-384 (2001).
- Bequet, R., Campioli, M., Kint, V., Vansteenkiste, D., Muys, B., Ceulemans, R. Leaf area index development in temperate oak and beech forests is driven by stand characteristics and weather conditions. Trees-Structure and Function. 25 (5), 935-946 (2011).
- Neumann, H. H., Den Hartog, G. D., Shaw, R. H. Leaf-area measurements based on hemispheric photographs and leaf-litter collection in a deciduous forest during autumn leaf-fall. Agricultural and Forest Meteorology. 45 (3-4), 325-345 (1989).
- Küßner, R., Mosandl, R. Comparison of direct and indirect estimation of leaf area index in mature Norway spruce stands of eastern Germany. Canadian Journal of Forest Research. 30 (3), 440-447 (2000).
- Pokorný, R., Marek, M. V. Test of accuracy of LAI estimation by LAI-2000 under artificially changed leaf to wood area proportions. Biologia Plantarum. 43 (4), 537-544 (2000).
- Pokorný, R. . Estimation of leaf area index in pure forest stands. Certificated methodology. , (2015).
- Lang, A. R. G., Yueqin, X., Norman, J. M. Crop structure and the penetration of direct sunlight. Agricultural and Forest Meteorology. 35 (1-4), 83-101 (1985).
- Niinemets, &. #. 2. 2. 0. ;., Kull, K. Leaf weight per area and leaf size of 85 Estonian woody species in relation to shade tolerance and light availability. Forest Ecology and Management. 70 (1-3), 1-10 (1994).
- Bouriaud, O., Soudani, K., Bréda, N. J. J. Leaf area index from litter collection: impact of specific leaf area variability within a beech stand. Canadian Journal of Remote Sensing. 29 (3), 371-380 (2003).
- Burton, A. J., Pregitzer, K. S., Reed, D. D. Leaf area and foliar biomass relationships in northern hardwood forests located along an 800 km acid deposition gradient. Forest Science. 37 (4), 1041-1059 (1991).
- Finotti, R., Rodrigues, F. S., Cerqueira, R., Vinícius, V. M. A method to determine the minimum number of litter traps in litterfall studies. Biotropica. 35 (3), 419-421 (2003).
- Yang, Y., Yanai, R. D., See, C. R., Arthur, M. A. Sampling effort and uncertainty in leaf litterfall mass and nutrient flux in northern hardwood forests. Ecosphere. 8 (11), e01999 (2017).
- Law, B. E., Cescatti, A., Baldocchi, D. D. Leaf area distribution and radiative transfer in open-canopy forests: implications for mass and energy exchange. Tree Physiology. 21 (12-13), 777-787 (2001).
- Guiterman, C. H., Seymour, R. S., Weiskittel, A. R. Long-term thinning effects on the leaf area of Pinus strobus L. as estimated from litterfall and individual-tree allometric models. Forest Science. 58 (1), 85-93 (2013).
- Liu, Z., Chen, J. M., Jin, G., Qi, Y. Estimating seasonal variations of leaf area index using litterfall collection and optical methods in four mixed evergreen-coniferous forests. Agriculture and Forest Meteorology. 209, 36-48 (2015).
- LI-COR. . Instruction Manual. LAI-2000 Plant Canopy Analyzer. , (1991).
- Mason, E. G., Diepstraten, M., Pinjuv, G. L., Lasserre, J. P. Comparison of direct and indirect leaf area index measurements of Pinus radiata D. Don. Agricultural and Forest Meteorology. 166-167, 113-119 (2012).
- Deblonde, G., Penner, M., Royer, A. Measuring leaf-area index with the Li-Cor Lai-2000 in pine stands. Ecology. 75 (5), 1507-1511 (1994).
- Zou, J., Yan, G., Zhu, L., Zhang, W. Woody-to-total area ratio determination with a multispectral canopy imager. Tree Physiology. 29 (8), 1069-1080 (2009).
- Zhu, X., et al. Improving leaf area index (LAI) estimation by correcting for clumping and woody effects using terrestrial laser scanning. Agricultural and Forest Meteorology. 263, 276-286 (2018).
- Li, Z., Strahler, A., Schaaf, C., Jupp, D., Schaefer, M., Olofsson, P. Seasonal change of leaf and woody area profiles in a midaltitude deciduous forest canopy from classified dual-wavelenght terrestrial lidar point clouds. Agricultural and Forest Meteorology. 262, 279-297 (2018).
- Chen, J. M., Black, T. A. Foliage area and architecture of plant canopies from sunfleck size distributions. Agricultural and Forest Meteorology. 60 (3-4), 249-266 (1992).
- Leblanc, S. G., Chen, J. M., Fernandes, R., Deering, D. V., Conley, A. Methodology comparison for canopy structure parameters extraction from digital hemispherical photography in boreal forests. Agricultural and Forest Meteorology. 129 (3-4), 187-207 (2005).
- Lang, A. R. G., Yueqin, X. Estimation of leaf area index from transmission of direct sunlight in discontinuous canopies. Agricultural and Forest Meteorology. 37 (3), 229-243 (1986).
- Leblanc, S. G. Correction to the plant canopy gap-size analysis theory used by the Tracing Radiation and Architecture of Canopies instrument. Applied Optics. 41 (36), 7667-7670 (2002).
- Leblanc, S. G., Chen, J. M., Kwong, M. . Tracing Radiation and Architecture of Canopies MANUAL 2.1.4. , (2005).
- Hu, R., Yan, G., Mu, X., Luo, J. Indirect measurement of leaf area index on the basis of path length distribution. Remote Sensing of Environment. 155, 239-247 (2014).
Reprints and Permissions
Request permission to reuse the text or figures of this JoVE article
Request PermissionThis article has been published
Video Coming Soon
Copyright © 2025 MyJoVE Corporation. All rights reserved
We use cookies to enhance your experience on our website.
By continuing to use our website or clicking “Continue”, you are agreeing to accept our cookies.