A subscription to JoVE is required to view this content. Sign in or start your free trial.
Methods Article
Mass Spectrometry-Guided Genome Mining as a Tool to Uncover Novel Natural Products
In This Article
Summary
A mass spectrometry-guided genome mining protocol is established and described here. It is based on genome sequence information and LC-MS/MS analysis and aims to facilitate identification of molecules from complex microbial and plant extracts.
Abstract
The chemical space covered by natural products is immense and widely unrecognized. Therefore, convenient methodologies to perform wide-ranging evaluation of their functions in nature and potential human benefits (e.g., for drug discovery applications) are desired. This protocol describes the combination of genome mining (GM) and molecular networking (MN), two contemporary approaches that match gene cluster-encoded annotations in whole genome sequencing with chemical structure signatures from crude metabolic extracts. This is the first step towards the discovery of new natural entities. These concepts, when applied together, are defined here as MS-guided genome mining. In this method, the main components are previously designated (using MN), and structurally related new candidates are associated with genome sequence annotations (using GM). Combining GM and MN is a profitable strategy to target new molecule backbones or harvest metabolic profiles in order to identify analogues from already known compounds.
Introduction
Investigations of secondary metabolism often consist of screening crude extracts for specific biological activities followed by purification, identification, and characterization of the constituents belonging to active fractions. This process has proved to be efficient, promoting the isolation of several chemical entities. However, nowadays this is seen as unfeasible, mainly due to the high rates of rediscovery. As the pharmaceutical industry revolutionized without knowledge of the roles and functions of specialized metabolites, their identification was carried out under laboratory conditions that did not accurately represent nature1. Today, there is a better understanding of natural signaling influences, secretion, and the presence of most targets at undetectably low concentrations. Additionally, regulation of the process will help the academic community and pharmaceutical industry to take advantage of this knowledge. It will also benefit research involving the direct isolation of metabolites related to silent biosynthetic gene clusters (BGCs)2.
In this context, advances in genomic sequencing have renewed interest in screening microorganism metabolites. This is because analyzing the genomic information of uncovered biosynthetic clusters can reveal genes encoding novel compounds not observed or produced under laboratory conditions. Many microbial whole genome projects or drafts are available today, and the number is growing every year, providing massive prospects for uncovering novel bioactive molecules through genome mining3,4.
The Atlas of Biosynthetic Gene Clusters is the current largest collection of automatically mined gene clusters as a component of the Integrated Microbial Genomes Platform of the Joint Genome Institute (JGI IMG-ABC)2. Most recently, the Minimum Information for Biosynthetic Gene Clusters (MIBiG) Standardization Initiative has promoted the manual reannotation of BGCs, providing a highly curated reference dataset5. Nowadays, plenty of tools are available to enable computational mining of genetic data and their connection to known secondary metabolites. Different strategies have also been developed to access new bioactive natural products (i.e., heterologous expression, target gene deletion, in vitro reconstitution, genomic sequence, isotope-guided screening [genomisotopic approach], manipulation of local and global regulators, resistance target-based mining, culture independent mining, and, more recently, MS-guided/code approaches2,6,7,8,9,10,11,12,13,14,15).
Genome mining as a singular strategy requires efforts to annotate a single or small group of molecules; thus, gaps in the process remain in which new compounds are prioritized for isolation and structure elucidation. In principle, these approaches target only one biosynthetic pathway per experiment, thereby resulting in a slow discovery rate. In this sense, using GM along with a molecular networking approach represents an important advance for natural product research14,15.
The versatility, accuracy, and high sensitivity of liquid chromatography-mass spectrometry (LC-MS) make it a good method for compound identification. Currently, several platforms have invested algorithms and software suites for untargeted metabolomics16,17,18,19,20. The core of these programs includes feature detection (peak picking)21 and peak alignment, which allows match of identical features across a batch of samples and searching for patterns. MS pattern-based algorithms22,23 compare characteristic fragmentation patterns and match MS2 similarities generating molecular families sharing structural features. These features can then be highlighted and clustered, conferring the ability to rapidly discover known and unknown molecules from a complex biological extract by tandem MS2,24,25. Therefore, tandem MS is a versatile method to gain structural information of several chemotypes contained in a large amount of data simultaneously.
The Global Natural Products Social Molecular Networking (GNPS)26 algorithm uses the normalized fragment ions intensity to construct multidimensional vectors, in which similarities are compared using a cosine function. The relationship between different parent ions are plotted in a diagram representation, in which each fragmentation is visualized as a node (circles), and the relatedness of each node is defined by an edge (lines). The global visualization of molecules from a single source is defined as a molecular network. Structurally divergent molecules that fragment uniquely will form their own specific cluster or constellation, whereas related molecules cluster together. Clustering chemotypes allows the hypothetical connection of similar structural features to their biosynthetic origins.
Combining both chemotype-to-genotype and genotype-to-chemotype approaches is powerful when creating bioinformatics links between BGCs and their small molecule products27. Therefore, MS-guided genome mining is a rapid method and low material-consuming strategy, and it helps bridge parent ions and biosynthetic pathways revealed by WGS of one or more strains under diverse metabolic and environmental conditions.
The workflow of this protocol (Figure 1) consists of feeding WGS data into a biosynthetic gene cluster annotation platform such as antiSMASH28,29,30. It helps estimate the variety of compounds and class of compounds encoded by the genome. A strategy to target a biosynthetic gene cluster encoding a chemical entity of interest must be adopted, and culture extracts from a wild type strain and/or heterologous strain containing the BGC can be analyzed to generate clustered ions based on similarities using GNPS26,31. Consequently, it is possible to identify new molecules that associate with the targeted BGC and are unavailable in the database (mainly unknown analogues, sometimes produced in low titers). It is relevant to consider that users can contribute to these platforms and that the availability of bioinformatics and MS/MS data is increasing rapidly, driving to a constant development and upgrade of effective computational tools and algorithms to guide efficient connections of complex extracts with molecules.
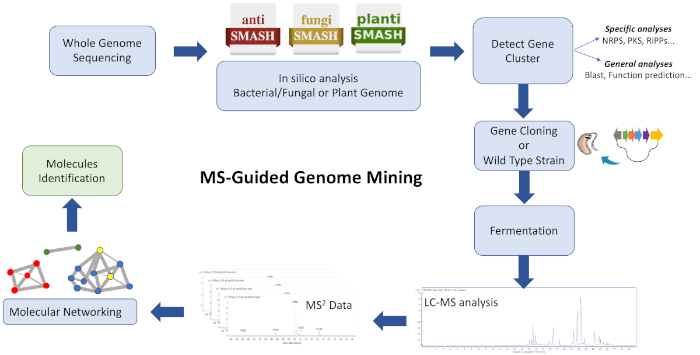
Figure 1: Overview of the entire workflow. Shown is an illustration of the bioinformatic, cloning, and molecular networking steps involved in the described MS-guided genome mining approach to identify new metabolites. Please click here to view a larger version of this figure.
This protocol describes a rapid and efficient workflow to combine genome mining and molecular networking as starting point for the natural product discovery pipeline. Although many applications are able to visualize the composition and relatedness of MS-detectable molecules in one network, several are adopted here to visualize structurally similar clustered molecules. Using this strategy, novel cyclodepsipeptide products observed in metabolic extracts of Streptomyces sp. CBMAI 2042 are successfully identified. Guided by genome mining, the whole biosynthetic gene cluster encoding for valinomycins is recognized and cloned into the producer strain Streptomyces coelicolor M1146. Finally, following a MS pattern-based molecular networking, the molecules detected by MS are correlated with BGCs responsible for their biogenesis32.
Protocol
1. Genome mining for biosynthetic gene clusters
- Perform whole genome sequencing (WGS) as the first step to electing a biosynthetic gene cluster (BCG) for MS-guided genome mining. The whole genome draft of the strain of interest (bacteria) can be obtained by Illumina MiSeq technology using the following with high quality genomic DNA: shotgun TruSeq PCR-Free library prep and Nextera Mate Pair Library Preparation Kit33.
NOTE: After sequencing, the Illumina shotgun library and Illumina mate pair library can be assembled using the Newbler v3.0 (Roche, 454) assembler program (found at <https://ngs.csr.uky.edu/Newbler>) and annotated using a pipeline based on FgeneSB (found at <http://www.softberry.com/berry.phtml?topic=fgenesb_annotator&group=help&subgroup=pipelines>), as described previously33. Microbiology Resource Announcements (MRA) is a fully open access journal with articles publishing the availability of any microbiological resource deposited in an available repository (found at <https://mra.asm.org>). The candidate protein-coding genes are identified using the RAST server annotation34, and the Whole Genome Shotgun (WGS) project is deposited in the DDBJ/ENA/GenBank (found at <https://www.ncbi.nlm.nih.gov/genbank/>) and Gold (found at <https://gold.jgi.doe.gov>) sequence databases. - To obtain in silico information about secondary metabolism gene clusters annotations from a complete sequenced genome, submit the sequence file (GenBank/EMBL or FASTA format) to an antiSMASH platform (found at <https://antismash.secondarymetabolites.org/>).
- Select the gene cluster of interest from output data (Figure 2) based on the most similar known cluster.
NOTE: First, it is routine to explore gene-by-gene and conduct individual searches (blastp) to evaluate which functions are associated with the desired biosynthetic gene groups. This procedure can also help to determine which BGC is likely associated with the production of a desired compound, even if it is a low percentage. An antiSMASH prediction considers all genes within a cluster to make percentage coverage, which can represent a global low percentage of similarity for the aimed BGC. However, when analyzing gene-by-gene, it is possible to obtain more accurate information using the most similar known cluster. Second, antiSMASH has two options to refine a search: 1) detection strictness: the degree of strictness to which the biosynthetic gene cluster must be to be considered a hit. For this option, the user should use the following parameters: a) strict: detects exclusively well-defined clusters containing all required regions, insusceptible to errors about genetic information; b) relaxed: detects partial clusters missing one or more functional region, which also works for detecting the strict feature; or c) loose: detects poorly defined clusters and clusters that likely match primary metabolites, which can lead to appearance of false positives or poorly defined BGCs. The other option is 2) extra features: the type of information the platform must search for and show in the output. In general, these two options can save time after the prediction. However, the antiSMASH job requires a longer time period.
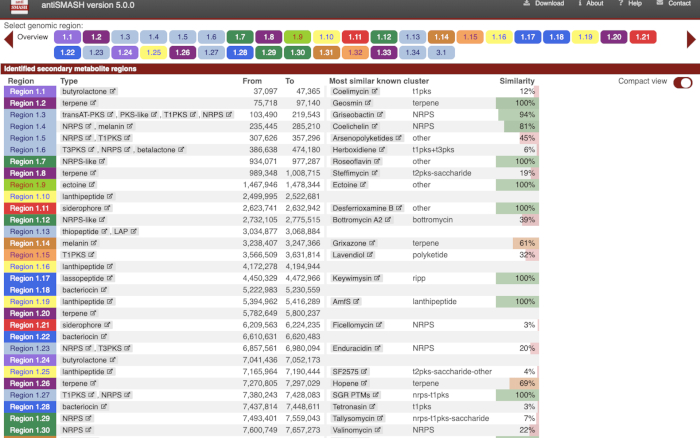
Figure 2: Output from antiSMASH platform. Secondary metabolism in silico analysis from whole genome sequence annotation. Please click here to view a larger version of this figure.
- Based on DNA sequence information of the BGC, design primers (20–25 nt) flanking the gene cluster for ESAC (E. coli/Streptomyces Artificial Chromosome) library screening.
NOTE: Different methods35,36 can be used to capture the whole biosynthetic gene cluster from DNA. Here, the method used is construction of a representative ESAC library37,38 from Streptomyces sp. CBMAI 2042 containing clones with average size fragments of ~95 kb.
2. Heterologous expression of whole biosynthetic gene cluster from the ESAC library
- Move the ESAC vector from E. coli DH10B to E. coli ET12567 by triparental conjugation32.
- Inoculate E. coli ET12567 (CamR), TOPO10/pR9604 (CarbR), DH10B/ESAC4H (AprR) in 5 mL of Luria-Bertani (LB) medium containing chloramphenicol (25 µg/mL), carbenicillin (100 µg/mL), and apramycin (50 µg/mL).
- Incubate the culture overnight at 37 °C and 250 rpm.
- Inoculate 500 µL of the overnight culture in 10 mL of LB medium containing a half-concentration of antibiotics.
- Incubate the culture at 37 °C and 250 rpm until reaching an A600 of 0.4–0.6.
- Harvest the cells by centrifugation at 2,200 x g for 5 min.
- Wash the cells twice with 20 mL of LB medium.
- Resuspend the cells in 500 µL of LB medium.
- Mix 20 μL of each strain in a microcentrifuge tube and drip into an agar plate with LB medium lacking antibiotics.
- Incubate the plates at 37 °C overnight.
- Streak the grown cells onto a fresh LB agar plate containing antibiotics and incubate at 37 °C overnight.
3. Streptomyces/E. coli conjugation
- To obtain the recombinant heterologous organism, perform conjugation32 between E. coli ET12567 containing the ESAC vector, helper plasmid pR9604, and Streptomyces coelicolor M1146 or another selected host strain39.
- Day 1: Inoculate isolated colonies of S. coelicolor M1146 in 25 mL of TSBY medium in a 250 mL Erlenmeyer flask fitted with an inox-spring at 30 °C and 200 rpm for 48 h.
- Day 2/3: Inoculate ET12567/ESAC/pR9604 in 5 mL of LB medium containing chloramphenicol (25 µg/mL), carbenicillin (100 µg/mL), and apramycin (50 µg/mL) overnight at 37 °C and 250 rpm.
- Day 3/4: Inoculate 500 µL of the overnight culture in 10 mL of 2TY (in a 50 mL conical tube) containing half-working concentrations of antibiotics. Incubate at 37 °C and 250 rpm until reaching an A600 of 0.4–0.6.
- Centrifuge the cultures (ET12567/ESAC/pR9604 and M1146) at 2200 x g for 10 min.
- Wash the pellets 2x in 20 mL of 2TY medium and resuspend in 500 µL of 2TY.
- Aliquot 200 µL of the S. coelicolor M1146 suspension and dilute in 500 µL of 2TY (suspension A).
- Aliquot 200 µL of suspension A and dilute in 500 µL of 2TY (suspension B).
- Aliquot 200 µL of suspension B and dilute in 500 µL of 2TY (suspension C).
- Aliquot 200 µL of the ET12567/ESAC/pR9604 suspension and mix with 200 µL of suspension C.
- Plate 150 µL of the conjugation mixture on an SFM agar plate lacking antibiotics.
- Incubate at 30 °C for 16 h.
- Cover plates with 1 mL of antibiotic solution (according to plasmid resistance). After drying, incubate at 30 °C for 4–7 days.
NOTE: Here, a solution containing 1.0 mg/mL thiostrepton and 0.5 mg/mL nalidixic acid was prepared. - Streak putative exconjugants onto SFM agar plates containing thiostrepton (50 mg/mL) and nalidixic acid (25 mg/mL). Incubate at 30 °C.
- Streak exconjugants onto an SFM agar containing only nalidixic acid.
- Perform PCR analysis with isolated colonies to confirm that the entire gene cluster has been transferred to the S. coelicolor M1146 host.
4. Strain cultivation
- To obtain the metabolic profile, inoculate 1/100 of the strain's pre-culture in appropriate fermentation media and under the appropriate culture conditions.
- Centrifuge cultures at 2200 x g for 10 min.
- Perform the extraction according to the class of the compound of interest40.
5. Acquiring mass spectra and preparation for GNPS analysis
- To acquire MS/MS data, program suitable HPLC and mass spectrometry methods using the control software. Both high and low resolution data-dependent mass spectrometry analysis (DDA) can be analyzed.
NOTE: Generally, a 1 mg/mL solution of complex crude extract samples is ideal. Dilutions are needed for less complex extracts. It should be noted that MS/MS networking is the detectable molecular network under the given mass spectrometric conditions. - Convert mass spectra to .mzXML format using MSConvert from Proteowizard (found at <http://proteowizard.sourceforge.net/>). The input parameters for the conversion are illustrated in Figure 3. Data from software of almost all companies are compatible.
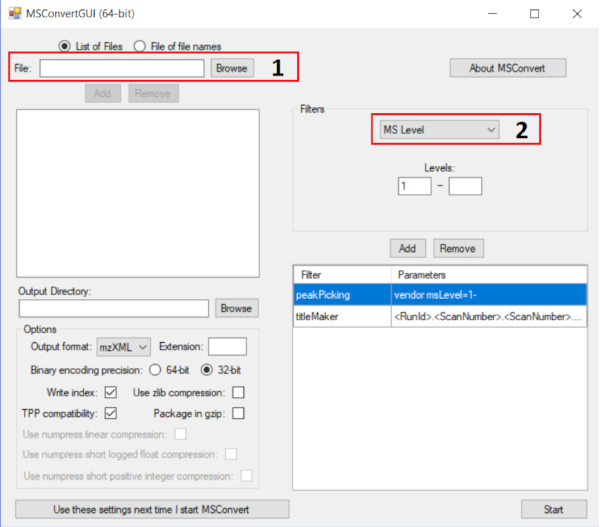
Figure 3: Using MsConvert to convert MS files to mzXML extension. The correct parameter for GNPS analysis is displayed. The instructions are as follows: add all MS files in box 1 and add the filter Peak Picking in box 2; for this filter, use the algorithm vendor; press start and the processes of conversion will follow. Please click here to view a larger version of this figure.
- Upload the converted LC-MS/MS files into the GNPS database. Two options are available: using a file transfer protocol (FTP) or directly in a browser through the online platform.
NOTE: Detailed information on how to install and transfer data to GNPS is available at <https://ccms-ucsd.github.io/GNPSDocumentation/fileupload/>.
6. GNPS analysis
- After creating an account in GNPS (found at <https://gnps.ucsd.edu/>), log in to the created account select Create Molecular Network. Add a job title.
- Basic options: select the mzXML files to perform the molecular network. They can be organized into up to six groups. Select the libraries for the dereplication routine (Figure 4).
NOTE: These groups do not interfere with molecular network construction. This information will be used only for the graphical representation.

Figure 4: Using online GNPS platform to perform molecular network analysis. Selection of mzXML files is done by clicking in box 1. In the open dialog box, the files can be selected from personal folder (box 2) or be uploaded in the second tab using the drag-and-drop file uploader (less than 20 MB). The files can be grouped into up to six groups. Please click here to view a larger version of this figure.
- Select the precursor ion mass tolerance and fragment ion mass tolerance of 0.02 Da and 0.05 Da, respectively.
NOTE: GNPS has different types of strictness available based on 1) how accurate the MS/MS data is and 2) how accurate the association must be. Basic options: in this folder, it is possible to set Precursor Ion Mass Tolerance and Fragment Ion Mass Tolerance. These parameters are used as a guide to determine how precise the precursor ion and fragment ion must be. The selected mass tolerances depend on the resolution and accuracy of the mass spectrometer that is used. - Advanced network options: select the parameters according to Figure 5. These parameters directly influence the network cluster size and form. Another parameter in the remaining tabs section are for advanced users; thus, leave the default values.
NOTE: Advanced parameters can be read in GNPS documentation (found at <https://ccms-ucsd.github.io/GNPSDocumentation/>).
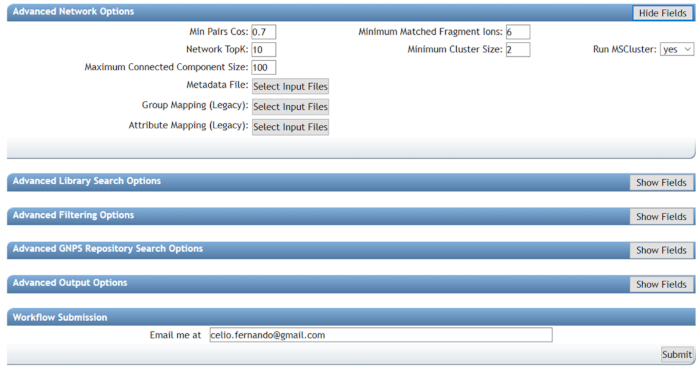
Figure 5: Using GNPS to perform molecular network analysis (advanced options). Min Pair Cos will directly influence the size of clusters, as high values will result in combining closely-related compounds and low values in combining distantly-related compounds. Using values that are too low should be avoided. Minimum matched fragment ions represent the number of shared fragments between two fragmentation spectra to be linked in the network. Together, both parameters guide the network format; lower values will cluster more distantly-related compounds and vice-versa. Using the proper values will greatly help the compound elucidation. Please click here to view a larger version of this figure.
- Choose an e-mail address to receive an alert when the work is done, and submit the job.
7. Analysis of GNPS results
- Log in to GNPS. Select Jobs > Published job > Done to open the job. A webpage will open as illustrated in Figure 6. All results obtained from molecular networking will be displayed.
- Select View Spectral Families (In Browser Network Visualizer) to see all network clusters (red box, Figure 6).
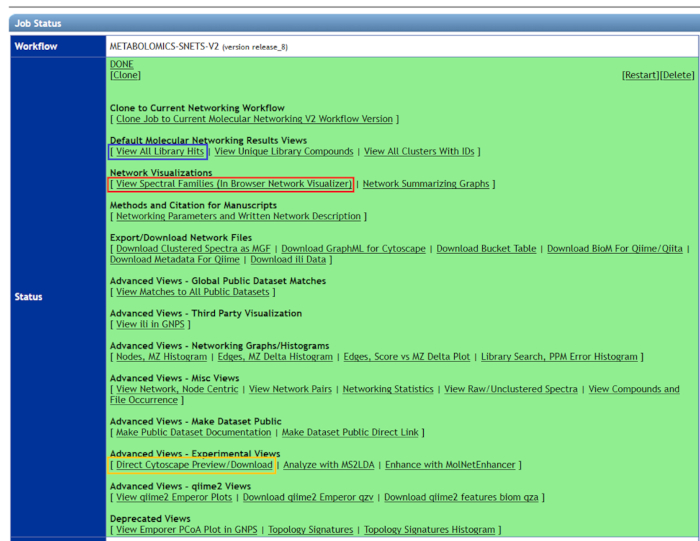
Figure 6: Using GNPS to visualize molecular network results. All related compound clusters can be seen in view spectral families (red box). To visualize only library hits, "view all library hits" (blue box) should be selected. For better graphical representation of molecular network results, "Direct Cytoscape Preview" (yellow box) should be downloaded, and the latest version of Cytoscape should be used. Please click here to view a larger version of this figure.
- A list will be displayed with all generated molecular networking clusters. If a library search was selected to generate the findings, tentative molecules identification will be displayed in AllIDs. Select Show to visualize them.
NOTE: The data analyses can be driven for other results (i.e., genome mining, biological assays, library dereplication molecules, etc.). - To analyze the molecular network cluster, select Visualize Network.
NOTE: Each cluster is composed of nodes (circles) and edges, which represents molecules and molecular similarity, respectively. Dereplicated molecules will be highlighted as a blue node in the online browser network visualizer. - In the node labels box, select parent mass (red box, Figure 7).
- In the edge labels box, select Cosine or DeltaMZ to observe node similarity or mass difference between nodes, respectively (yellow box, Figure 7).
- In the case of multigroup analyses, click Draw pies in the node coloring box to observe the frequency at which each node appears in each group (blue box, Figure 7).
NOTE: Other choices are possible, but those suggested above are optimal for annotating cluster nodes and unraveling their structures.
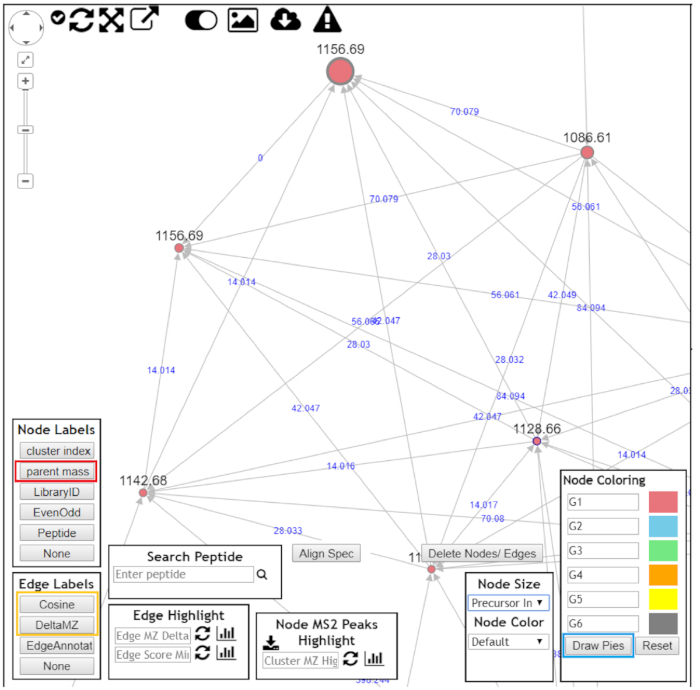
Figure 7: Using GNPS to visualize molecular cluster results. After opening the molecular clusters for better data visualization, the following should be chosen: "Parent mass" as node labels (red box); "DeltaMZ" as edge labels (yellow box); and "Draw pies" as node coloring (blue box). Navigate through the molecular cluster and try to annotate all nodes. Please click here to view a larger version of this figure.
- To see all library hits, select View all library hits (blue box, Figure 7).
NOTE: Also, the MNW can be downloaded in "Direct Cytoscape Preview/Download" (yellow box, Figure 7), and the file can be opened in the Cytoscape platform (found at <https://cytoscape.org/>) for more options in graphical structure. - Manual confirmation of dereplicated compounds and structure elucidation of related compounds are needed. Open the fragmentations spectra directly in the GNPS platform or in original raw files.
Results
The protocol was successfully exemplified using a combination of genome mining, heterologous expression, and MS-guided/code approaches to access new specialized valinomycin analogues molecules. The genome-to-molecule workflow for the target, valinomycin (VLM), is represented in Figure 8. Streptomyces sp. CBMAI 2042 draft genome was analyzed in silico, and the VLM gene cluster was then identified and transferred to a heterologous host. Heterologous and wild type strains were cultivat...
Discussion
The strongest advantage of this protocol is its ability to rapidly dereplicate metabolic profiles and bridge genomic information with MS data in order to elucidate the structures of new molecules, especially structural analogues2. Based on genomic information, different natural products chemotypes can be investigated, such as polyketides (PK), nonribosomal peptides (NRP), and glycosylated natural products (GNP), as well as cryptic BGCs. Metabolomic screening yields evidence of activated BGC profil...
Disclosures
The authors have nothing to disclose.
Acknowledgements
The financial support for this study was provided by São Paulo Research Foundation - FAPESP (2019/10564-5, 2014/12727-5 and 2014/50249-8 to L.G.O; 2013/12598-8 and 2015/01013-4 to R.S.; and 2019/08853-9 to C.F.F.A). B.S.P, C.F.F.A., and L.G.O. received fellowships from the National Council for Scientific and Technological Development - CNPq (205729/2018-5, 162191/2015-4, and 313492/2017-4). L.G.O. is also grateful for the grant support provided by the program For Women in Science (2008, Brazilian Edition). All authors acknowledge CAPES (Coordination for the Improvement of Higher Education Personnel) for supporting the post-graduation programs in Brazil.
Materials
| Name | Company | Catalog Number | Comments |
| Acetonitrile | Tedia | AA1120-048 | HPLC grade |
| Agar | Oxoid | LP0011 | NA |
| Apramycin | Sigma Aldrich | A2024 | NA |
| Carbenicillin | Sigma Aldrich | C9231 | NA |
| Centrifuge | Eppendorf | NA | 5804 |
| Chloramphenicol | Sigma Aldrich | C3175 | NA |
| Column C18 | Agilent Technologies | NA | ZORBAX RRHD Extend-C18, 80Å, 2.1 x 50 mm, 1.8 µm, 1200 bar pressure limit P/N 757700-902 |
| Kanamycin | Sigma Aldrich | K1377 | NA |
| Manitol P.A.- A.C.S. | Synth | NA | NA |
| Microcentrifuge | Eppendorf | NA | 5418 |
| Nalidixic acid | Sigma Aldrich | N4382 | NA |
| Phusion Flash High-Fidelity PCR Master Mix | ThermoFisher Scientific | F548S | NA |
| Q-TOF mass spectrometer | Agilent technologies | NA | 6550 iFunnel Q-TOF LC/MS |
| Sacarose P.A.- A.C.S. | Synth | NA | NA |
| Shaker/Incubator | Marconi | MA420 | NA |
| Sodium Chloride | Synth | NA | P. A. - ACS |
| Soy extract | NA | NA | NA |
| Sucrose | Synth | NA | P. A. - ACS |
| Thermal Cycles | Eppendorf | NA | Mastercycler Nexus Gradient |
| Thiostrepton | Sigma Aldrich | T8902 | NA |
| Tryptone | Oxoid | LP0042 | NA |
| Tryptone Soy Broth | Oxoid | CM0129 | NA |
| UPLC | Agilent Technologies | NA | 1290 Infinity LC System |
| Yeast extract | Oxoid | LP0021 | NA |
References
- Davies, J. Specialized microbial metabolites: functions and origins. The Journal of Antibiotics. 66 (7), 361-364 (2013).
- Ziemert, N., Alanjary, M., Weber, T. The evolution of genome mining in microbes - a review. Natural Product Reports. 33 (8), 988-1005 (2016).
- Zerikly, M., Challis, G. L. Strategies for the Discovery of New Natural Products by Genome Mining. ChemBioChem. 10 (4), 625-633 (2009).
- Gomez-Escribano, J. P., Bibb, M. J. Heterologous expression of natural product biosynthetic gene clusters in Streptomyces coelicolor: from genome mining to manipulation of biosynthetic pathways. Journal of Industrial Microbiology & Biotechnology. 41 (2), 425-431 (2014).
- Medema, M. H., et al. Minimum Information about a Biosynthetic Gene cluster. Nature Chemical Biology. 11 (9), 625-631 (2015).
- Lautru, S., Deeth, R. J., Bailey, L. M., Challis, G. L. Discovery of a new peptide natural product by Streptomyces coelicolor genome mining. Nature Chemical Biology. 1 (5), 265-269 (2005).
- Chiang, Y. -. M., et al. Molecular Genetic Mining of the Aspergillus Secondary Metabolome: Discovery of the Emericellamide Biosynthetic Pathway. Chemistry & Biology. 15 (6), 527-532 (2008).
- Huang, T., et al. Identification and Characterization of the Pyridomycin Biosynthetic Gene Cluster of Streptomyces pyridomyceticus NRRL B-2517. Journal of Biological Chemistry. 286 (23), 20648-20657 (2011).
- Udwary, D. W., et al. Genome sequencing reveals complex secondary metabolome in the marine actinomycete Salinispora tropica. Proceedings of the National Academy of Sciences. 104 (25), 10376-10381 (2007).
- Gross, H., et al. The Genomisotopic Approach: A Systematic Method to Isolate Products of Orphan Biosynthetic Gene Clusters. Chemistry & Biology. 14 (1), 53-63 (2007).
- Spohn, M., Wohlleben, W., Stegmann, E. Elucidation of the zinc-dependent regulation in Amycolatopsis japonicum enabled the identification of the ethylenediamine-disuccinate ([S,S ]-EDDS) genes. Environmental Microbiology. 18 (4), 1249-1263 (2016).
- Thaker, M. N., Waglechner, N., Wright, G. D. Antibiotic resistance-mediated isolation of scaffold-specific natural product producers. Nature Protocols. 9 (6), 1469-1479 (2014).
- Katz, M., Hover, B. M., Brady, S. F. Culture-independent discovery of natural products from soil metagenomes. Journal of Industrial Microbiology & Biotechnology. 43, 129-141 (2016).
- Quinn, R. A., et al. Molecular Networking as a Drug Discovery, Drug Metabolism, and Precision Medicine Strategy. Trends in Pharmacological Sciences. 38 (2), 143-154 (2017).
- Yang, J. Y., et al. Molecular Networking as a Dereplication Strategy. Journal of Natural Products. 76 (9), 1686-1699 (2013).
- Lommen, A. MetAlign: Interface-Driven, Versatile Metabolomics Tool for Hyphenated Full-Scan Mass Spectrometry Data Preprocessing. Analytical Chemistry. 81 (8), 3079-3086 (2009).
- Katajamaa, M., Miettinen, J., Oresic, M. MZmine: toolbox for processing and visualization of mass spectrometry based molecular profile data. Bioinformatics. 22 (5), 634-636 (2006).
- Pluskal, T., Castillo, S., Villar-Briones, A., Orešič, M. MZmine 2: Modular framework for processing, visualizing, and analyzing mass spectrometry-based molecular profile data. BMC Bioinformatics. 11 (1), 395 (2010).
- Tautenhahn, R., Patti, G. J., Rinehart, D., Siuzdak, G. XCMS Online: A Web-Based Platform to Process Untargeted Metabolomic Data. Analytical Chemistry. 84 (11), 5035-5039 (2012).
- Kuhl, C., Tautenhahn, R., Böttcher, C., Larson, T. R., Neumann, S. CAMERA: An Integrated Strategy for Compound Spectra Extraction and Annotation of Liquid Chromatography/Mass Spectrometry Data Sets. Analytical Chemistry. 84 (1), 283-289 (2012).
- Katajamaa, M., Orešič, M. Data processing for mass spectrometry-based metabolomics. Journal of Chromatography A. 1158, 318-328 (2007).
- Liu, W. -. T., et al. Interpretation of Tandem Mass Spectra Obtained from Cyclic Nonribosomal Peptides. Analytical Chemistry. 81 (11), 4200-4209 (2009).
- Ng, J., et al. Dereplication and de novo sequencing of nonribosomal peptides. Nature Methods. 6 (8), 596-599 (2009).
- Liaw, C., et al. Vitroprocines, new antibiotics against Acinetobacter baumannii, discovered from marine Vibrio sp. QWI-06 using mass-spectrometry-based metabolomics approach. Scientific Reports. 5 (1), 1-11 (2015).
- Kang, K. B., et al. Targeted Isolation of Neuroprotective Dicoumaroyl Neolignans and Lignans from Sageretia theezans Using in Silico Molecular Network Annotation Propagation-Based Dereplication. Journal of Natural Products. 81 (8), 1819-1828 (2018).
- Wang, M., et al. Sharing and community curation of mass spectrometry data with Global Natural Products Social Molecular Networking. Nature Biotechnology. 34 (8), 828-837 (2016).
- Doroghazi, J. R., et al. A roadmap for natural product discovery based on large-scale genomics and metabolomics. Nature Chemical Biology. 10 (11), 963-968 (2014).
- Medema, M. H., et al. antiSMASH: rapid identification, annotation and analysis of secondary metabolite biosynthesis gene clusters in bacterial and fungal genome sequences. Nucleic Acids Research. 39, 339-346 (2011).
- Weber, T., et al. antiSMASH 3.0-a comprehensive resource for the genome mining of biosynthetic gene clusters. Nucleic Acids Research. 43, 237-243 (2015).
- Blin, K., et al. antiSMASH 5.0: updates to the secondary metabolite genome mining pipeline. Nucleic Acids Research. 47, 81-87 (2019).
- Watrous, J., et al. Mass spectral molecular networking of living microbial colonies. Proceedings of the National Academy of Sciences. 109 (26), 1743-1752 (2012).
- Paulo, B. S., Sigrist, R., Angolini, C. F. F., De Oliveira, L. G. New Cyclodepsipeptide Derivatives Revealed by Genome Mining and Molecular Networking. ChemistrySelect. 4 (27), 7785-7790 (2019).
- Gonzaga de Oliveira, L., Sigrist, R., Sachetto Paulo, B., Samborskyy, M. Whole-Genome Sequence of the Endophytic Streptomyces sp. Strain CBMAI 2042, Isolated from Citrus sinensis. Microbiology Resource Announcements. 8 (2), 1-2 (2019).
- Aziz, R. K., et al. The RAST Server: Rapid Annotations using Subsystems Technology. BMC Genomics. 9 (1), 75 (2008).
- Nah, H. -. J., Pyeon, H. -. R., Kang, S. -. H., Choi, S. -. S., Kim, E. -. S. Cloning and Heterologous Expression of a Large-sized Natural Product Biosynthetic Gene Cluster in Streptomyces Species. Frontiers in Microbiology. 8, 1-10 (2017).
- Zhang, J. J., Tang, X., Moore, B. S. Genetic platforms for heterologous expression of microbial natural products. Natural Product Reports. 36 (9), 1313-1332 (2019).
- Alduina, R., et al. Artificial chromosome libraries of Streptomyces coelicolor A3(2) and Planobispora rosea. FEMS Microbiology Letters. 218 (1), 181-186 (2003).
- Jones, A. C., et al. Phage P1-Derived Artificial Chromosomes Facilitate Heterologous Expression of the FK506 Gene Cluster. PLoS One. 8 (7), 69319 (2013).
- Gomez-Escribano, J. P., Bibb, M. J. Engineering Streptomyces coelicolor for heterologous expression of secondary metabolite gene clusters. Microbial Biotechnology. 4 (2), 207-215 (2011).
- Cannell, R. J. P. . Natural Products Isolation. , (1998).
- Kersten, R. D., et al. A mass spectrometry-guided genome mining approach for natural product peptidogenomics. Nature Chemical Biology. 7 (11), 794-802 (2011).
- Kersten, R. D., et al. Glycogenomics as a mass spectrometry-guided genome-mining method for microbial glycosylated molecules. Proceedings of the National Academy of Sciences. 110 (47), 4407-4416 (2013).
- Liu, W., et al. MS/MS-based networking and peptidogenomics guided genome mining revealed the stenothricin gene cluster in Streptomyces roseosporus. The Journal of Antibiotics. 67 (1), 99-104 (2014).
- Duncan, K. R., et al. Molecular Networking and Pattern-Based Genome Mining Improves Discovery of Biosynthetic Gene Clusters and their Products from Salinispora Species. Chemistry & Biology. 22 (4), 460-471 (2015).
- Cao, L., et al. MetaMiner: A Scalable Peptidogenomics Approach for Discovery of Ribosomal Peptide Natural Products with Blind Modifications from Microbial Communities. Cell Systems. , (2019).
- Chen, L. -. Y., Cui, H. -. T., Su, C., Bai, F. -. W., Zhao, X. -. Q. Analysis of the complete genome sequence of a marine-derived strain Streptomyces sp. S063 CGMCC 14582 reveals its biosynthetic potential to produce novel anti-complement agents and peptides. PeerJ. 7 (1), 6122 (2019).
- Kim Tiam, S., et al. Insights into the Diversity of Secondary Metabolites of Planktothrix Using a Biphasic Approach Combining Global Genomics and Metabolomics. Toxins. 11 (9), 498 (2019).
- Özakin, S., Ince, E. Genome and metabolome mining of marine obligate Salinispora strains to discover new natural products. Turkish Journal of Biology. 43 (1), 28-36 (2019).
- Trivella, D. B. B., de Felicio, R. The Tripod for Bacterial Natural Product Discovery: Genome Mining, Silent Pathway Induction, and Mass Spectrometry-Based Molecular Networking. mSystems. 3 (2), 00160 (2018).
- Maansson, M., et al. An Integrated Metabolomic and Genomic Mining Workflow To Uncover the Biosynthetic Potential of Bacteria. mSystems. 1 (3), 1-14 (2016).
- Blin, K., Kim, H. U., Medema, M. H., Weber, T. Recent development of antiSMASH and other computational approaches to mine secondary metabolite biosynthetic gene clusters. Briefings in Bioinformatics. 20 (4), 1103-1113 (2019).
- Fisch, K. M. Biosynthesis of natural products by microbial iterative hybrid PKS-NRPS. RSC Advances. 3 (40), 18228-18247 (2013).
- Tatsuno, S., Arakawa, K., Kinashi, H. Analysis of Modular-iterative Mixed Biosynthesis of Lankacidin by Heterologous Expression and Gene Fusion. The Journal of Antibiotics. 60 (11), 700-708 (2007).
- Helfrich, E. J. N., Piel, J. Biosynthesis of polyketides by trans-AT polyketide synthases. Natural Product Reports. 33 (2), 231-316 (2016).
Reprints and Permissions
Request permission to reuse the text or figures of this JoVE article
Request PermissionThis article has been published
Video Coming Soon
Copyright © 2025 MyJoVE Corporation. All rights reserved