Method Article
Design and Construction of an Experimental Setup to Enhance Mineral Weathering through the Activity of Soil Organisms
In This Article
Summary
Here we present the construction and operation of an experimental setup to enhance mineral weathering through the activity of soil organisms while concurrently manipulating abiotic variables known to stimulate weathering. Representative results from the functioning of the setup and sample analyses are discussed together with points for improvement.
Abstract
Enhanced weathering (EW) is an emerging carbon dioxide (CO2) removal technology that can contribute to climate change mitigation. This technology relies on accelerating the natural process of mineral weathering in soils by manipulating the abiotic variables that govern this process, in particular mineral grain size and exposure to acids dissolved in water. EW mainly aims at reducing atmospheric CO2 concentrations by enhancing inorganic carbon sequestration. Until now, knowledge of EW has been mainly gained through experiments that focused on the abiotic variables known for stimulating mineral weathering, thereby neglecting the potential influence of biotic components. While bacteria, fungi, and earthworms are known to increase mineral weathering rates, the use of soil organisms in the context of EW remains underexplored.
This protocol describes the design and construction of an experimental setup developed to enhance mineral weathering rates through soil organisms while concurrently controlling abiotic conditions. The setup is designed to maximize weathering rates while maintaining soil organisms' activity. It consists of a large number of columns filled with rock powder and organic material, located in a climate chamber and with water applied via a downflow irrigation system. Columns are placed above a fridge containing jerrycans to collect the leachate. Representative results demonstrate that this setup is suitable to ensure the activity of soil organisms and quantify their effect on inorganic carbon sequestration. Challenges remain in minimizing leachate losses, ensuring homogeneous ventilation through the climate chamber, and avoiding flooding of the columns. With this setup, an innovative and promising approach is proposed to enhance mineral weathering rates through the activity of soil biota and disentangle the effect of biotic and abiotic factors as drivers of EW.
Introduction
Enhanced weathering (EW) is a relatively new and low-tech carbon dioxide removal (CDR) technology with a significant potential to mitigate climate change1,2,3. The principle of this technology relies on accelerating the natural mineral weathering process in soils, leading to the sequestration of carbon dioxide (CO2) as inorganic carbon (IC)3. Enhanced weathering aims at increasing IC sequestration by artificially optimizing the factors governing mineral weathering, thereby enhancing the speed through which weathering occurs to humanly relevant time scales3. For EW to be most effective, fast-weathering silicate minerals are ground into a powder with a grain size distribution in the micrometers to millimeters range to reach a high reactive surface area in the ~1 m2·g-1 range3,4.
So far, knowledge about EW has been mainly provided by experiments that focus on abiotic factors governing the rates at which minerals are dissolved5. These include mineral reactivity and surface area, temperature, solution composition, water residence time, and acidity4,6,7, but research still needs to be done within this context. Besides being influenced by abiotic factors, natural systems, and soils in particular, are shaped by a vast number of organisms, ranging from microbes to macrofauna such as earthworms. Despite some studies having shown little or no influence of the biotic activity of mineral dissolution8,9,10, other studies have provided evidence that soil organisms such as bacteria11,12, fungi13,14, and earthworms15,16 could increase mineral weathering rates. Therefore, biotic components could be key to understanding the actual IC sequestration potential of EW5.
The first common mechanism through which soil organisms could accelerate mineral dissolution is via CO2 release during respiration,which increases soil acidification17. Besides, bacteria and fungi could increase mineral weathering by exuding protons, chelates, organic acids, and enzymes, all of which enhance mineral dissolution18,19,20,21. For example, chelation through carboxyl and hydroxyl groups can create ion imbalances, transporting elements away from the surfaces of minerals and lowering saturation states20,22. This could lead to less secondary mineral formation and higher efficiency of EW. Moreover, by feeding on soil particles, the strong actions of earthworms' body walls could break down mineral grains into finer particles, increasing their available reactive surface area23. Microbes dwelling in earthworms' intestines and fresh droppings could further attack these smaller particles, which further exudate organic acids and enzymes24,25. Through their burrowing activity, in addition to contributing to the mixing of organic and mineral particles, earthworms also create macropores that could allow water flow to bypass saturated pore space17. This could enable the water to interact with different mineral surfaces and enhance the water-rock contact rate.
Until now, no setup has been built to study EW rates and therefore IC sequestration using soil organisms while ensuring the possibility to optimize different relevant abiotic conditions, such as water inputs, temperature, mineral type, and mineral grain size. Here, the design and explanation of the construction steps of an innovative setup that aims at increasing EW rates through the activity of soil organisms in small mesocosms are presented. The experimental setup consists of 203 columns (length 15 cm, diameter 7 cm) placed in a climate chamber (4.54 m x 2.72 m) at 25 °C for 8 weeks. The 203 columns are divided into 10 groups of 18 and 2 groups of 10 to fit in the climate chamber. One of the two groups of 10 columns is used to allow the insertion of three more columns which are used as blanks. Each group is placed above a fridge and is topped by a remotely controllable irrigation system, which allows for variable irrigation rates within and between fridges. The leachate of each column is collected in a jerrycan kept at a constant temperature in the fridge (Figure 1). One fridge collects the leachate of a group of columns, meaning that one fridge can be considered as a single system of either 18 or 10 columns. Therefore, the number of columns in this experimental setup can be adjusted according to experimental requirements with a maximum of 203 columns.
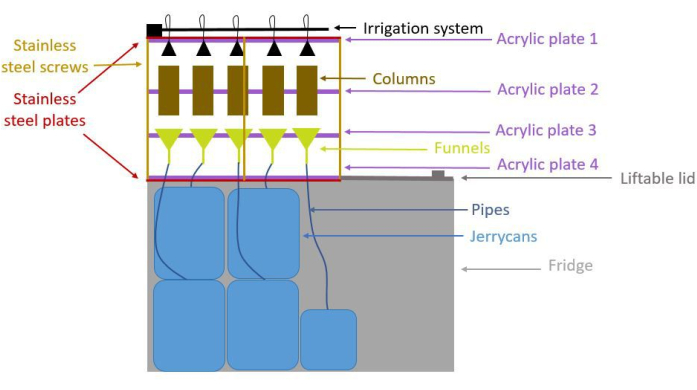
Figure 1: Schematic side-view of the setup showing 5 columns but considering a system of 18 columns. The frame holding the columns is made of stainless-steel plates, stainless steel screws and acrylic plates. Columns are positioned in the middle of the frame and are topped by an irrigation system. Below the columns, funnels are connected to jerrycans through pipes to collect the leachate. Jerrycans are in a fridge that holds the whole system. The fridge can be opened by lifting the lid. Please click here to view a larger version of this figure.
In this setup, the use of silicate rock powders of specific grain sizes ensures that high weathering rates can be reached, while the inoculation with specifically selected bacteria, fungi, and earthworms grants the biotic activity in this artificial system. The setup enables concurrent quantification of carbon sequestered in the solid and in the liquid samples by measuring both dissolved and solid IC, as well as total alkalinity (TA). Besides, other parameters such as pH, electrical conductivity (EC), and ions can be measured in the leachate as indicators of weathering. This setup also allows the assessment of the impact of soil organisms' survival and activity. Representative results are shown to prove the suitability of this protocol to build a setup where increases in weathering rates are derived not only from abiotic factors but also from biotic ones.
Protocol
Below, a detailed protocol for the construction of the different parts of the setup is described considering a system of 18 columns.
1. Constructing the frame holding the columns
- Prepare acrylic plates to hold the irrigation system, the columns, the funnels, and the pipes to collect the leachate.
- Cut three acrylic plates (acrylic plates 1-3) with dimensions of 63 cm x 67 cm and one acrylic plate (acrylic plate 4) with dimensions of 45 cm x 56 cm.
- On each acrylic plate, cut 18 holes following the instructions in the steps below.
- Acrylic plate 1 - top plate: cut holes of diameter 0.7 cm to insert the tubes of the irrigation system later.
- Acrylic plate 2 - second from the top plate: cut holes of diameter 8 cm to insert the columns later (Figure 2).
- Acrylic plate 3 - second from the bottom plate: cut holes of diameter 1.2 cm to insert the funnels later.
- Acrylic plate 4 - bottom plate: cut holes of diameter 1.2 cm to insert later the plastic pipes that bring the leachate to the jerrycans.
- Additionally, cut one hole of diameter 1.1 cm at every corner and one hole of diameter 1.1 cm on the sides of acrylic plates 1-3 to insert the stainless-steel screws.
- For each acrylic plate, print plastic labels with the numbers of the columns (1-18) using a label printer and stick them below the respective hole.
NOTE: Sticking labels on acrylic plates 2, 3, and 4 according to the number of the 18 columns aids in placing the different parts of the setup at their respective location during its installation.
- Use stainless steel plates and screws to hold the acrylic plates.
- Take the tailored-made stainless steel plates, which have been made following the design shown in Figure 3 with dimensions 63.6 cm x 67.3 cm x 4 cm and a thickness of 1.5 mm.
- Drill holes of diameter 1.1 cm at every corner and on the sides of each stainless-steel plate.
- Take stainless steel screws (50 cm in length).
- Insert acrylic plates following the order from top to bottom for acrylic plates 1 (irrigation tubes), 2 (columns), and 3 (funnels) on the stainless-steel screws. Use two hexagon nuts and two washer carriers for each corner to keep the acrylic plate in place.
NOTE: Keep enough distance between each acrylic plate to insert the different components later. Maintain a distance of ~19.5 cm from acrylic plate 1 to acrylic plate 2, ~10.5 cm from acrylic plate 2 to acrylic plate 3, and ~16.5 cm from acrylic plate 3 to acrylic plate 4. - Install top and bottom stainless-steel plates on the stainless-steel screws using two hexagon nuts and two washer carriers for each corner.
- Place the whole system on top of the fridge after the construction of the refrigerator system is completed.
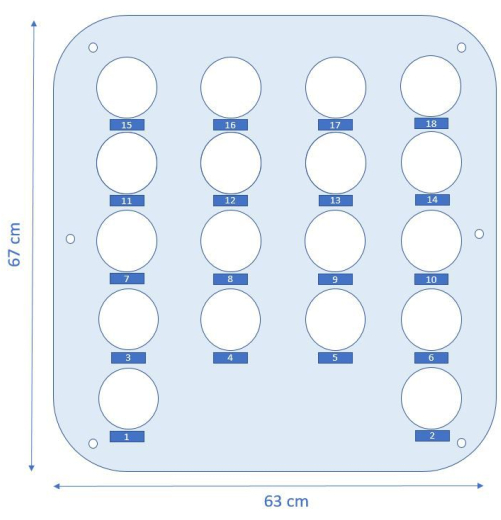
Figure 2: Schematic top view of the design of acrylic plate 2 where the columns are placed. Numbered labels indicate where the corresponding columns need to be placed. Please click here to view a larger version of this figure.
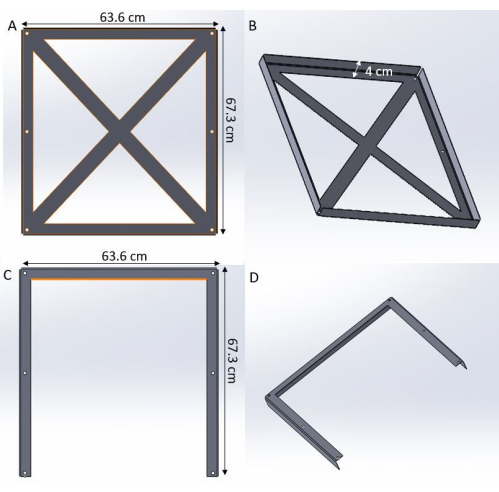
Figure 3: Design of the stainless-steel plates. (A,B) Top plate. (C,D) Bottom plate. Please click here to view a larger version of this figure.
2. Constructing the refrigerator system for the leachate collection
- Set up the fridge to place the jerrycans.
- Remove both lids from the fridge and replace the back lid with acrylic plate 4.
NOTE: Once installed, this acrylic plate is not supposed to be removed. To work inside the fridge, remove the front lid by lifting it. - Place the fridge in the climate chamber and plug it in.
- Set the fridge temperature to 4 °C and place a datalogger inside of the fridge.
- Close the fridge with the front lid.
- Monitor the data recorded by the datalogger overnight. If the temperature deviates from the desired value, remove the lattice at the bottom of the fridge and adjust the temperature. Repeat this procedure until the desired temperature is reached.
- Remove both lids from the fridge and replace the back lid with acrylic plate 4.
- Use polyvinyl chloride (PVC) pipes to connect the funnels to the jerrycans.
- Cut 18 PVC pipes (internal diameter 0.8 cm) with an appropriate length to reach each jerrycan from the different funnels according to the respective numbers.
NOTE: Length varies from a minimum of 38 cm for the shortest tube to a maximum of 81 cm for the longest tube. - Rinse the pipes in demi-water before their first use; in any other case, soak them for 4 days in 50 L of water where 30 g of the citric acid product was diluted to remove carbonate precipitates. Afterward, rinse the pipes again with demi-water.
CAUTION: even if the product for citric acid is safe to use, avoid contact with eyes and prolonged contact with skin by using proper protective measures.
NOTE: if ultrapure water is available, it is preferable to use it instead of demi-water. - Let the pipes air-dry for 24 h.
- Insert the pipes in acrylic plate 4 according to their respective numbers.
- Cut 18 PVC pipes (internal diameter 0.8 cm) with an appropriate length to reach each jerrycan from the different funnels according to the respective numbers.
- Install funnels to direct the leachate to the jerrycans.
- Wipe 18 funnels with ethanol before their first usage; in any other case, follow the same procedure stated for the PVC pipes.
CAUTION: Ethanol is inflammable and can cause irritation of the eyes, skin, and respiratory tract, dizziness, and shallow respiration. Ethanol is harmful by ingestion, inhalation, or skin absorption. - Insert the funnels in acrylic plate 3 and connect them to the respective pipes according to their numbers.
- Wipe 18 funnels with ethanol before their first usage; in any other case, follow the same procedure stated for the PVC pipes.
- Install jerrycans to collect the leachate.
- Take 10 high-density polyethylene (HDPE) jerrycans with a capacity of 10 L and 8 HDPE jerrycans with a capacity of 5 L.
NOTE: Jerrycans of 5 L are used for low irrigation rates, while jerrycans of 10 L are used for high irrigation rates (see Table 1). Jerrycans in HDPE are chosen as this material is chemically inert. - Dilute 50 mL of dishwasher soap in 10 L tap water. Rinse the jerrycans once with this solution, once with tap water, and once with demi-water. Repeat this cleaning procedure before any other usage.
NOTE: if ultrapure water is available, it is preferable to use it instead of demi-water. - Let the jerrycans air-dry for 24 h.
- Drill a hole in the lid of each jerrycan of diameter 1.2 cm to insert the plastic tube to collect the leachate.
- Close the jerrycans with the respective lid.
- Place the jerrycans in the fridge into two layers following the scheme shown in Figure 4 while simultaneously connecting the tubes to the jerrycans.
- Take 10 high-density polyethylene (HDPE) jerrycans with a capacity of 10 L and 8 HDPE jerrycans with a capacity of 5 L.
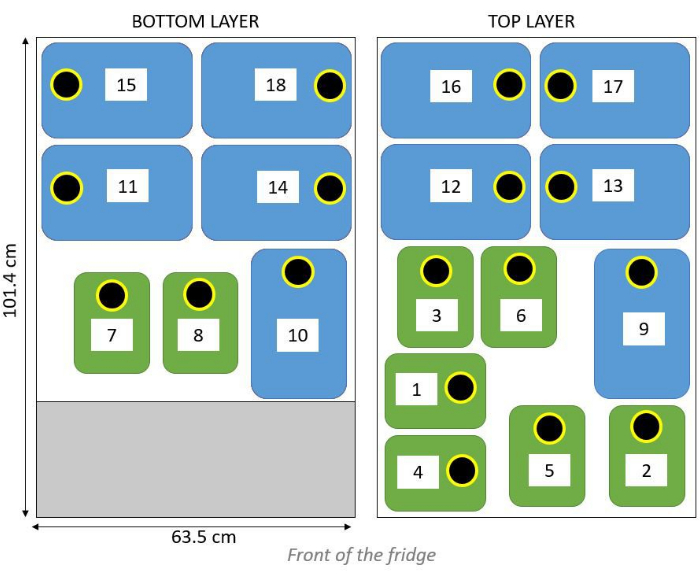
Figure 4: Schematic overview of the jerrycans inside of the fridge into two stacked layers, bottom (left side) and top layer (right side). Black circles indicate the direction of the lids, while the blue and green rectangles indicate 10 L and 5 L jerrycans, respectively. Please click here to view a larger version of this figure.
3. Constructing the columns and the mesh system
- Use PVC columns as mesocosms to incubate rock powder and soil organisms
- Cut the PVC tubes into 18 columns with a length of 15 cm.
- Clean the columns following procedure 1 if it is for their first usage and procedure 2 in any other case.
- Procedure 1:
- Soak the columns in demi-water for 48 h.
NOTE: if ultrapure water is available, it is preferable to use it instead of demi-water. - Rinse the columns with demi-water. Dry and wipe the columns with ethanol.
- Number the columns using labels or directly with a marker on the tube.
- Soak the columns in demi-water for 48 h.
- Procedure 2:
- Soak the columns in water for 1 day.
- Use the brush to scrub away any experimental remnants.
- Dry and wipe the columns with ethanol.
- Procedure 1:
- Use middle rings to hold columns above the funnels.
- With a 3D printer, design a ring (diameter of 8.5 cm and thickness of 0.5 cm). Make sure to draw another ring at the bottom that fits in the holes of acrylic plate 2 for more stability of the columns (Figure 5).
- Print 18 rings with the 3D printer using thermoplastic polyurethane (TPU) 95A material.
- Place the rings on the columns in a position that maintains the columns 2-3 cm above the funnels.
- Use a mesh system at the bottom of the columns to filter the leachate and minimize losses of particles.
- Cut the mesh (10 µm and 20 µm pore size) into squares of 12 cm x 12 cm.
- Soak the mesh in ultrapure water for 2 days. Leave the mesh to air-dry.
- At the bottom of the column, place the first mesh of 20 µm. Place a 1 cm layer of plastic beads over the 20 µm mesh.
- Place the second mesh of 10 µm on top of the 20 µm mesh and the layer of plastic beads.
- Place two cable ties to keep the mesh system in place. Tighten the cable ties and cut their edges.
NOTE: Figure 6 shows how the mesh system should be assembled at the bottom of the column.
- Use a top mesh to avoid earthworms' escape.
- Cut the mesh of 1 mm pore size into squares of 12 cm x 12 cm.
- Once the columns are filled with rock powder, and earthworms are introduced (section 7), place the mesh on top of the columns.
NOTE: This mesh should be placed on top of the columns to prevent earthworms from escaping the columns. In case earthworms are not introduced, it is still recommended to use this mesh to maintain the same conditions for all the columns. - Place a rubber band around the mesh to keep it in place.

Figure 5: Model of the ring to hold the columns for the 3D printer. Please click here to view a larger version of this figure.
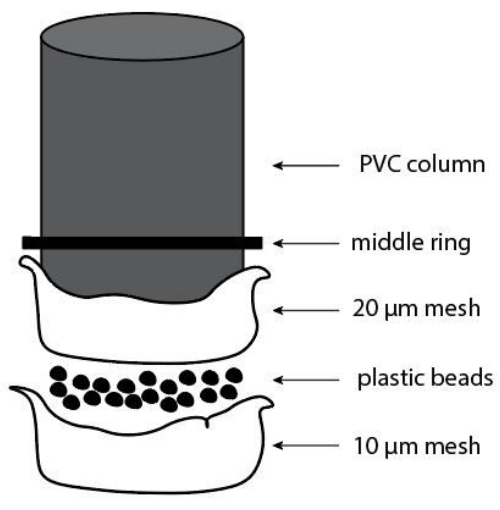
Figure 6: Scheme of the construction of the mesh system at the bottom of the column. Please click here to view a larger version of this figure.
4. Constructing the irrigation system
- Design and create sprinklers to spread water evenly over the columns
- With a 3D printer, make a design for a sprinkler following the model and relative dimensions shown in Figure 7.
- Print 18 sprinklers with the 3D printer using TPU 95A material.
NOTE: After printing, let the sprinklers dry for at least 24 h before inserting them into the PE micro hoses to avoid breaking them.
- Install the irrigation system: valves and tubes.
- Screw two nose pieces on the front of two solenoid valves, and screw two T-piece plug-in fittings at the back of the solenoid valves.
NOTE: If one wants the water hose to end with this system and not to continue to other systems, screw on the back of the valve that will be placed towards the end of the fridge a plug-in fitting with two connections instead of the T-piece plug-in fitting. In this way, the water connection ends here. - Install the two solenoid valves on one side of the top stainless-steel plate.
NOTE: One valve controls one irrigation tube, which in turn irrigates 8 or 10 columns of the total 18 columns. - Cut the low-density polyethylene (LDPE) irrigation pipe into two tubes of 53 cm.
- Close one side of each tube with an end cap.
- Wrap the other end of the tubes in polytetrafluoroethylene (PFTE) tape and connect it to the solenoid valves.
- Make 8 holes in the first irrigation tube closer to the front of the fridge and make 10 holes in the second irrigation tube farther from the front of the fridge.
NOTE: it is very important to make the holes using a hand punch, as this is necessary for the correct positioning and functioning of the pressure regulators. Using other tools as a drill is discouraged. - Insert the pressure regulators into the holes of the two tubes.
- Cut the polyethylene (PE) micro hose into 18 small tubes of a length of 20 cm to reach the columns from the irrigation pipe and attach them to the pressure regulators.
- Insert the small tubes into the holes of acrylic plate 1.
- Insert the sprinklers into the small tubes horizontally to the surface of the columns.
NOTE: If one runs into issues with the irrigation system (e.g., blockages in the water flow or uncontrollable water flow), this can be because of: (a) malfunctioning of the valves, (b) particles remaining in the tube; (c) PFTE tape not wrapped properly around the end of the tube. For point a, replace the valve. For points b and c, be sure that the tubes are cleaned before starting the watering of the columns and that no residues of the PFTE tape hang from the tube respectively. It is important to avoid any transfer of particles that could prevent the valve from functioning correctly.
- Screw two nose pieces on the front of two solenoid valves, and screw two T-piece plug-in fittings at the back of the solenoid valves.
- Set up the connection for the transport of water.
- Cut the polyurethane (PU) hose into three different hoses for the water connection. The exact lengths of the hoses vary depending on the design of the system and the chamber. Use the first hose to connect the T-piece of the first valve to the tap, the second hose to connect the T-pieces of each valve, and the third hose to connect the T-piece of the second valve to the next system.
NOTE: If there is no need for a connection to the next system, cutting the third hose is unnecessary. - Connect the PU hoses to the T-piece plug-in fittings on the back of the solenoid valves.
- Connect the PU hose of the first valve with the tap by screwing a plug-in fitting with two connections on the adapter ring.
- Open the tap to allow water to flow into the tubes.
- Cut the polyurethane (PU) hose into three different hoses for the water connection. The exact lengths of the hoses vary depending on the design of the system and the chamber. Use the first hose to connect the T-piece of the first valve to the tap, the second hose to connect the T-pieces of each valve, and the third hose to connect the T-piece of the second valve to the next system.
- Install the control system and set up the connection to the irrigation system.
- Connect the web-enabled controller, the eight-relay expansion module, and the rail power supply. Place them into the polycarbonate enclosure following the instructions provided by the manufacturer.
NOTE: One modular controller corresponds to one device, which in turn controls eight relays. One relay controls the opening and closing of one specific valve. - Connect the two valves with each other using the electrical cables, and connect the power cable to each valve.
- Connect the other end of the power cable to the web-enabled controller.
- Connect everything to an electrical plug and make an internet connection for the web-enabled controller.
- Connect the web-enabled controller, the eight-relay expansion module, and the rail power supply. Place them into the polycarbonate enclosure following the instructions provided by the manufacturer.
- Set up the online control of irrigation settings to set the irrigation rates.
- Follow the instructions provided by the manufacturer for configuration and setup. For programming and testing, use the web browser.
- Go to http://10.73.10.250/setup.html.
- Use a username and password to log in.
- On the left menu, go to Control/Logic and then to Tasks/Functions.
- One relay controls the opening and closing of one valve. For each relay, there are two tasks, one turns the relay on (valve open), and the other turns the relay off (valve closed). To change the setting of each task, click on Edit.
- When the task of the relay is to be set on, set the date and time at which the relay must start working by clicking on Start Date and Start Time (e.g., 4th May 2022 at 7:45:00; see Figure 8). To set the watering frequency, click on Set Repeat and Repeat Every (e.g., daily every 1 day(s) for a watering frequency of once a day; see Figure 8). To set the date at which the relay stops working, click on End Repeat Date (e.g., 20th May 2022 at 23:59:59; see Figure 8).
- When the task for the relay is to be set off, set the time at which the relay must stop working. This depends on the water irrigation rate required and the watering frequency, e.g., set the time at 7:46:30 for a daily repeat. This means the relay works for 1 min 30 s, for the amount of water of 50 mL·day-1 at the watering frequency of once a day (see Table 1). The start and end dates are the same as the task for setting the relay on, as well as the watering frequency.
- When the setup of each relay is done, remember to click on Save Changes.
NOTE: Not all relays must be working simultaneously, to prevent overloading the system. Always leave at least 30 s in between the tasks of different relays (e.g., relay 1 of device 1 ends its task at 07:46:30, relay 2 of device 1 starts its task at 07:47:00). - Check that the settings of each relay have the same Start Date and End Date. Table 1 shows an example of the time needed for different water irrigation rates at different watering frequencies.
NOTE: The irrigation system allows for more water irrigation rates and watering frequencies besides the ones listed, but it needs to be tested for how long the valves need to stay open for different amounts of water. For the irrigation rates listed in Table 1, it is still good to check with a first test whether this is valid, as it might change according to water pressure and the design of the system.
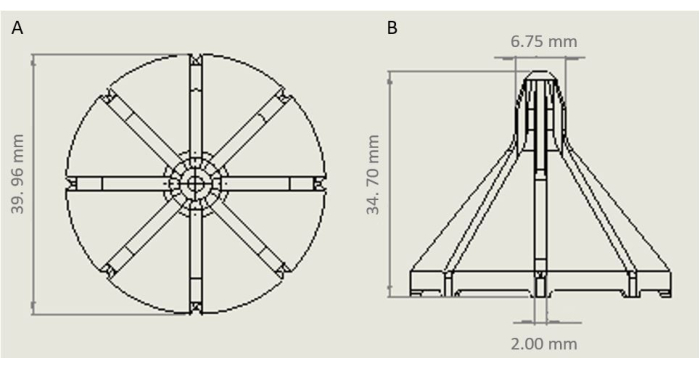
Figure 7: Model of the sprinkler for the irrigation system with relative dimensions. (A) Top view of the sprinkler. (B) Side view of the sprinkler. Please click here to view a larger version of this figure.
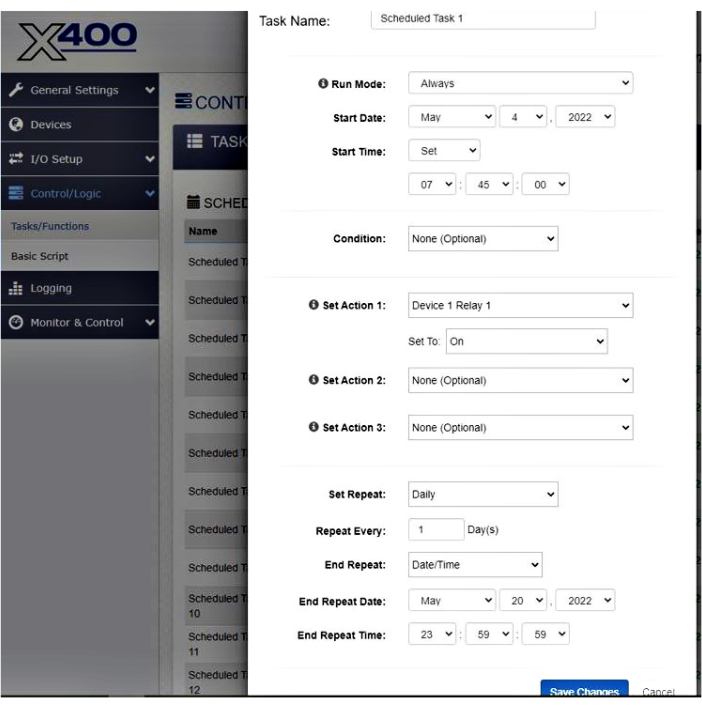
Figure 8: Example of the settings display of the irrigation system for setting the relay on. Please click here to view a larger version of this figure.
| Water irrigation rate (mL·day-1) | Watering frequency (number of times ·day-1) | Time for relay to work (s) |
| 50 | 1 | 95 |
| 2 | 50 | |
| 5 | 23 | |
| 100 | 1 | 190 |
| 2 | 100 | |
| 5 | 45 | |
| 150 | 1 | 280 |
| 2 | 140 | |
| 5 | 55 |
Table 1: Indications of the times needed for the valves to be open to allow different water irrigation rates at different watering frequencies.
5. Selecting rock powders, organic materials, and soil biota
NOTE: For this experiment, rock powders, organic materials, and soil organisms are selected based on availability, local occurrence, and literature review. Additionally, microbes are selected based on their non-pathogenicity, determined by the classification of the technical rules for biological agents (TRBA)26,27,28. Depending on the exact research question, these factors may be adjusted.
- Select rock powders for the experiments.
NOTE: The rock powders that are selected for these experiments are both ultramafic and mafic rocks of various mineralogical compositions, such as dunite and diabase. Each rock has two main classes of grain sizes, fine (micrometer range) and coarse (millimeter range). - Select organic materials for the experiment.
NOTE: The organic materials that are selected for these experiments as a food source for soil biota are wheat straw and digestate from manure and animal feed residues. - Select the bacteria for the experiment.
NOTE: The bacteria that are selected for these experiments are Bacillus subtilis and Cupriavidus metallidurans. Bacteria are sourced from the Leibniz Institute DSMZ (Germany).- Grow bacteria in nutrient broth, consisting of bacto peptone (10 g·L-1), meat extract (3 g·L-1), and sodium chloride (10 g·L-1) dissolved in ultrapure water (18.2 mΩ), following the supplier's instructions.
- Autoclave all culture media at 121 °C for 20 min prior to inoculation with the old culture (volume = 1% of new culture).
- Determine the cell densities via cell counting with a hemacytometer and verify the cell counts via flow cytometry.
NOTE: This study used a flow cytometer equipped with violet (405 nm) and blue (488 nm) lasers, with a flow rate of 10 µL/min, and detected in the FL1 channel (EX 488, EM 525/40).
- Select the fungi for the experiment.
NOTE: The fungi that are selected for these experiments are Knufia petricola, Suillus variegatus, and Aerobasidium pullulans. Fungi are sourced from the Leibniz Institute DSMZ (Germany), except K. petricola, which is sourced from the Westerdijk Institute (The Netherlands).- Grow the fungi cultures in malt extract broth, consisting of malt extract (20 g·L-1), D-(+)-glucose (20 g·L-1), and casein hydrolysate (3 g·L-1) dissolved in ultrapure water (18.2 mΩ), following the suppliers' instructions.
- Autoclave all culture media at 121 °C for 20 min prior to inoculation with the old culture (volume = 1% of new culture). Determine the cell densities via cell counting with a hemacytometer.
- Select earthworms for the experiment.
NOTE: The earthworms that are selected for these experiments are the endogeic species Aporrectodea caliginosa and Allolobophora chlorotica. Earthworms are collected from the park De Blauwe Bergen near Wageningen University & Research in the Netherlands (51°58'51.8"N 5°39'38.0"E) before the experiment.
6. Filling the columns
- Determine the water holding capacity (WHC) of the rock powders and of the organic materials by first drying each material at 105 °C. Then, place the dry material in a bowl and record the weight. Add water little by little until the materials are wet enough and record the final weight. The WHC is then given by Equation 1.
 (1)
(1) - Grind the straw through a 6 mm grinder.
- Oven-dry the minerals and organic materials at 40 °C for 2 consecutive days.
- Weigh 400 g of minerals and 10 g of organic materials in a bowl.
NOTE: Amounts can be adapted according to experimental needs, but the material mixture should fit inside the column. - Adjust the WHC to 80% according to mineral type, mineral grain size, and organic source present.
- Mix everything carefully with a metal spoon.
- Fill the columns with the mixture.
- Place the filled columns in the climate chamber at their respective location, as demonstrated in Figure 2. If the columns cannot be placed immediately in the climate chamber, store them at 15 °C, and cover them with a plastic sheet to prevent water losses and to limit changes in the initial conditions.
NOTE: Hold columns at the bottom and insert them with care in the acrylic plates to avoid loss of their contents. Figure 9 illustrates schematically the steps that should be followed to fill the columns.

Figure 9: Schematic overview of the different steps for filling the columns. Please click here to view a larger version of this figure.
7. Soil biota inoculation
- Inoculate bacteria and fungi at two moments while filling the columns (Method 1) or just before earthworm addition (Method 2).
- Method 1
- Depending on the desired inoculation density (a range of cell densities between 1.5 x 10⁹ and 4.8 x 10¹⁰ cells per column for bacteria and between 5.5 x 10⁷ and 5.5 x 10⁸ cells per column for fungi), inoculate the different microbial species to the mixture of minerals and organic materials once the water has been added according to treatment by using a pipette.
NOTE: The added water needs to be adjusted accordingly in a way that the amount (milliliters) that is added through inoculation is subtracted from the total amount of water that is added to reach 80% of the WHC. - Mix everything carefully with a metal spoon.
- Fill the columns with the mixture.
- Wipe the bowl and the spoon used to mix the materials with ethanol for successive use.
- Cover the columns with the top mesh.
- Depending on the desired inoculation density (a range of cell densities between 1.5 x 10⁹ and 4.8 x 10¹⁰ cells per column for bacteria and between 5.5 x 10⁷ and 5.5 x 10⁸ cells per column for fungi), inoculate the different microbial species to the mixture of minerals and organic materials once the water has been added according to treatment by using a pipette.
- Method 2:
- Depending on the desired inoculation density, inoculate the different microbial species on the surface of the columns according to treatment by using a pipette.
- Cover the columns with the top mesh.
- Method 1
- Depending on the desired density (either 4, 8, or 10 earthworms per column), introduce earthworms in the columns according to treatment by gently depositing them on the surface of the columns. Afterward, cover the column with the top mesh.
NOTE: Both microbes and earthworms should be inoculated 1 day before the watering starts to allow them to adapt to the system. Inoculation density can be changed according to experimental needs. Be aware that this is not a sterile environment, and there can be potential contamination with microorganisms transported by air, water, or input material. To prevent bacterial contamination from ventilation, add a 0.2 µm filter on top of the columns.
8. Samples collection and analyses
- Remove the columns from the chamber at the end of the experimental period.
- Collect earthworms and count them to determine their survival rate and assess their activity.
- Homogenize the mixture of rock powder and organic materials and take subsamples for microbial analyses to further characterize the presence and activity of the microorganisms of interest.
- Dry the content of the columns at 40 °C for 5-7 days for subsequent solid phase analyses for solid inorganic carbon (SIC).
- Weigh the jerrycans to determine the final leachate volume and collect leachate samples for further analyses, such as TA, dissolved inorganic carbon (DIC), pH, EC, and ions.
- The experimental endpoint is to determine whether soil organisms can enhance weathering rates in this system and to find the optimal combination of the variables considered, which leads to the highest carbon sequestration potential. Determine this by comparing results for the analyzed parameters according to the different combinations.
NOTE: The sampling strategy and further analyses can be adjusted according to experimental settings and research needs.
Results
The presented setup consisted of a total of 203 columns located in a climate chamber at 25 °C (Figure 10). The choice of locating the setup in a climate chamber allowed for controlled constant temperature and relative humidity. Placing jerrycans in a fridge at 4 °C ensured that the composition of the leachate was not altered over time because of microbial activity.
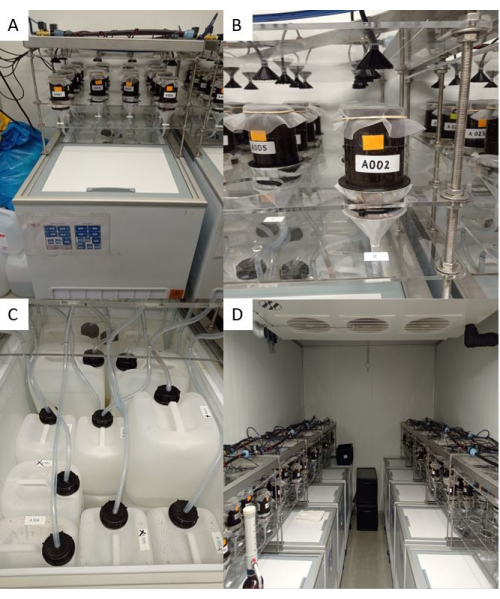
Figure 10: Pictures of the experimental setup in the climate chamber. (A) Overview of a single system. (B) Close-up of a single column. (C) Close-up of jerrycans in the fridge. (D) Overview of all systems in the climate-controlled room. Please click here to view a larger version of this figure.
The use of an advanced automated irrigation system meant that the columns could be watered with varying rates and frequencies using the online control system (Figure 11). The irrigation system allowed to modify the amount of water that the columns received. Validation of the system showed that it led to a minimum difference of 1% and to a maximum difference of 6% in the amount of water given between different columns (Figure 12). Smaller differences were found for lower irrigation rates, while larger differences were found for higher irrigation rates. Overall, the average was lower for irrigation rates of 50 mL·day-1 and 150 mL·day-1, while it was higher for an irrigation rate of 100 mL·day-1 (Figure 12).
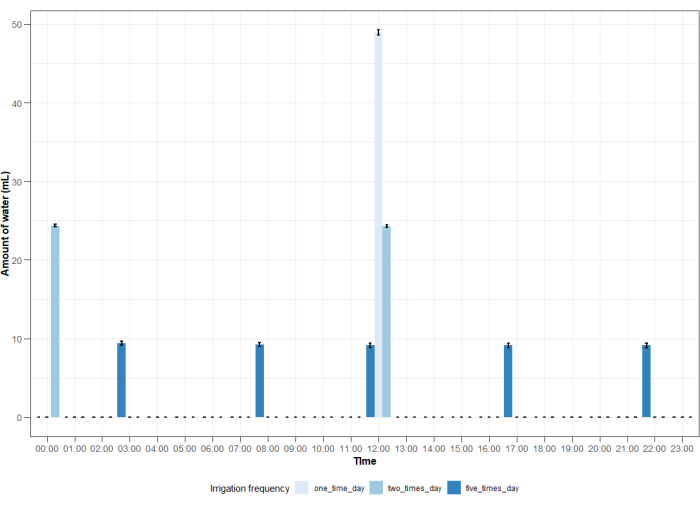
Figure 11: Average amount of water vs. time. Average amount of water measured for an irrigation rate of 50 mL·day-1 distributed over a 24 h period according to three irrigation frequencies of once daily, twice daily, and five times per day for 8 columns. Bars indicate the standard error. Please click here to view a larger version of this figure.
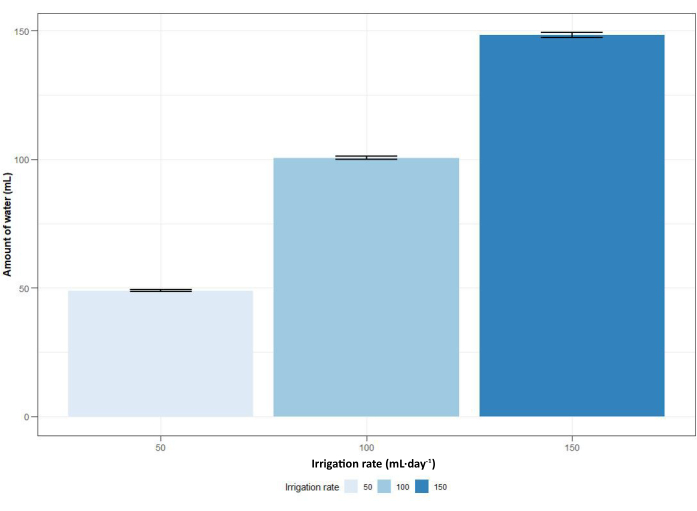
Figure 12: Average amount of water vs. irrigation rate. Average amount of water measured for an irrigation rate of 50 mL·day-1 over 8 columns and for irrigation rates of 100 mL·day-1 and 150 mL·day-1 over 10 columns. Bars indicate the standard error. Please click here to view a larger version of this figure.
The construction and design of this setup allowed the collection of both the solid content inside the columns, consisting of (processed) rock powder and organic materials, and the total amount of leachate that dripped from the columns over the entire experimental period (Figure 13). Despite being successful in collecting the leachate, the final amount of leachate that was collected was lower than the amount of leachate that was expected to be collected at the end of the experiments according to the irrigation rate (Figure 14). The reduced collected leachate was most likely a result of direct evaporation and leachate spills at the bottom of the columns. This should be taken into account when analyzing the results from the analyses.
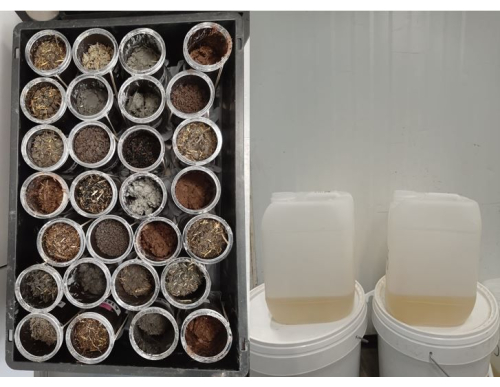
Figure 13: Representative images of the columns and the leachate. Columns filled with rock powder and organic materials at the beginning of the experiments (left side) and leachate collected in the jerrycans at the end of the experiments (right side). Please click here to view a larger version of this figure.
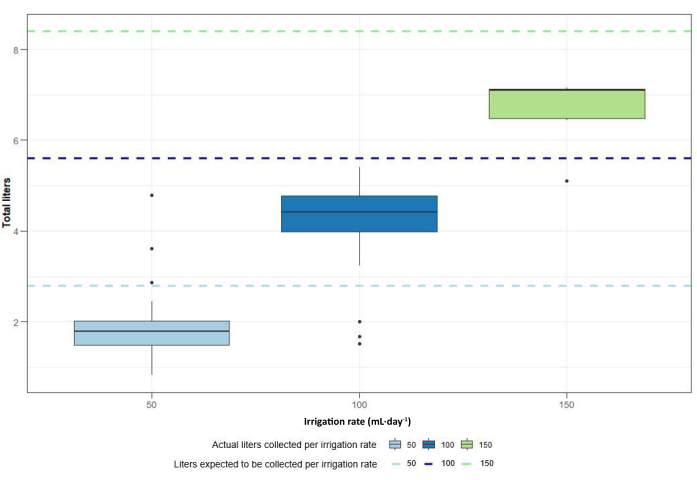
Figure 14: Total liters collected at the end of the experiments per irrigation rate. Dashed lines indicate expected amount of leachate collected according to irrigation rate per experimental period, indicated by the light blue line for 50 mL·day-1, the dark blue line for 100 mL·day-1 and the green line for 150 mL·day-1. Please click here to view a larger version of this figure.
The mix of rock powder and organic material was analyzed to assess the success rate of soil biota in terms of microbial community composition of bacteria and fungi and of survival and activity for earthworms (Figure 15).
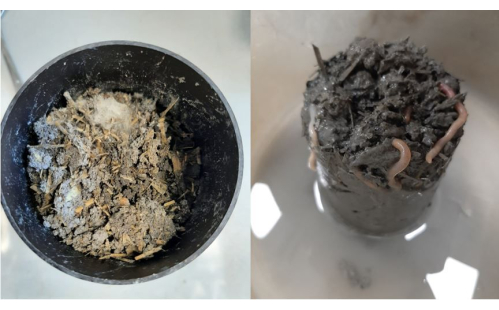
Figure 15: Fungal growth and survival of earthworms. At the end of the experiments and before sampling, visual signs of fungal growth (left side) and earthworms' survival (right side) in the columns filled with rock powder and organic materials. Please click here to view a larger version of this figure.
Besides other parameters, the leachate was analyzed for TA and DIC, as TA and IC are good proxies for mineral weathering rates4,29,30,31. TA was measured with a Metrohm Titrando29,30, while DIC was with a Skalar total organic carbon (TOC) analyzer. By using a TOC analyzer, DIC is calculated from the difference between total dissolved carbon (DC) and dissolved organic carbon (DOC). Figure 16 and Figure 17 show the cumulative distribution for some example values obtained from these analyses for one experimental run. By using this experimental setup, values for TA ranged from 0.019 mol to 0.025 mol, while values for DIC ranged from 7.352 mg C to 259.279 mg C (Figure 16 and Figure 17).
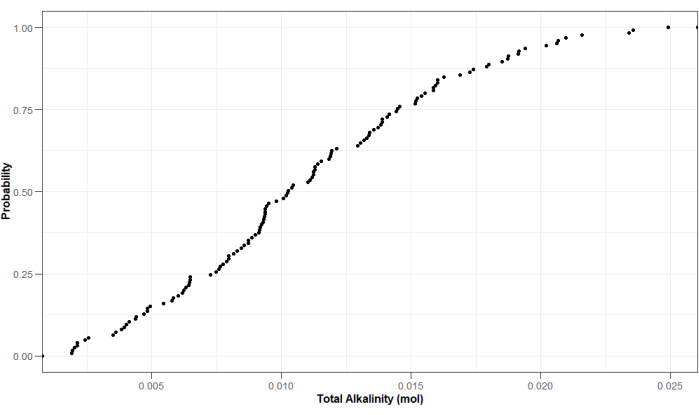
Figure 16: Probability distribution of example values measured for TA in the leachate collected at the end of the experimental period. Treatments where columns flooded, are not displayed. Values are expressed in mol and are corrected for the total amount of leachate collected at the end of the experiments. Please click here to view a larger version of this figure.
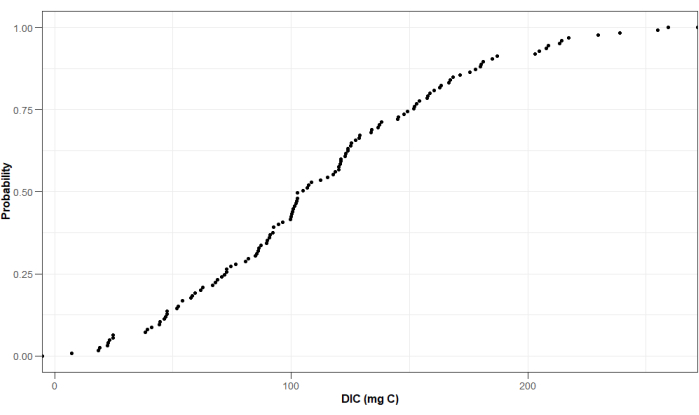
Figure 17: Probability distribution of example values measured for DIC in the leachate collected at the end of the experimental period. Treatments where columns flooded, are not displayed. Values are expressed in mg carbon (C) and are corrected for the total amount of leachate collected at the end of the experiments. Please click here to view a larger version of this figure.
Discussion
Within the current research context, this setup has been uniquely designed to optimize inorganic carbon sequestration by enhancing mineral weathering through the activity of soil biota, while concurrently manipulating abiotic factors known for stimulating weathering. The possibility in this setup of collecting both the solid processed material and the leachate enables a full characterization of both fractions. Despite the enormous amount of columns, the collection of the samples and the analyses carried out ensure a high-quality data collection. Besides, having a large number of combinations in a single experimental run is very important for analyzing the collected data with modern and advanced statistical methods, such as machine learning. These methods can be used to determine the main variables leading to high weathering rates and further carbon sequestration. Consequently, this setup provides the opportunity to improve the understanding of the effects that soil organisms can have on EW and IC sequestration. This is fundamental to establishing more realistic constraints on the boundaries of EW and its efficiency in reducing atmospheric CO2 concentrations. This setup presents several originalities compared to existing studies investigating EW and the effect of soil organisms.
Regarding the effects of abiotic factors on EW, these have already been investigated in previous studies4,29,30,31,32,33,34. Some of these studies compared different amounts, types, and grain sizes of rocks, but their setup either consisted of a pot experiment32,33 or included mixing rock powder with soil34. Other experiments focused on one rock type with different irrigation rates but did not have the possibility of irrigating frequently with an automated system or focused on multiple irrigation rates and frequencies35. Other studies presented a setup similar to the one presented in the current protocol, with the possibility of adjusting irrigation rates and maintaining temperature constant, besides varying rock grain sizes and types29,30. Furthermore, the design of these setups was comparable to the one proposed in the present manuscript and designed to collect the leachate for further analyses29,30. Additionally, CO2 concentrations were varied in these studies as another factor enhancing weathering29. However, none of these previous studies have focused on the effect of biotic factors on promoting EW. In this setup, the aim is to enhance the weathering process, and further IC sequestration, by inoculating specific bacteria, fungi and earthworms and determining to which extent they can accelerate EW.
In relation to the effect of biotic factors on EW, few studies have not specifically focused on EW but have investigated whether soil organisms can influence mineral weathering. These studies have mainly explored how weathering is affected by soil organisms using culture mediums19,21, Petri dishes36, nylon bags buried in the soil14, or small amounts of rock powder mixed with other substrates36,37. Using such small systems or setups makes it challenging to disentangle the effect of organisms from other variables. Some experiments used a similar setup to the one here proposed but at a smaller scale, with rock powder-filled columns inoculated with soil organisms38,39,40. However, these experiments either concurrently grew plants and did not focus on the exclusive effect of specific soil organisms13,35, or did not collect the leachate36. Besides, most of the studies that showed that bacteria, fungi, and earthworms increase mineral weathering have focused on the effect of these organisms on nutrient release as an indication of weathering rather than on IC sequestration11,13,14,19,36,37,38. Above all, none of these earlier studies aimed at promoting EW or presented the possibility of adjusting and maintaining abiotic factors throughout the experimental period. In this setup, instead of keeping all abiotic factors constant, a multitude of combinations are tested for four abiotic factors, such as water irrigation rates and frequencies, rock powder type, and grain size, with the aim of promoting EW through soil organisms' activity.
Besides, none of the previous studies that have focused on the effect of either abiotic or biotic factors on EW presented the possibility of having an extremely large number of columns and variables within one experimental run. In this setup, it is possible to test multiple different combinations of various variables during one run of experiments due to the impressive number of columns for which the setup has been designed, while still providing high-quality results. Given the novelty of the setup, below some possible improvements and remaining challenges that could be considered while designing future similar setups are presented.
Homogenous air conditions in the incubation chamber should be ensured. The placement of the setup in a climate chamber ensured constant temperature and relative humidity. Ventilation constraints (e.g., air flow) may have created spatial variability in atmospheric conditions and thus led to disproportional evaporation from the columns at certain locations, which is a common phenomenon in this kind of setup35. To handle this drawback, when replication and randomization are not possible, it is advised to calculate a water balance for columns placed at various locations throughout the chamber.
The columns should be carefully aligned with the funnels once inserted into the acrylic plate to avoid leachate loss. During the experimental period considered, leachate losses occurred from the bottom of the columns due to an incorrect positioning of the funnels or due to the clogging of the meshes. Together with evaporation, this can partly explain why the leachate collected was lower compared to expectations (Figure 13). To minimize these losses, it is important to make sure that the funnels are optimally positioned below the columns. Using wider funnels is also a viable option. In this case, attention should be paid to the diameter of the holes during the construction of the acrylic plates and the distance between acrylic plates.
Slower water flow in soil column experiments where water is applied frequently is a recurrent issue7,30,40. In the experiments carried out with the presented setup, in some cases rather high irrigation rates and very fine mineral grain sizes were used, which initially lack a structure as normally observed in soils. This might have caused the pores of the meshes at the bottom of the columns only containing fine minerals to clog during the run of the experiments. Therefore, water did not flow fast enough through the columns, which resulted both in flooding of the columns, reducing water infiltration and leachate collection, and in anoxic conditions within the columns, impacting biogeochemical processes. To mitigate this issue, it is important to always mix a certain percentage of coarse with finer mineral grain sizes and to avoid 100% very fine mineral grain size mixtures. Another option is to allow is allow the columns to experience a certain number of wetting/drying cycles to initiate soil structure formation, and thus improve water infiltration. Besides, before the start of the experiment, it would be useful to determine basic soil water dynamics, such as saturated and unsaturated flow and water retention curve, in a few mesocosms to better understand gas flow, mineral saturation state and drivers of organisms' activity.
The presented experimental setup is convenient to use, presents a straightforward installation and can be adjusted according to research needs. In the context of mineral weathering, with the necessary adjustments, it can be coupled with a gas chamber in order not only to characterize carbon in the solid and aqueous phase but to look at the dynamics of carbon in the gas phase as well. Besides, this setup can be used to study realistic water infiltration rates with dry-wet sequences, as these temporal dynamics could strongly influence weathering41. The use of this setup is not limited to experiments that focus solely on silicate minerals, but it can be implemented in column experiments that use different substrates. Besides, the length of the experiments can be shortened or extended according to experimental needs, and the number of columns can be changed. The possibility of collecting samples from both the solid processed materials and the leachate allows us to carry out different analyses to focus on one of the two components or both. To present knowledge, this is the only setup that has been built so far with an exceptional number of columns that aims at using soil organisms to enhance mineral weathering while concurrently controlling abiotic conditions in a system made of solely silicate minerals and organic materials.
Disclosures
The authors have nothing to disclose.
Acknowledgements
We acknowledge Ton van der Zalm from Tupola for the development of the irrigation system. Additionally, we thank Jaco Baars from Tupola for the laughs and mental support given during the building of this setup. We thank Peter Garamszegi and Ángel Velasco Sánchez for helping in watering the columns manually when the irrigation system was not functional. We also thank Steven Heesterman, Xuming Li, Karen Morán Rivera, Jonna van den Berg and Kangying Xie for the help provided during the sampling. We thank Peggy Bartsch, Tom Jäppinen, Peter Nobels, Brent Rotgans, Andre van Leeuwen and Gerlinde Vink for the assistance in the lab, the analyses of the samples and the fruitful discussions. Finally, we thank Jeroen Zonneveld from Unifarm for the provision and maintenance of the climate chamber. This setup was built as part of the Bio-Accelerated Mineral Weathering (BAM!) project, which is funded by the European Union Horizon 2020 framework program for research and innovation under grant agreement No 964545.
Materials
| Name | Company | Catalog Number | Comments |
| Acryl sheet plates | WSV kunststoffen BV | N/A | Used for holding columns, funnels, irrigation tubes and pipes. |
| Adapter ring | Tameson | FL2S-FM-B-014G-034G | Used ot make the system to connect the PU hose to the tap. |
| Cable ties | Gamma | 456196 | Used for holding the mesh system. |
| Citric acid | Nortembio (amazon.nl) | B01BDLOGW2 | Used for cleaning pipes and funnels. |
| CytoFLEX flow cytometer | Beckam Coulter | CytoFLEX | |
| Dishwasher soap | BOOM | 77000307.9010 | Used for cleaning the jerrycans. |
| Eight relay expansion module | Control by web | X-12s | Used to control the valves of hte irrigation system. |
| End cap | Wildkamp | 819906 | Used to close one end of the main tube of the irrigation system. |
| Fridges | HorecaGemak | DIA-BVL031/6P | Used for storing the jerrycans. |
| Funnels | Praxisdienst | 135864 | Used for directing the leachate from the columns to the jerrycans. 75 mm diamater. |
| Hand punch | Wildkamp | 719928 | Used to cut holes for small tubes in the main tube of the irrigation tube. |
| HDPE Jerrycan 10 L | Glas-shop.be | 105157 | Come with lid. Used to collect the leachate. |
| HDPE Jerrycan 5 L | Glas-shop.be | 105156 | Come with lid. Used to collect the leachate. |
| Hexagon nut | Fabory | 51080.100.001 | Used to block acryl sheets on metal screws. |
| Label printer | Brother | PT-H107B | Used for printing labels to stick on acryl sheets. |
| Ldpe irrigation pipe | Wildkamp | 15382585 | Used to make main tube of the irrigation system. |
| Luggage scale | United Entertainment | 8718274546996 | Used to weigh jerrycans. |
| Mesh 10 μm | Franz Eckert | PES-10/2 | Used for the mesh system. |
| Mesh 20 μm | Franz Eckert | PES-20/13 | Used for the mesh system. |
| Metal screws | Schroeven goothandel.nl | 100975401010 | Used to install acryl sheets. |
| Micro hose for drip irrigation | Wildkamp | 15119128 | Used to make small tubes of the irrigation system. |
| Middle ring | self-made with 3D printer | self-made with 3D printer | Used for holding the columns a few centimeters above the funnels. |
| Nosepiece | Wildkamp | 15045986 | Used to connect the solenoid valve to the irrigation pipe. |
| Nylon mesh | Sefar | N/A | 1 mm mesh used for the top of the columns to prevent earthworms' escape. |
| Plastic beads | lyondelbasell | TRC 352N C12507 | Used for the mesh system. |
| Plug-in fitting with 2 connections | Tameson | F24V5 | Used at the end of the system to end the PU hose. |
| Polycarbonate enclosure | RS | 498-5387 | Used to house the electronical compontents of the irrigation system. |
| Power cable | RS | 775-6075 | Used to connect the valves. |
| pp coupling | Wildkamp | 719780 | Used to make the system to connect the PU hose to the tap. |
| Pressure regulator | Wildkamp | 719943 | Used to make sure all small tubes were releasing same amount of water. |
| PTFE tape | GAMMA | 237001 | Used ot wrap the end of hte irrigation pipe. |
| PU hose | Tameson | PU-8-1198-50-1 | Used to connect all the valves with eath other and to the tap. |
| PVC pipes | Rubbermagazijn | 99001230 | Used for connecting the funnels to the jerrycans. |
| PVC tubes | Wildkamp | 91700 | Used to make the columns. |
| Rail power supply | RS | 145-7873 | Used to supply power to the eight relay expansion module. |
| Rubber bands | PasschierTerpo | 8714603820621 | Used to hold the mesh for earthworms. |
| Solenoid valve | Tameson | CM-DA014B020E-024DC | Used for opening and closing of the waterflow. |
| Sprinklers | self-made with 3D printer | self-made with 3D printer | Used for evenly distribute the water over the columns. |
| Stainless steel plates | 24/7 tailor steel | N/A | Used as a frame for the set-up above the fridge. |
| T-piece plug in fitting | Tameson | F25DT | Used to connect the solenoid valve to the PU hose. |
| TPU 95A material | MakerPoint | 1756 | Used to print components with 3D printer. |
| Washer carriers | Fabory | 50095.100.001 | Used to put below hexagon nut. |
| Web Enabled Controller | Control by web | X-400-I(9-28 VDC) | Used for allowing online control of the irrigation settings. |
References
- Beerling, D. J., et al. Potential for large-scale CO2 removal via enhanced rock weathering with croplands. Nature. 583 (7815), 242-248 (2020).
- Fuss, S., et al. Negative emissions - Part 2: Costs, potentials and side effects. Environmental Research Letters. 13, 063002(2018).
- Goll, D. S., et al. Potential CO2 removal from enhanced weathering by ecosystem responses to powdered rock. Nature Geoscience. 14 (8), 545-549 (2021).
- Hartmann, J., et al. Enhanced chemical weathering as a geoengineering strategy to reduce atmospheric carbon dioxide, supply nutrients, and mitigate ocean acidification. Reviews of Geophysics. 51 (2), 113-149 (2013).
- Vicca, S., et al. Is the climate change mitigation effect of enhanced silicate weathering governed by biological processes. Global Change Biology. 28 (3), 711-726 (2022).
- Strefler, J., Amann, T., Bauer, N., Kriegler, E., Hartmann, J. Potential and costs of carbon dioxide removal by enhanced weathering of rocks. Environmental Research Letters. 13 (3), 034010(2018).
- te Pas, E. E., Hagens, M., Comans, R. N. Assessment of the enhanced weathering potential of different silicate minerals to improve soil quality and sequester CO2. Frontiers in Climate. 4, 954064(2023).
- Jordan, G., Pokrovsky, O. S., Guichet, X., Schmahl, W. W. Organic and inorganic ligand effects on magnesite dissolution at 100 °C and pH = 5 to 10. Chemical Geology. 242 (3-4), 484-496 (2007).
- Shirokova, L. S., et al. Experimental study of the effect of heterotrophic bacterium (Pseudomonas reactans) on olivine dissolution kinetics in the context of CO2 storage in basalts. Geochimica et Cosmochimica Acta. 80, 30-50 (2012).
- Pokrovsky, O. S., Shirokova, L. S., Zabelina, S. A., Jordan, G., Bénézeth, P. Weak impact of microorganisms on Ca, Mg-bearing silicate weathering. npj Materials Degradation. 5, 51(2021).
- Basak, B. B., Biswas, D. R. Influence of potassium solubilizing microorganism (Bacillus mucilaginosus) and waste mica on potassium uptake dynamics by sudan grass (Sorghum vulgare Pers.) grown under two Alfisols. Plant and Soil. 317 (1-2), 235-255 (2009).
- Gouda, S., et al. Revitalization of plant growth promoting rhizobacteria for sustainable development in agriculture. Microbiological Research. 206, 131-140 (2018).
- Burghelea, C. I., et al. Trace element mobilization during incipient bioweathering of four rock types. Geochimica et Cosmochimica Acta. 234, 98-114 (2018).
- Wild, B., Imfeld, G., Daval, D. Direct measurement of fungal contribution to silicate weathering rates in soil. Geology. 49 (9), 1055-1058 (2021).
- Hu, L., et al. Earthworm gut bacteria increase silicon bioavailability and acquisition by maize. Soil Biology and Biochemistry. 125, 215-221 (2018).
- Liu, D., Lian, B., Wang, B., Jiang, G. Degradation of potassium rock by earthworms and responses of bacterial communities in its gut and surrounding substrates after being fed with mineral. PLoS ONE. 6 (12), e28803(2011).
- Schwartzman, D. The geobiology of weathering: a 13th hypothesis. arXiv. , (2015).
- Buss, H. L., Lüttge, A., Brantley, S. L. Etch pit formation on iron silicate surfaces during siderophore-promoted dissolution. Chemical Geology. 240 (3-4), 326-342 (2007).
- Sun, L. L., et al. Differences in the gene expressive quantities of carbonic anhydrase and cysteine synthase in the weathering of potassium-bearing minerals by Aspergillus niger. Science China Earth Sciences. 56 (12), 2135-2140 (2013).
- Van Hees, P. A. W., et al. Oxalate and ferricrocin exudation by the extramatrical mycelium of an ectomycorrhizal fungus in symbiosis with Pinus sylvestris. New Phytologist. 169 (2), 367-378 (2006).
- Xiao, L., Lian, B., Hao, J., Liu, C., Wang, S. Effect of carbonic anhydrase on silicate weathering and carbonate formation at present day CO2 concentrations compared to primordial values. Scientific Reports. 5, 7733(2015).
- Welch, S. A., Taunton, A. E., Banfield, J. F. Effect of microorganisms and microbial metabolites on apatite dissolution. Geomicrobiology Journal. 19 (3), 343-367 (2002).
- Suzuki, Y., Matsubara, T., Hoshino, M. Breakdown of mineral grains by earthworms and beetle larvae. Geoderma. 112 (1-2), 131-142 (2003).
- Carpenter, D., Hodson, M. E., Eggleton, P., Kirk, C. The role of earthworm communities in soil mineral weathering: a field experiment. Mineralogical Magazine. 72 (1), 33-36 (2008).
- Georgiadis, A., Marhan, S., Lattacher, A., Mäder, P., Rennert, T. Do earthworms affect the fractionation of silicon in soil. Pedobiologia. 75, 1-7 (2019).
- Committee for Biological Agents (ABAS). TRBA 450 classification criteria for biological agents. , https://www.baua.de/DE/Angebote/Rechtstexte-und-Technische-Regeln/Regelwerk/TRBA/TRBA-450.html (2016).
- Committee for Biological Agents (ABAS). TRBA 466 Classification of prokaryotes (bacteria and archaea) into risk groups. , https://www.baua.de/EN/Service/Legislative-texts-and-technical-rules/Rules/TRBA/TRBA-466.html (2010).
- Committee for Biological Agents (ABAS). TRBA 460 Classification of fungi in risk groups. , https://www.baua.de/DE/Angebote/Rechtstexte-und-Technische-Regeln/Regelwerk/TRBA/TRBA-460.html (2016).
- Amann, T., Hartmann, J. Carbon accounting for enhanced weathering. Frontiers in Climate. 4, 849948(2022).
- Amann, T., Hartmann, J., Hellmann, R., Pedrosa, E. T., Malik, A. Enhanced weathering potentials-the role of in situ CO2 and grain size distribution. Frontiers in Climate. 4, 929268(2022).
- Vienne, A., et al. Enhanced weathering using basalt rock powder: carbon sequestration, co-benefits and risks in a mesocosm study with Solanum tuberosum. Frontiers in Climate. 4, 869456(2022).
- Ten Berge, H. F., et al. Olivine weathering in soil, and its effects on growth and nutrient uptake in ryegrass (Lolium perenne L.): a pot experiment. PLoS ONE. 7 (8), e42098(2012).
- Amann, T., et al. Enhanced weathering and related element fluxes-a cropland mesocosm approach. Biogeosciences. 17 (1), 103-119 (2020).
- Dietzen, C., Harrison, R., Michelsen-Correa, S. Effectiveness of enhanced mineral weathering as a carbon sequestration tool and alternative to agricultural lime: an incubation experiment. International Journal of Greenhouse Gas Control. 74, 251-258 (2018).
- Wood, C., Harrison, A. L., Power, I. M. Impacts of dissolved phosphorus and soil-mineral-fluid interactions on CO2 removal through enhanced weathering of wollastonite in soils. Applied Geochemistry. 148, 105511(2023).
- Carpenter, D., Hodson, M. E., Eggleton, P., Kirk, C. Earthworm induced mineral weathering: preliminary results. European Journal of Soil Biology. 43, S176-S183 (2007).
- De Souza, M. E. P., et al. Vermicomposting with rock powder increases plant growth. Applied Soil Ecology. 69, 56-60 (2013).
- Burghelea, C., et al. Mineral nutrient mobilization by plants from rock: influence of rock type and arbuscular mycorrhiza. Biogeochemistry. 124, 187-203 (2015).
- Zaharescu, D. G., et al. Ecosystem composition controls the fate of rare earth elements during incipient soil genesis. Scientific Reports. 7, 43208(2017).
- Van Grinsven, J. J. M., Van Riemsdijk, W. H. Evaluation of batch and column techniques to measure weathering rates in soils. Geoderma. 52 (1-2), 41-57 (1992).
- Calabrese, S., et al. Nano-to global-scale uncertainties in terrestrial enhanced weathering. Environmental Science & Technology. 56 (22), 15261-15272 (2022).
Reprints and Permissions
Request permission to reuse the text or figures of this JoVE article
Request PermissionThis article has been published
Video Coming Soon
Copyright © 2025 MyJoVE Corporation. All rights reserved