
Using GIS to Investigate Urban Forestry
Overview
Source: Laboratories of Margaret Workman and Kimberly Frye - Depaul University
Urban forests broadly include urban parks, street trees, landscaped boulevards, public gardens, river and coastal promenades, greenways, river corridors, wetlands, nature preserves, natural areas, shelterbelts of trees, and working trees at industrial brownfield sites. The history of urban trees begins with trees as landscape embellishment. Today, urban trees are seen as essential components of city infrastructure and critical to human life as food, housing, and other public utilities. Urban trees are now valued for the ecosystem services they provide (e.g., preventing erosion, air pollutant removal, oxygen, shade, etc.). Yet, to efficiently make use of these benefits, trees must reach maturity, as leaf number and size directly affect a tree’s ability to provide ecosystem services. Urban forestry has had to develop its own forestry methods to address the needs and challenges unique to urban trees as compared to their woodland counterparts.
The following excerpt from the USDA Forest Service illustrates the urban tree perspective and policies of federal government:
Urban forests are dynamic ecosystems that provide needed environmental services by cleaning air and water, helping to control storm water, and conserving energy. They add form, structure, beauty and breathing room to urban design, reduce noise, separate incompatible uses, provide places to recreate, strengthen social cohesion, leverage community revitalization, and add economic value to our communities... This natural life support system sustains clean air and water, biodiversity, habitat, nesting and travel corridors for wildlife, and connects people to nature.
The management of urban trees is an interdisciplinary practice involving architecture, landscaping, planning, development, horticulture, etc. One particular discipline involved in forestry is geography, especially through the use of geographical information systems (GIS). GIS is a broad name encompassing any type of database containing geographical or spatial data that can be used to create computer-generated visual representations (e.g., maps). GIS allows for extensive data collection and management through ever-improving user interfaces, increasing the user-friendly quality of very large sets of information that can be accessed by many users. GIS applications range from free software and open access protocols, such as Google Earth, to proprietary systems, like ESRI ArcGIS. Using GIS to create and store geographical information also allows for easy data maintenance, because maps can be quickly updated by adding new information to the database and regenerating the visual output.
Procedure
1. Data Collection with GPS Receiver and dbh Tape
- In an open outdoor location, turn on the GPS receiver by pressing the power button. Wait 2-3 min while receiver connects to a minimum of three satellites.
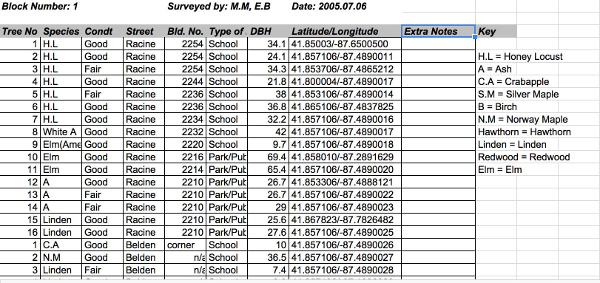
- Walk to the survey area for data collection. Survey one city block segment at a time and number the parkway trees on a data sheet (Figure 1), resetting the numbering at the start of each block segment.
- At each tree in the survey, record species, postal address (e.g.
Results
Figure 1 shows the representative results for street trees found on one block, and a map from urban forestry data entered into GIS can be seen in Figure 4.
The results for using the Tree Benefit Calculator can be found in Table 2. This calculator provides an estimation of the benefits individual street-side trees provide. Once the data from the field investigation is inputted, including zip code, species, diameter, and land-use, the environmen
Application and Summary
Once entered into a GIS, forestry data can be analyzed using geospatial statistics. For example, a Moran’s I geospatial statistical test is a widely used statistic that analyzes for significant geographical clustering of health variables. Moran’s I can be used for forestry data to report dbh values localized to particular areas, indicating different tree growth rates in different locations of the forest. If clustering is significant, a General G geospatial statistical test can additionally r
Skip to...
Videos from this collection:

Now Playing
Using GIS to Investigate Urban Forestry
Environmental Science
12.6K Views

Tree Identification: How To Use a Dichotomous Key
Environmental Science
81.2K Views

Tree Survey: Point-Centered Quarter Sampling Method
Environmental Science
49.4K Views

Proton Exchange Membrane Fuel Cells
Environmental Science
22.1K Views

Biofuels: Producing Ethanol from Cellulosic Material
Environmental Science
53.2K Views

Testing For Genetically Modified Foods
Environmental Science
89.8K Views

Turbidity and Total Solids in Surface Water
Environmental Science
35.9K Views

Dissolved Oxygen in Surface Water
Environmental Science
55.8K Views

Nutrients in Aquatic Ecosystems
Environmental Science
38.9K Views

Measuring Tropospheric Ozone
Environmental Science
26.4K Views

Determination Of NOx in Automobile Exhaust Using UV-VIS Spectroscopy
Environmental Science
30.1K Views

Lead Analysis of Soil Using Atomic Absorption Spectroscopy
Environmental Science
125.5K Views

Carbon and Nitrogen Analysis of Environmental Samples
Environmental Science
29.5K Views

Soil Nutrient Analysis: Nitrogen, Phosphorus, and Potassium
Environmental Science
215.9K Views

Analysis of Earthworm Populations in Soil
Environmental Science
16.5K Views
Copyright © 2025 MyJoVE Corporation. All rights reserved