Cross Cylindrical Flow: Measuring Pressure Distribution and Estimating Drag Coefficients
Overview
Source: David Guo, College of Engineering, Technology, and Aeronautics (CETA), Southern New Hampshire University (SNHU), Manchester, New Hampshire
The pressure distributions and drag estimations for cross cylindrical flow have been investigated for centuries. By ideal inviscid potential flow theory, the pressure distribution around a cylinder is vertically symmetric. The pressure distribution upstream and downstream of the cylinder is also symmetric, which results in a zero-net drag force. However, experimental results yield very different flow patterns, pressure distributions and drag coefficients. This is because the ideal inviscid potential theory assumes irrotational flow, meaning viscosity is not considered or taken into account when determining the flow pattern. This differs significantly from reality.
In this demonstration, a wind tunnel is utilized to generate a specified airspeed, and a cylinder with 24 ports of pressure is used to collect pressure distribution data. This demonstration illustrates how the pressure of a real fluid flowing around a circular cylinder differs from predicted results based on the potential flow of an idealized fluid. The drag coefficient will also be estimated and compared to the predicted value.
Procedure
1. Measuring the pressure distribution around a cylinder
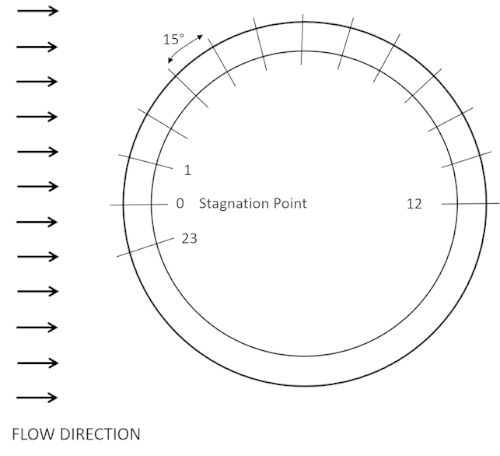
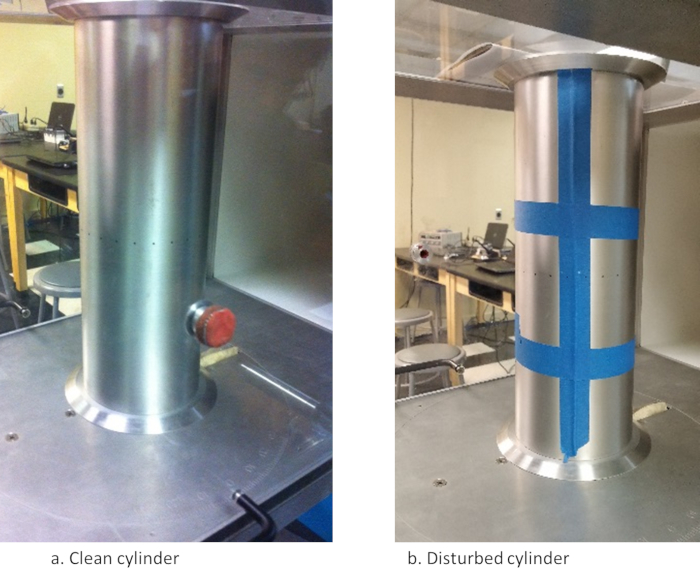
- Remove the top cover of the test section of a wind tunnel, and mount a clean, aluminum cylinder (d = 4 in) with 24 built-in ports on a turntable (Figure 3). Install the cylinder so that port zero is facing upstream (Figure 4a).
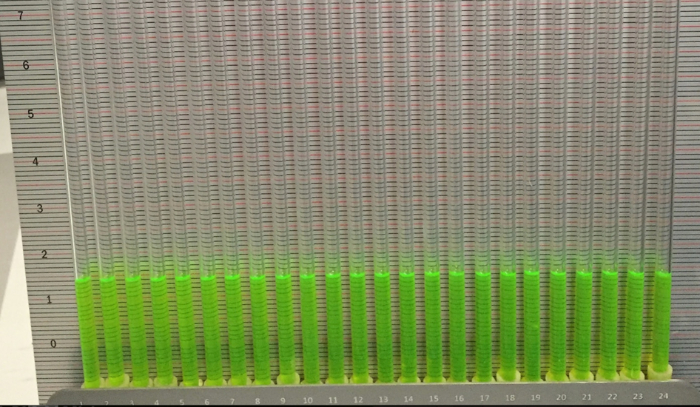
- Replace the top cover, and connect the 24 pressure tubes labeled 0 - 23 to the corresponding ports on the manometer panel. The manometer panel
Results
Experimental results for the clean and disturbed cylinder are shown in Tables 1 and 2, respectively. The data can be plotted in a graph of the pressure coefficient, Cp, versus angular position, θ, for ideal and real flow as shown in Figure 6.