A subscription to JoVE is required to view this content. Sign in or start your free trial.
Method Article
التسمية خالية في الموقع تصوير Lignification في جدران الخلايا النباتية
In This Article
Summary
ويرد على أساس أسلوب رامان المجهري متحد البؤر التي تتيح تسمية خالية من التصور اللجنين في جدران الخلايا النباتية ومقارنة lignification في الأنسجة المختلفة ، وعينات أو الأنواع.
Abstract
Meeting growing energy demands safely and efficiently is a pressing global challenge. Therefore, research into biofuels production that seeks to find cost-effective and sustainable solutions has become a topical and critical task. Lignocellulosic biomass is poised to become the primary source of biomass for the conversion to liquid biofuels1-6. However, the recalcitrance of these plant cell wall materials to cost-effective and efficient degradation presents a major impediment for their use in the production of biofuels and chemicals4. In particular, lignin, a complex and irregular poly-phenylpropanoid heteropolymer, becomes problematic to the postharvest deconstruction of lignocellulosic biomass. For example in biomass conversion for biofuels, it inhibits saccharification in processes aimed at producing simple sugars for fermentation7. The effective use of plant biomass for industrial purposes is in fact largely dependent on the extent to which the plant cell wall is lignified. The removal of lignin is a costly and limiting factor8 and lignin has therefore become a key plant breeding and genetic engineering target in order to improve cell wall conversion.
Analytical tools that permit the accurate rapid characterization of lignification of plant cell walls become increasingly important for evaluating a large number of breeding populations. Extractive procedures for the isolation of native components such as lignin are inevitably destructive, bringing about significant chemical and structural modifications9-11. Analytical chemical in situ methods are thus invaluable tools for the compositional and structural characterization of lignocellulosic materials. Raman microscopy is a technique that relies on inelastic or Raman scattering of monochromatic light, like that from a laser, where the shift in energy of the laser photons is related to molecular vibrations and presents an intrinsic label-free molecular "fingerprint" of the sample. Raman microscopy can afford non-destructive and comparatively inexpensive measurements with minimal sample preparation, giving insights into chemical composition and molecular structure in a close to native state. Chemical imaging by confocal Raman microscopy has been previously used for the visualization of the spatial distribution of cellulose and lignin in wood cell walls12-14. Based on these earlier results, we have recently adopted this method to compare lignification in wild type and lignin-deficient transgenic Populus trichocarpa (black cottonwood) stem wood15. Analyzing the lignin Raman bands16,17 in the spectral region between 1,600 and 1,700 cm-1, lignin signal intensity and localization were mapped in situ. Our approach visualized differences in lignin content, localization, and chemical composition. Most recently, we demonstrated Raman imaging of cell wall polymers in Arabidopsis thaliana with lateral resolution that is sub-μm18. Here, this method is presented affording visualization of lignin in plant cell walls and comparison of lignification in different tissues, samples or species without staining or labeling of the tissues.
Protocol
1. تحضير العينة
- جبل العينة النباتية المائية ، مثل الخشب أو جذع شجرة الحور Arabidopsis thaliana الجذعية ، في مشراح.
- خفض الشرائح الرقيقة (عادة 20 ميكرون سميكة) من النسيج الأصلي.
- نقل قسم النبات على شريحة ميكروسكوب زجاجية.
- نقع قسم النبات في D 2 O ، وتغطي مع كوب زلة تغطية ، وهي مختومة على الشريحة مجهر لمنع تبخر D 2 O. قسم النبات هو الآن جاهز للتصوير أو يمكن تخزينها لاستخدامها في المستقبل.
2. نموذج القياس
- تطبيق زيت الغمر في تحقيق الهدف المجهر و / أو زلة غطاء.
- مكان وتأمين شريحة مجهر المسح على المسرح كهرضغطية من المجهر ، مع انزلاق الغطاء تواجه الهدف المجهر.
- عرض عينة من خلال زلة تغطية عالية باستخدام الغمر الفتحة العددية الهدف المجهر (100X ، NA = 1.40) ، وتحديد منطقة عينة من الفائدة.
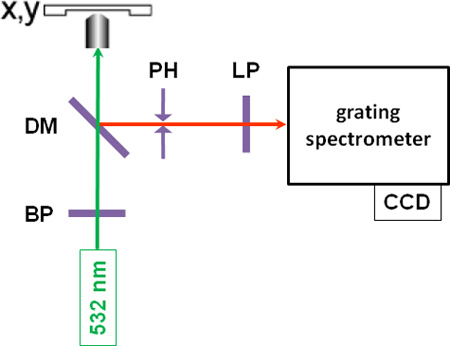
- يتم إجراء قياسات microspectroscopic بعد إيقاف جميع ضوء المختبرية وغيرها من مصادر المجهر ، والموقف ، من خلال التركيز حل ممر الموجة مفلتر الضوء الاخضر أحادي اللون (λ = 532 نانومتر) من CW - بالليزر على عينة نموذجية مع قوة من 10 إلى 30 ميغاواط ( انظر الشكل رقم 1 لالتخطيطي من الإعداد). تألق ذاتي يمكن أن يحدث في بعض العينات ، والتي قد تمنع قياسات مفيدة ، والذي يعد إثارة القضية مع ضوء الليزر الطول الموجي قد يكون من المستحسن.
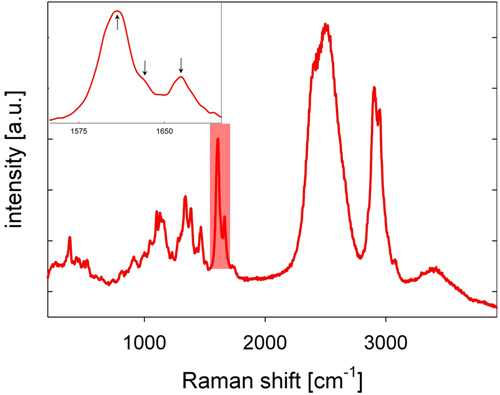
- يتم جمع متناثرة الضوء الخلفي رامان ستوكس التي تحول الهدف المجهر ، يمر من خلال مرآة مزدوج اللون ، وذات الثقب ، والتي هي بمثابة تصفية المكانية في الإعداد مبائر ، وتصفية longpass ، ويركز في الشق من صريف مطياف ، حيث فرقت طيفيا الضوء والكشف عنها بواسطة كاميرا CCD تبريده ، وإعطاء الطيف رامان. ويرد الطيف رامان من خشب الحور في الشكل 2 ، مع العصابات اللجنين مميزة في المنطقة الطيفية بين 1600 و 1700 سم -1.
- التصوير الكيميائية والتصور للتوزيع المكاني اللجنين ، وحصلت على خريطة ثنائية الأبعاد الطيفي بواسطة النقطية مسح العينة من خلال التركيز الليزر مع مرحلة فحص وتسجيل كهرضغطية طائفة رامان لكل موقف العينة. قد يكون إنشاء خرائط ثلاثية الأبعاد الطيفي بواسطة التراص ثنائي الأبعاد لخرائط التي كانت كثفت التركيز على التوالي ليزر على طول ض الاتجاه.
3. تحليل البيانات
- التصوير الكيميائية والتصور اللجنين ، ويتم تحليل البيانات التي تم جمعها باستخدام MATLAB (MathWorks ، الإصدار 7.7). يتم ترتيب البيانات في مكعب ثلاثي الأبعاد الفائقة الطيفية ، التي تتألف من البعدين المكاني والبعد الثالث للإشارات الطيفية.
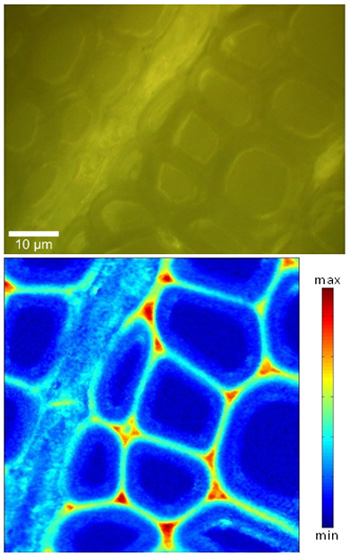
- لتحليل اللجنين ، تعتبر المنطقة الطيفية بين 1550 و 1700 سم -1 (انظر الشكل 2). التوزيع المكاني للاللجنين هو تصور من خلال دمج كثافة من 1550 إلى 1700 سم -1 من الأطياف الأساس لتصحيح (انظر الشكل 3). كبديل للتصويب خط الأساس ، يمكن حسابها الثاني مشتق الأطياف والقمم الثاني مشتق تستخدم للتحليل.
- قد تكون اللجنين التعريب والكيمياء ، وخاصة فيما يتعلق coniferaldehyde والأنصاف coniferyl الكحول ، لمزيد من التحليل من خلال تقييم المنطقة تحت قمم غاوسي تركيبها من المجموعات الثلاث وجدت بين 1600 و 1700 سم -1 (انظر الشكل رقم 2 من أقحم والحكام 15 -- 17).
- يتم تنفيذ التطبيع بين الكثافة الطيفية المختلفة باستخدام الخرائط كمرجع ذروة الذروة من الفرقة OD خارجي يمتد حوالي 2500 سم -1 في أطياف التجويف المتوسط ، والتي حصلت عليها ك يعني تصنيف المجموعات. هذا أمر بالغ الأهمية ، ويسمح احد لشدة مقارنة إشارة اللجنين بين القياسات المختلفة والأنسجة ، وعينات والأنواع.
4. ممثل النتائج
ويرد ممثل الطيف رامان من خشب الحور الجذعية (حور angustifolia) في الشكل رقم 2. تم العثور على نطاقات اللجنين مميزة في المنطقة الطيفية بين 1600 و 1700 سم -1. كمثال على ذلك ، يتم تقديم التوزيع المكاني للاللجنين في شريحة خشب الحور في الشكل 3. مقارنة لصورة مرئية ، شكليا مناطق متميزة جدار الخلية تصبح تمييزها بوضوح بسبب كثافة مختلفة اللجنين الإشارة. ويلاحظ ارتفاع الكثافة إشارة اللجنين في زوايا الخلية (CC) ، وإلى حد ما أقل ، في مجمع صفاحات المتوسطة (CML). ولوحظت كميات أقل ، ولكن لا يستهان بها ، من اللجنين داخل الجدار S2 طبقة من الألياف. تم العثور على تباين كثافة اللجنين إشارة إلى حد ما داخل CC ، CML وS2 ، وخاصة من الألياف إلى الألياف. القرار المكانية الوحشي في القياسات لدينا ~ 300 نانومتر. جودة البيانات يفسح المجال بشكل جيد للمقارنة بين lignificationعينات وكذلك تشريح اللجنين الكيمياء 15.

الشكل 1 : والتخطيطي للإعداد أداة BP : ممر الموجة مرشح ؛ DM : مرآة مزدوج اللون ، ودرجة الحموضة : الثقب ؛ ليرة لبنانية : longpass التصفية.

الرقم 2 : طيف ممثل من خشب الحور رامان الجذعية (حور angustifolia) التي سجلت في D 2 O. منطقة الضوء الطيفي (انظر أيضا أقحم) علامات المنطقة الطيفية وجود ثلاث قمم تعزى على وجه التحديد إلى اللجنين.

الشكل 3 : رامان اللجنين الصورة (أسفل) من شريحة خشب الحور (أعلى : صورة مرئية) ، التي تم الحصول عليها من خلال دمج كثافة إشارة رامان من 1550 إلى 1700 سم -1.
Discussion
هي مواد Lignocellulosic الهرمي وغير متجانسة فيما يتعلق بكل من هيكلها وتكوينها. لتوصيف الأدوات التحليلية المتعمقة التي الحساسية الكيميائية ، القرار المكانية ، والتي تعطي نظرة ثاقبة هذه المواد في سياق الأم ومرغوب فيه. وصف الأسلوب يتيح للتصور اللجنين ومقارنة lignification من الكتل?...
Disclosures
Acknowledgements
نشكر اندرو كارول ، Chaibang برايت ، Purbasha ساركار (الطاقة الحيوية للعلوم معهد بيركلي) ، بهرام بارفين (مختبر لورانس بيركلي الوطني) وتشيانغ فنسنت لام (ولاية كارولينا الشمالية جامعة) للتعاون المثمر ومناقشات مفيدة. وأيد هذا العمل من قبل معهد العلوم البيولوجية الطاقة. وأيد العمل في مسبك الجزيئية من مكتب العلوم ومكتب للعلوم الأساسية للطاقة ، وزارة الطاقة في الولايات المتحدة بموجب العقد رقم DE - AC02 - 05CH1123.
Materials
| Name | Company | Catalog Number | Comments |
| microscope slides | |||
| cover slips | |||
| D2O | |||
| nail polish | |||
| immersion oil | |||
| tweezers | |||
| pointed brush | |||
| microtome | |||
| confocal Raman microscope |
References
- Herrera, S. Bonkers about biofuels. Nat Biotechnol. 24, 755-760 (2006).
- Himmel, M. E. Biomass recalcitrance: Engineering plants and enzymes for biofuels production. Science. 315, 804-807 (2007).
- Pauly, M., Keegstra, K. Cell-wall carbohydrates and their modification as a resource for biofuels. Plant J. 54, 559-568 (2008).
- Pauly, M., Keegstra, K. Physiology and metabolism 'Tear down this wall. Curr Opin Plant Biol. 11, 233-235 (2008).
- Ragauskas, A. J. The path forward for biofuels and biomaterials. Science. 311, 484-489 (2006).
- Somerville, C. Biofuels. Curr Biol. 17, R115-R119 (2007).
- Ralph, J., Brunow, G., Boerjan, W. . Lignins in Encyclopedia of Life Sciences. , (2007).
- Chiang, V. L. From rags to riches. Nat Biotechnol. 20, 557-558 (2002).
- Atalla, R. H., Agarwal, U. P. Raman microprobe evidence for lignin orientation in the cell walls of native woody tissue. Science. 227, 636-638 (1985).
- Atalla, R. H., Agarwal, U. P. Recording Raman spectra from plant cell walls. J Raman Spectrosc. 17, 229-231 (1986).
- Fukushima, K. Regulation of syringyl to guaiacyl ratio in lignin biosynthesis. J Plant Res. 114, 499-508 (2001).
- Agarwal, U. P. Raman imaging to investigate ultrastructure and composition of plant cell walls: distribution of lignin and cellulose in black spruce wood (Picea mariana). Planta. 224, 1141-1153 (2006).
- Gierlinger, N., Schwanninger, M. Chemical imaging of poplar wood cell walls by confocal Raman microscopy. Plant Physiol. 140, 1246-1254 (2006).
- Gierlinger, N., Schwanninger, M. The potential of Raman microscopy and Raman imaging in plant research. Spectrosc Int J. 21, 69-89 (2007).
- Schmidt, M. Label-free in situ imaging of lignification in the cell wall of low lignin transgenic Populus trichocarpa. Planta. 230, 589-597 (2009).
- Agarwal, U. P., Argyropoulos, D. S. An Overview of Raman Spectroscopy as Applied to Lignocellulosic Materials. Advances in Lignocellulosics Characterization. , 201-225 (1999).
- Agarwal, U. P., Ralph, S. A. Determination of ethylenic residues in wood and TMP of spruce by FT-Raman spectroscopy. Holzforschung. 62, 667-675 (2008).
- Schmidt, M. Raman imaging of cell wall polymers in Arabidopsis thaliana. Biochem Biophys Res Comm. 395, 521-523 (2010).
Reprints and Permissions
Request permission to reuse the text or figures of this JoVE article
Request PermissionExplore More Articles
This article has been published
Video Coming Soon
Copyright © 2025 MyJoVE Corporation. All rights reserved