A subscription to JoVE is required to view this content. Sign in or start your free trial.
Method Article
Label-free in situ Imaging of Lignification in Plant Cell Walls
In This Article
Summary
A method based on confocal Raman microscopy is presented that affords label-free visualization of lignin in plant cell walls and comparison of lignification in different tissues, samples or species.
Abstract
Meeting growing energy demands safely and efficiently is a pressing global challenge. Therefore, research into biofuels production that seeks to find cost-effective and sustainable solutions has become a topical and critical task. Lignocellulosic biomass is poised to become the primary source of biomass for the conversion to liquid biofuels1-6. However, the recalcitrance of these plant cell wall materials to cost-effective and efficient degradation presents a major impediment for their use in the production of biofuels and chemicals4. In particular, lignin, a complex and irregular poly-phenylpropanoid heteropolymer, becomes problematic to the postharvest deconstruction of lignocellulosic biomass. For example in biomass conversion for biofuels, it inhibits saccharification in processes aimed at producing simple sugars for fermentation7. The effective use of plant biomass for industrial purposes is in fact largely dependent on the extent to which the plant cell wall is lignified. The removal of lignin is a costly and limiting factor8 and lignin has therefore become a key plant breeding and genetic engineering target in order to improve cell wall conversion.
Analytical tools that permit the accurate rapid characterization of lignification of plant cell walls become increasingly important for evaluating a large number of breeding populations. Extractive procedures for the isolation of native components such as lignin are inevitably destructive, bringing about significant chemical and structural modifications9-11. Analytical chemical in situ methods are thus invaluable tools for the compositional and structural characterization of lignocellulosic materials. Raman microscopy is a technique that relies on inelastic or Raman scattering of monochromatic light, like that from a laser, where the shift in energy of the laser photons is related to molecular vibrations and presents an intrinsic label-free molecular "fingerprint" of the sample. Raman microscopy can afford non-destructive and comparatively inexpensive measurements with minimal sample preparation, giving insights into chemical composition and molecular structure in a close to native state. Chemical imaging by confocal Raman microscopy has been previously used for the visualization of the spatial distribution of cellulose and lignin in wood cell walls12-14. Based on these earlier results, we have recently adopted this method to compare lignification in wild type and lignin-deficient transgenic Populus trichocarpa (black cottonwood) stem wood15. Analyzing the lignin Raman bands16,17 in the spectral region between 1,600 and 1,700 cm-1, lignin signal intensity and localization were mapped in situ. Our approach visualized differences in lignin content, localization, and chemical composition. Most recently, we demonstrated Raman imaging of cell wall polymers in Arabidopsis thaliana with lateral resolution that is sub-μm18. Here, this method is presented affording visualization of lignin in plant cell walls and comparison of lignification in different tissues, samples or species without staining or labeling of the tissues.
Protocol
1. Sample Preparation
- Mount the hydrated plant sample, e.g. poplar stem wood or Arabidopsis thaliana stem, in the microtome.
- Cut thin sections (typically 20 μm thick) from the native tissue.
- Transfer the plant section onto a glass microscope slide.
- Soak the plant section in D2O and cover with a glass cover slip, which is sealed onto the microscope slide to prevent evaporation of D2O. The plant section is now ready for imaging or it can be stored for future use.
2. Sample Measurement
- Apply immersion oil to the microscope objective and/or the cover slip.
- Place and secure the microscope slide on the piezoelectric scan stage of the microscope, with the cover slip facing the microscope objective.
- View the sample through the cover slip using a high numerical aperture immersion microscope objective (100x, NA = 1.40) and locate the sample area of interest.
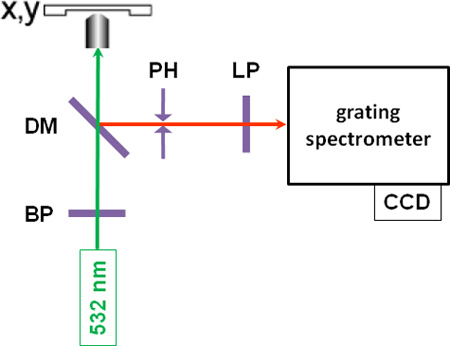
- After switching off all other laboratory and microscope light sources, position-resolved microspectroscopic measurements are performed by focusing bandpass-filtered monochromatic green light (λ = 532 nm) from a cw-laser onto the sample with a typical power of 10 to 30 mW (see Figure 1 for a schematic of the setup). Autofluorescence can occur in some samples, which may prohibit useful measurements, in which case excitation with longer wavelength laser light may be advisable.
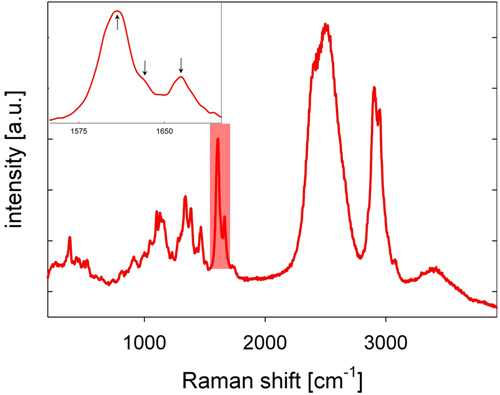
- The back-scattered Stokes-shifted Raman light is collected by the microscope objective, passes through a dichroic mirror, a pinhole, which serves as a spatial filter in the confocal setup, and a longpass filter, and is focused into the slit of a grating spectrometer, where the light is spectrally dispersed and detected by a cooled CCD camera, giving a Raman spectrum. A Raman spectrum of poplar wood is shown in Figure 2, with characteristic lignin bands in the spectral region between 1,600 and 1,700 cm-1.
- For chemical imaging and visualization of the spatial lignin distribution, a two-dimensional spectral map is acquired by raster scanning the sample through the laser focus with the piezoelectric scan stage and recording a Raman spectrum for each sample position. Three-dimensional spectral maps may be generated by stacking two-dimensional maps for which the laser focus was stepped consecutively along the z-direction.
3. Data Analysis
- For chemical imaging and lignin visualization, the collected data is analyzed using MATLAB (MathWorks, version 7.7). The data is arranged in a three-dimensional hyperspectral cube, which is composed of the two spatial dimensions and a third dimension for the spectral signals.
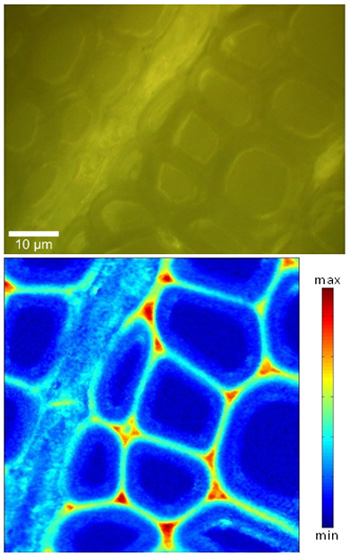
- For the lignin analysis, the spectral region between 1,550 and 1,700 cm-1 is considered (see Figure 2). The spatial distribution of lignin is visualized by integrating the intensity from 1,550 to 1,700 cm-1 of the baseline-corrected spectra (see Figure 3). As an alternative to baseline correction, second-derivative spectra may be computed and the second-derivative peaks used for analysis.
- Lignin localization and chemistry, especially with regard to coniferaldehyde and coniferyl alcohol moieties, may be further analyzed by evaluating the area under fitted Gaussian peaks of the three bands found between 1,600 and 1,700 cm-1 (see inset of Figure 2 and Refs. 15-17).
- Intensity normalization between different spectral maps is performed using as a reference the peak height of the extrinsic O D stretching band around 2,500 cm-1 in the average lumen spectra, which are obtained by k-means clustering classification. This is critical and allows one to compare lignin signal intensities between different measurements, tissues, samples and species.
4. Representative Results
A representative Raman spectrum of poplar (Populus angustifolia) stem wood is shown in Figure 2. Characteristic lignin bands are found in the spectral region between 1,600 and 1,700 cm-1. As an example, the spatial distribution of lignin in a poplar wood cross-section is presented in Figure 3. Compared to the visible image, morphologically distinct cell wall regions become clearly distinguishable due to different lignin signal intensity. High lignin signal intensity is observed in the cell corners (CC) and, somewhat less, in the compound middle lamellae (CML). Lower, yet not insubstantial, amounts of lignin are observed within the S2 wall layer of the fibers. Variability of lignin signal intensity is found to some extent within CC, CML and S2, especially from fiber to fiber. The lateral spatial resolution in our measurements is ~300 nm. The data quality lends itself well to compare lignification between samples and to further dissect lignin chemistry15.

Figure 1: A schematic of the instrumental setup. BP: bandpass filter; DM: dichroic mirror, PH: pinhole; LP: longpass filter.

Figure 2: A representative Raman spectrum of poplar (Populus angustifolia) stem wood recorded in D2O. The highlighted spectral area (also see the inset) marks the spectral region having three peaks specifically attributable to lignin.

Figure 3: Raman lignin image (bottom) of a poplar wood cross-section (top: visible image), obtained by integrating the Raman signal intensity from 1,550 to 1,700 cm-1.
Discussion
Lignocellulosic materials are hierarchical and heterogeneous with regard to both structure and composition. For an in-depth characterization analytical tools that have chemical sensitivity, spatial resolution, and that give insights into these materials in the native context are desirable. The described method affords the visualization of lignin and comparison of lignification of lignocellulosic plant biomass with spatial resolution that is sub-μm without staining or labeling of the samples in a close to native state....
Disclosures
No conflicts of interest declared.
Acknowledgements
We thank Andrew Carroll, Bright Chaibang, Purbasha Sarkar (Energy Biosciences Institute, Berkeley), Bahram Parvin (Lawrence Berkeley National Laboratory) and Vincent L. Chiang (North Carolina State University) for fruitful collaborations and helpful discussions. This work was supported by the Energy Biosciences Institute. Work at the Molecular Foundry was supported by the Office of Science, Office of Basic Energy Sciences, of the US Department of Energy under Contract No. DE-AC02-05CH1123.
Materials
| Name | Company | Catalog Number | Comments |
| microscope slides | |||
| cover slips | |||
| D2O | |||
| nail polish | |||
| immersion oil | |||
| tweezers | |||
| pointed brush | |||
| microtome | |||
| confocal Raman microscope |
References
- Herrera, S. Bonkers about biofuels. Nat Biotechnol. 24, 755-760 (2006).
- Himmel, M. E. Biomass recalcitrance: Engineering plants and enzymes for biofuels production. Science. 315, 804-807 (2007).
- Pauly, M., Keegstra, K. Cell-wall carbohydrates and their modification as a resource for biofuels. Plant J. 54, 559-568 (2008).
- Pauly, M., Keegstra, K. Physiology and metabolism 'Tear down this wall. Curr Opin Plant Biol. 11, 233-235 (2008).
- Ragauskas, A. J. The path forward for biofuels and biomaterials. Science. 311, 484-489 (2006).
- Somerville, C. Biofuels. Curr Biol. 17, R115-R119 (2007).
- Ralph, J., Brunow, G., Boerjan, W. . Lignins in Encyclopedia of Life Sciences. , (2007).
- Chiang, V. L. From rags to riches. Nat Biotechnol. 20, 557-558 (2002).
- Atalla, R. H., Agarwal, U. P. Raman microprobe evidence for lignin orientation in the cell walls of native woody tissue. Science. 227, 636-638 (1985).
- Atalla, R. H., Agarwal, U. P. Recording Raman spectra from plant cell walls. J Raman Spectrosc. 17, 229-231 (1986).
- Fukushima, K. Regulation of syringyl to guaiacyl ratio in lignin biosynthesis. J Plant Res. 114, 499-508 (2001).
- Agarwal, U. P. Raman imaging to investigate ultrastructure and composition of plant cell walls: distribution of lignin and cellulose in black spruce wood (Picea mariana). Planta. 224, 1141-1153 (2006).
- Gierlinger, N., Schwanninger, M. Chemical imaging of poplar wood cell walls by confocal Raman microscopy. Plant Physiol. 140, 1246-1254 (2006).
- Gierlinger, N., Schwanninger, M. The potential of Raman microscopy and Raman imaging in plant research. Spectrosc Int J. 21, 69-89 (2007).
- Schmidt, M. Label-free in situ imaging of lignification in the cell wall of low lignin transgenic Populus trichocarpa. Planta. 230, 589-597 (2009).
- Agarwal, U. P., Argyropoulos, D. S. An Overview of Raman Spectroscopy as Applied to Lignocellulosic Materials. Advances in Lignocellulosics Characterization. , 201-225 (1999).
- Agarwal, U. P., Ralph, S. A. Determination of ethylenic residues in wood and TMP of spruce by FT-Raman spectroscopy. Holzforschung. 62, 667-675 (2008).
- Schmidt, M. Raman imaging of cell wall polymers in Arabidopsis thaliana. Biochem Biophys Res Comm. 395, 521-523 (2010).
Reprints and Permissions
Request permission to reuse the text or figures of this JoVE article
Request PermissionExplore More Articles
This article has been published
Video Coming Soon
Copyright © 2025 MyJoVE Corporation. All rights reserved