
Electrochemical Impedance Spectroscopy
Overview
Source: Kara Ingraham, Jared McCutchen, and Taylor D. Sparks, Department of Materials Science and Engineering, The University of Utah, Salt Lake City, UT
Electrical resistance is the ability of an electrical circuit element to resist the flow of electricity. Resistance is defined by Ohm's Law:
 (Equation 1)
Where  is the voltage and
  is the current. Ohm's law is useful for determining the resistance of ideal resistors. However, many circuit elements are more complex and can't be described by resistance alone. For example, if an alternating current (AC) is used then the resistivity will often depend on the frequency of the AC signal. Instead of using resistance alone, electrical impedance is a more accurate and generalizable measure of a circuit element's ability to resist the flow of electricity.
Most commonly, the goal of electrical impedance measurements is the deconvolution of a sample's total electrical impedance into contributions from different mechanisms such as resistance, capacitance, or induction.
Procedure
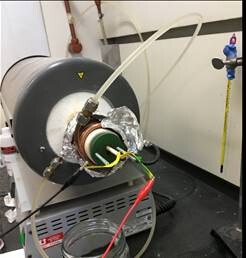
- Obtain a test module and hook it up to the EIS instruments via two electrodes. The test module, pictured in Figure 3, provides data that can be used to model a simple, known circuit. It can be used to confirm that the wires are hooked up to the machine correctly and that all the machinery parts are functioning.

Figure 3: Test module.
Results
Results of EIS are often presented in a Nyquist plot, which shows real impedance versus complex impedance at each frequency tested. The plot of the experiment ran can be seen in Figure 6.

Figure 6: Screenshot of computer after Nyquist plot was obtained.
Application and Summary
Electrochemical Impedance Spectroscopy is a useful tool for determining how a new material or device impedes the flow of electricity. It does this by applying an AC signal through the electrodes connected to the sample. The data is collected and plotted by the computer in the complex plain. With the help of software, the graph can be modeled after specific parts of a circuit. This data can often be very complicated and requires careful analysis. This technique, however complex, is an extremely useful non-destructive mean
Tags

Skip to...
Videos from this collection:

Now Playing
Electrochemical Impedance Spectroscopy
Materials Engineering
23.4K Views

Optical Materialography Part 1: Sample Preparation
Materials Engineering
15.6K Views

Optical Materialography Part 2: Image Analysis
Materials Engineering
11.1K Views

X-ray Photoelectron Spectroscopy
Materials Engineering
21.9K Views

X-ray Diffraction
Materials Engineering
89.7K Views

Focused Ion Beams
Materials Engineering
9.0K Views

Directional Solidification and Phase Stabilization
Materials Engineering
6.7K Views

Differential Scanning Calorimetry
Materials Engineering
38.7K Views

Thermal Diffusivity and the Laser Flash Method
Materials Engineering
13.4K Views

Electroplating of Thin Films
Materials Engineering
20.2K Views

Analysis of Thermal Expansion via Dilatometry
Materials Engineering
16.0K Views

Ceramic-matrix Composite Materials and Their Bending Properties
Materials Engineering
8.4K Views

Nanocrystalline Alloys and Nano-grain Size Stability
Materials Engineering
5.2K Views

Hydrogel Synthesis
Materials Engineering
23.8K Views
Copyright © 2025 MyJoVE Corporation. All rights reserved