
没有x在汽车尾气利用紫外-可见光谱法测定
Overview
资料来源: 玛格丽特工人和金伯利弗莱-Depaul 大学实验室
在对流层臭氧是自然形成的时候阳光分裂二氧化氮 (2):
没有2 + 阳光 → 无 + O
O + O2 → O3
臭氧 (O3) 可以去与一氧化氮 (NO),形成二氧化氮 (2) 与氧气发生反应:
不 + O3 → 没有2 + O2
这会导致臭氧 (O3) 没有净增益。然而,随着汇的人为生产的臭氧形成前体 (没有、 没有2和挥发性有机化合物) 通过化石燃料的燃烧,对流层中的臭氧水平升高被发现。汽车废气是这些臭氧形成前体的一个重要来源:2和挥发性有机化合物 (VOCs) 不,不。例如,移动源组成几乎没有 + 没有2排放量的 60%。
在发现一辆汽车燃烧室内的温度高,氮和空气中的氧气发生反应,形成一氧化氮 (NO) 和二氧化氮 (2):
N2 (g) + O2 (g)→ 2 没有(g)
2 无(g) + O2 (g)→ 2 没有2 (g)
在汽车尾气排放一氧化氮 (NO) 逐渐氧化为二氧化氮 (2) 环境空气中。这种混合物的无2经常被称为没有x。当与挥发性有机化合物在阳光照射下大气中反应没有x时,对流层臭氧形式,如在此看到简化化学反应:
没有x + VOCs + 阳光 → O3 + 其他产品
这个有毒的混合物的空气污染,其中可以包括醛类、 过氧化乙酰硝酸盐、 臭氧、 挥发性有机化合物,没有x,称为光化学烟雾。臭氧是光化学烟雾的最大组成部分。这烟雾发现在所有的现代城市,但它发现特别是在阳光明媚、 温暖、 干燥的气候和大量的机动车辆的城市。黄棕色的颜色在空气中的烟雾是到期部分到目前,二氧化氮由于这种气体吸收可见光近 400 毫微米 (图 1)。
短期无2暴露 (30 分钟到 1 天) 会导致呼吸造成的不良影响,在健康人中,哮喘患者增加呼吸道症状。没有x与氨和其他化合物对窗体粒子反应。这些小颗粒可以穿透肺部,并导致呼吸系统问题,包括肺气肿和支气管炎。个人谁花了大量时间在路上或谁住在附近的巷道经验相当高暴露于没有2。
由于它对人类健康和环境的影响,美国环境保护署 (EPA) 没有2作为一种标准的污染物进行了分类和已设置的基本标准在 100 ppb (1 h 每天的最大浓度,平均 3 年以上的第 98 个百分点值) 和 53 ppb (年平均)。考虑道路上车辆占大约 1/3 的没有x排放量在美国,汽车的排放量因此规管通过清洁空气法案 》。美国环境保护署成立汽车制造商必须遵循当生产汽车的废气排放标准。目前,层 2 排放标准设置,制造商必须有车队平均没有x的排放量不超过 0.07 g/英里。
单程制造商符合这个标准是在他们的汽车上使用催化转换器。本装置被放发动机和排气管之间。排气流通过催化转换器和暴露的催化剂。铂和铑的还原催化剂用于减少尾气中的 NOx排放浓度。当废气中的没有或没有2分子接触催化剂时,氮原子是抓走分子和催化剂作用下上举行。氧气释放,并形成 O2。在催化剂上的氮原子与催化剂对形式 N2日举行的另一个氮原子结合。
催化转换器有大幅减少的排放量没有x从汽车尾气 — — 最多减少 80%,正确执行时。然而,他们只工作时他们已经达到了一个相当高的温度。因此,当做汽车冷启动,催化转化器去除几乎没有没有x。它不是直到催化转化器达到更高的温度它从排气流有效去除无x 。催化柴油客车由于精益的条件下工作不工作。此外,柴油中的硫含量也将停用该催化剂。柴油发动机中的 NOx主要通过排气气再循环 (EGR) 阀,冷却燃烧气体的温度降低。其结果是,柴油车一般发出更多没有x比汽油车。
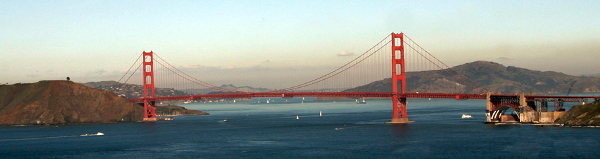
图 1。为在加利福尼亚的米色云烟雾特征着色银行在金门大桥后面。棕色着色是由于没有x在光化学烟雾中。
Procedure
1.亚硝酸盐 (没有2-) 股票溶液的制备
- 权衡了 1.500 g 纳米2并添加到 1-L 容量瓶。
- 稀释到使用 nanopure 水的标记。(检查蒸馏水从水龙头 — — 它可能包含足够的亚硝酸盐,干扰测量。)这将产生 1,000 µ g2-的 / 股票无解。
- 若要使 5.0 µ g2-的 / 无解,取 1 毫升的 1,000 微克没有2-的 / 解决方案和稀释至 200 毫升容量瓶中。
2.没有x指示液的制备
- 称出 5.0 g 的无水对氨基苯磺酸酸并添加到 1-L 容量瓶。
- 添加 nanopure 水 500 毫升。
- 添加冰醋酸 140 毫升。
- 对氨基苯磺酸酸溶解,用搅拌棒,搅拌的解决方案。这需要大约 30 分钟。
Results
Application and Summary
Tags
跳至...
此集合中的视频:

Now Playing
没有x在汽车尾气利用紫外-可见光谱法测定
Environmental Science
30.3K Views

树识别: 如何使用二分法的关键
Environmental Science
81.4K Views

树调查: 点本季度抽样方法
Environmental Science
49.5K Views

利用地理信息系统探讨城市林业
Environmental Science
12.7K Views

质子交换膜燃料电池
Environmental Science
22.2K Views

生物燃料: 生产乙醇从纤维素材料
Environmental Science
53.4K Views

测试基因改造食物
Environmental Science
90.1K Views

浊度和地表水中的总固体
Environmental Science
35.9K Views

表面的水中溶解氧
Environmental Science
56.0K Views

水生生态系统中养分
Environmental Science
39.0K Views

测量对流层臭氧
Environmental Science
26.5K Views

土壤用原子吸收光谱法分析铅
Environmental Science
125.9K Views

碳和氮的环境样品的分析
Environmental Science
29.6K Views

土壤养分分析: 氮、 磷和钾
Environmental Science
216.2K Views

在土壤中的蚯蚓种群的分析
Environmental Science
16.6K Views
版权所属 © 2025 MyJoVE 公司版权所有,本公司不涉及任何医疗业务和医疗服务。