
土壤养分分析: 氮、 磷和钾
Overview
资料来源: 玛格丽特工人和金伯利弗莱-Depaul 大学实验室
在这个实验中,三种土壤营养化学提取,结合基于颜色的试剂,然后分析了利用颜色测定土壤样品中的养分含量。
氮、 磷和钾是土壤肥料的主要组成部分。这些方法隔离每个从土壤养分到解决方案中,可以使用浊度和颜色来确定营养与土壤样品中的浓度进行了分析。了解目前浓度通知的一种营养缺乏或盈余用于支持植物生产的土壤中的环境科学家和也提供基本的生态系统的生物地球化学循环的一般洞察。
Principles
当化学分离土壤,营养素可以会检测到使用这种技术。氮和磷,通常发现的硝酸盐和磷酸盐,形式,提取出化学萃取剂,将绑定养分的兴趣了。一旦从土壤中提取,每种营养成分可以结合一种已知的试剂,导致营养液来更改为中的线性关系,用深色指示养分浓度增加养分特定颜色。若要分析每种营养成分的浓度,一种化学试剂将用于颜色随每个样本的颜色强度指示养分浓度增加。
在高和中程硝酸盐测试中,金属镉用来减少硝酸盐 (没有3-) 对亚硝酸盐 (没有2-)。镉购买的 Nitraver 5 (高和中等范围) 和 Nitraver 6 (小范围) 所载粉枕头。
没有3- + Cd + 2 H+ →无2- + Cd2 + + H2O
亚硝酸盐离子然后形成中间重氮盐与对氨基苯磺酸酸 (在酸性介质中载 NitraVer 5 粉) 反应。当加龙胆酸 (也载于 NitraVer 5),形成一种琥珀色的解决方案。 这种化合物的颜色强度水样的硝酸浓度成正比,和硝酸颜色比较器框采用连续硝酸盐琥珀色磁盘是可以量化。
磷、 钠钼和购买的 PhosVer 3 试剂粉末硫酸钾与可溶性活性磷酸盐形成一个复杂的磷钼酸盐的反应。
H2宝4- + 12 Na MoO24 + → PMo12O403-
抗坏血酸 (也载于 PhosVer 3 粉) 然后减少复杂,形成一种钼蓝颜色。蓝色被量化与连续磷酸蓝色磁盘使用磷酸颜色比较器框。
彩盒比较器使用本方法。此工具运行基于已知的颜色强度为 0-50 毫克之间每个浓度/L.在框中的颜色磁盘打开直到两个查看窗口中的颜色 (空白和样品) 的比赛。一旦颜色相匹配,相应的养分浓度 (mg/L) 将显示在一个单独的低窗口颜色比较器框上。这些箱足够健壮,用于在任何水平大学入门课程的学生,很容易可以运输作为检测试剂盒可以在取样位置使用农田土壤的一部分。这些方法允许基本营养课堂在实验室中测试而无需昂贵件可能不可用的设备。确保测试精度、 硝酸盐和磷酸盐标准溶液可以代替程序之前前往现场或开始在实验室中的土壤样品分析中的样品。
在钾测试中,钾离子结合形成白色沉淀四苯硼酸钾购买钾 3 试剂粉所载四苯硼钠。沉淀仍在悬浮在样品,造成浊度增加。
没有3- + Cd + 2 H+逮捕 (C6H5)4 + K+ → KB (C6H5)4 ++ Na
钾测量尺用来量化的转换为钾离子浓度的浊度。量油尺放置在样品,直至点不再是通过白色沉淀物可见的另一端有一个黑点。量油尺增量标记以指示规模再转换成钾浓度与转换图表的可见性。这种方法是使用最小的设备,可以被运输到室外采样站点和足够强劲,用于在任何水平大学入门课程的学生便宜的程序。
Procedure
1.提取氮 (硝酸盐没有3-)
- 打开平衡、 设置在上面,重船和零余额。
- 用一把铲子来衡量出的土壤 (干和筛) 10g 和转移到标记的 100 毫升烧杯。
- 称出 0.1 g 硫酸钙和把它转移到烧杯。
- 使用 25 毫升毕业缸措施 20 毫升的去离子的水和转移到烧杯。
- 对于每个氮土壤样本重复步骤 1.1-1.4。
- 用一根搅拌棒拌匀每个烧杯的内容。
- 安全表顶部钻井液振动筛的样品和摇 1 分钟。
2.磷、 钾的萃取
- 打开平衡、 设置称重船上,和零余额。
- 用一把铲子来衡量出的 2 g 的土壤 (干和筛) 和转移到标记的 100 毫升烧杯。
- 用 25 毫升的量筒来测量 20 毫升的土壤萃取剂在茶园 2 入气缸。转移到烧杯。
- 对于每个磷、 钾的样本重复步骤 2.1-2.3。
- 用一根搅拌棒拌匀每个烧杯的内容。
- 在桌上振动台和奶昔 5 分钟的安全样品。
3.营养萃取过滤-此步骤将执行所有三个分析物 (硝酸盐、 磷和钾)
- 安全真空喷射到漏斗软管的一端。
- 安全到侧臂的烧瓶软管的另一端。
- 通过一起捕捉缸装配漏斗和穿孔顶磁盘。通过橡胶塞子插入瓶确保顶部漏斗的顶部放置在顶部,侧臂烧瓶的组装的漏斗。
- 地方 1 清洁滤纸上的漏斗。
- 打开真空射流。
- 慢慢地倒入漏斗,允许提取物排从土壤和成漏斗瓶底土壤提取液。
- 把筛选提取物倒进一个新的标签上写的 50 毫升烧杯。如是,将分析此滤液。
- 删除漏斗、 丢弃过滤纸,和冲洗漏斗和烧瓶用去离子水。使用空气射流干漏斗和烧瓶。
- 对于每个土壤样品重复步骤 3.3-3.7。
4.样品分析与硝酸的颜色比较
- 为空白的样本和查看管"B"的另一种颜色标签查看管一种颜色"S"。
- 彻底冲洗用去离子水这两个颜色查看管。摇管要删除剩余的冲洗水。
- 添加少量的样本提取物 (在准备步骤 1.1-1.7) 约 ¼ 英寸深、 查看管标记的颜色"S"。帽管有橡胶瓶塞并摇动它为 3 美国放弃此解决方案。
- 将样品提取物添加到既管,直到半月板是即使有 5 毫升马克管 (磨砂区域底部)。
- 将一个 NitraVer 5 粉枕头的内容添加到管明显的"S"。帽子和精确的一分钟大力摇管。
- 管"S"和"B"入到比较器管"B"立即置于管"S"在里面和外面孔孔。
- 等待 5 分钟,然后容纳一个光源的颜色比较器。旋转圆盘,直到管"B"的窗口中的颜色匹配管"S"窗口中的颜色。记录显示的颜色比较器框下部窗口中的浓度值 (毫克/升)。
- 对于所有复制重复步骤 4.1-4.7 和记录平均。
- 对于所有的硝酸盐样品重复步骤 4.8。
5.样品分析与磷酸的颜色比较
- 使用 2.5 毫升滴管,2.5 毫升的过滤的样品提取液 (在步骤 2.1-2.6) 添加 25 毫升的量筒。
- 稀释至 25 毫升马克用去离子水,塞,帽和反相混合。
- 为空白的样本和查看管"B"的另一种颜色标签查看管一种颜色"S"。
- 彻底冲洗用去离子水这两个颜色查看管。摇管要删除剩余的冲洗水。
- 添加少量的稀释液约 ¼"深到颜色查看管明显的"S"。帽管有橡胶瓶塞,摇了几秒钟然后丢弃此解决方案。
- 将样品提取物添加到既管,直到半月板是即使有 5 毫升马克管 (磨砂区域底部)。
- 将一个 PhosVer 3 粉枕头的内容添加到"S"管。帽和一分钟大力摇管。
- 管"S"和"B"入到比较器管"B"立即置于管"S"在里面和外面孔孔。
- 3 分钟后完成一步 5.8,容纳一个光源颜色比较器。旋转圆盘,直到管"B"的窗口中的颜色匹配管"S"窗口中的颜色。在框中的下方显示区域,颜色磁盘将同时显示与选择的颜色强度对应的浓度值。记录显示在窗口中的浓度值。
- 对于所有复制重复步骤 5.1-5.10 和记录平均。
- 对于所有的磷样品重复步骤 5.10。
6.试剂加法和钾含量的分析
- 使用 1 毫升滴管,将 3 毫升的钾样品提取液 (在步骤 2.1-2.6) 添加到 25 毫升缸。
- DI 水加到 21 毫升马克缸上。坚决帽的油缸与橡胶瓶塞,颠倒混合。
- 添加一个钾 2 试剂粉枕头到缸。
- 将 3 毫升的碱性 EDTA 溶液添加到气缸。
- 盖缸和反转几次混合。允许解决方案站 3 分钟。
- 添加一个钾 3 试剂粉枕头的内容。
- 坚定地盖缸和摇大力为 10 s。
- 允许站立 3 分钟,白浊随着解决方案。
- 同时进入缸直往下看,慢慢地插入钾试纸垂直解决方案直至从气缸不再可见的黑点。
- 在那个位置持有量油尺和滚筒旋转,因此它可以在量油尺上看到的规模。在规模上量油尺的表面外观。记录上样品表面的交汇试纸规模的量油尺规模的数字。
- 对所有的复制和平均重复 6.1-6.10。对于所有的钾样品重复 6.11。
- 请参阅钾转换表测定土壤样品中的钾浓度。找到左边栏阅读量油尺并记录相应的 mg/L 浓度对右边一列。
Results
每个营养分析会导致集中报道毫克/升。
硝酸盐和磷酸盐的浓度将确定与颜色比较器框并将结果显示在窗口中。
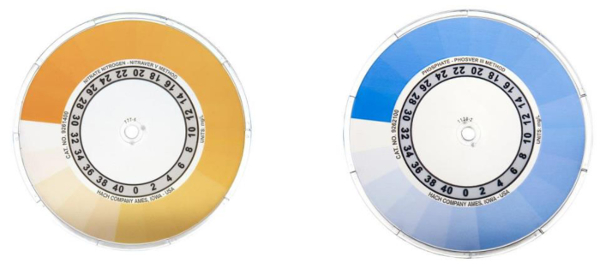
图 1。示例颜色磁盘为硝酸盐 (左) 和磷酸 (右) 比较器彩盒。颜色的强度是磁盘的外边缘上养分浓度 (mg/L),对磁盘的内缘。
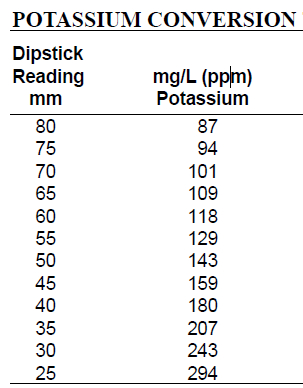
表 1。钾转换表用于转换试纸钾读入毫克/升。找到左边栏阅读量油尺并记录相应的 mg/L 浓度对右边一列。
| 氮素 | 磷 | 钾 | |
| 在 ppm 的营养级别范围 | |||
| 低 | 0-15 | 0-25 | 0-60 |
| 介质 | 15-30 | 25-50 | 60-100 |
| 高 | 30 + | 50 + | 100 + |
表 2。营养范围按类别排列的表。
Application and Summary
确定为硝酸盐、 磷酸盐和钾养分浓度可以揭示土壤如何运作的问候其预期用途和养分都通过土壤骑自行车出行。养分的测试,测试的所有营养素提供平均养分含量 (mg/L) 的一份报告。 在农业设置,知道的养分浓度可以帮助食品生产者知道什么时候该施肥,多少要添加,和营养需要补充和金额又是多少。一贯的高氮土壤,例如,将利于氮要求的作物,如大豆和玉米的生长。高氮水平也是开花植物尤其是有用的因为氮是必需的任何植物的绿色部分。高氮水平可以抑制开花然而,如果他们仍然高于磷水平。磷控制开花植物中的,是重要的任何植物生产涉及花或果植物和磷经常添加到土壤或直接植物花期和果期生命周期阶段,以提高农业产量在作物面积和单株果树生产的增加的数量之前和期间。钾被参与催化许多化学反应支持包括干旱容忍和水分调节植物生活所需。低钾土壤可能需要进行灌溉,如果土壤改良是不可能。营养盐浓度也可以告知的营养素缺乏症或盈余会有害植物的生长。 如果营养太高,可以进行修订以降低盈余,如添加覆盖或翻耕土壤。如果营养素是太低,不足以支持工厂生产,施肥可以用于添加营养物质在特定农作物所需的数额。低营养土也可能更适用于使用对土地管理者,为娱乐或发达 (铺设的路面或建筑) 空格。
Tags
跳至...
此集合中的视频:

Now Playing
土壤养分分析: 氮、 磷和钾
Environmental Science
216.2K Views

树识别: 如何使用二分法的关键
Environmental Science
81.4K Views

树调查: 点本季度抽样方法
Environmental Science
49.5K Views

利用地理信息系统探讨城市林业
Environmental Science
12.7K Views

质子交换膜燃料电池
Environmental Science
22.2K Views

生物燃料: 生产乙醇从纤维素材料
Environmental Science
53.4K Views

测试基因改造食物
Environmental Science
90.1K Views

浊度和地表水中的总固体
Environmental Science
35.9K Views

表面的水中溶解氧
Environmental Science
56.0K Views

水生生态系统中养分
Environmental Science
39.0K Views

测量对流层臭氧
Environmental Science
26.5K Views

没有x在汽车尾气利用紫外-可见光谱法测定
Environmental Science
30.3K Views

土壤用原子吸收光谱法分析铅
Environmental Science
125.9K Views

碳和氮的环境样品的分析
Environmental Science
29.6K Views

在土壤中的蚯蚓种群的分析
Environmental Science
16.6K Views
版权所属 © 2025 MyJoVE 公司版权所有,本公司不涉及任何医疗业务和医疗服务。