
색상 애프터이미지
Overview
출처: 조나단 플롬바움 연구소 -존스 홉킨스 대학
인간의 색 시야가 인상적입니다. 정상적인 색상 비전을 가진 사람들은 수백만 개의 개별 색조를 구별 할 수 있습니다. 가장 놀랍게도,이 능력은 매우 간단한 하드웨어로 달성된다.
인간의 색 시력의 힘의 일부는 인간의 두뇌에 있는 공학의 영리한 비트에서 옵니다. 색상 인식은 '상대 시스템'으로 알려진 것에 의존합니다. 이것은 자극의 한 종류의 존재가 다른 의 부재에 대한 증거로 취급된다는 것을 의미하고, 그 반대의 경우도 마찬가지입니다. 한 종류의 자극의 부재는 다른 종류의 존재에 대한 증거로 취합니다. 특히 인간의 뇌에는 청색광이 존재한다는 신호를 받을 때, 또는 황색 빛을 암시하는 신호를 받지 못하면 둘 다 발사하는 세포가 있다. 마찬가지로, 노란색또는 파란색의 부재가있는 상태에서 발사 되는 세포가 있다. 따라서 파란색과 노란색은 한 차원으로 상대 값으로 처리되며 카르테시안 평면의 한 축에서 음수 값과 양수 값으로 간주될 수 있습니다. 자극이 해당 축에 음수 값을 갖는 것으로 특징지어지면 양수 값도 가질 수 없습니다. 따라서 노란색으로 특징 지어진 경우 파란색으로 특성화 될 수도 없습니다. 마찬가지로, 녹색과 빨간색 (또는 정말, 마젠타)은 다른 상대 치수를 차지합니다. 인간의 뇌에는 하나 또는 다른 사람의 부재의 존재에 반응 하는 세포가 있다. 그림 1과 2는 카르테시안 용어의 색상 불투명도를 설명합니다.
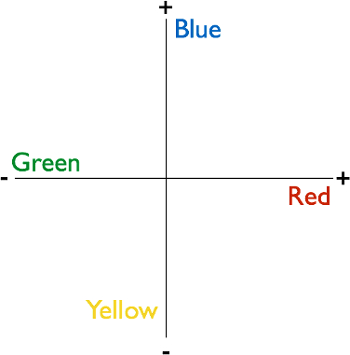
그림 1. 상대 색상 치수. 인간의 뇌는 상대 치수 시스템을 사용하여 색상을 처리합니다. 이 기체 평면은 파란색과 노란색이 한 축을 차지하고 있으며, 이는 단순히 긍정적이거나 음수로 생각할 수 있으며 빨간색과 녹색이 다른 축을 차지한다고 생각할 수 있습니다. 시스템의 결과는 뇌가 다른 사람의 부재를 나타내는 것으로 일부 색상의 존재를 처리하고, 그 반대의 경우도 마찬가지입니다. 모든 인식 가능한 색상은 상대 공간에서 포인트를 차지합니다.
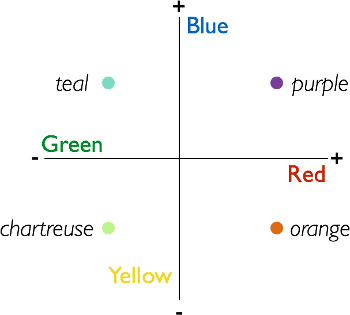
그림 2. 모든 인식 가능한 색상은 상대 공간에서 포인트를 차지합니다. 여기에 는 상대 공간의 두 차원 각각에 무색 값이 있는 색상의 예가 있습니다.
1878년 Ewald Hering이 과학자들이 뇌 자체를 이미징하기 위한 기술에 접근하기 전에도 색 의 불투명도가 발견된 한 가지 방법은 색 후이미지로 알려진 환상을 통해서입니다. 애프터 이미지는 오늘날에도 인간의 색 인식의 상대적 특성을 보여주고 연구하기 위해 사용됩니다.
이 비디오는 색 후이미지 환상을 만드는 방법과 인간 관찰자로부터 주관적인 지각 응답을 수집하는 간단한 방법을 보여줍니다.
Procedure
1화 자극
- 슬라이드 편집기에서 빈 흰색 슬라이드를 엽니다(PowerPoint 또는 기조와 같은 소프트웨어가 충분함).
- 셰이프 도구를 사용하여 색상 채우기가 없는 두 개의 똑같이 크기의 별두 개만 얇은 검은색 윤곽선으로 만듭니다. 슬라이드에 수직으로 중앙을 배치하고 양쪽(왼쪽 및 오른쪽)에 배치합니다.
- 작은 검은색 디스크를 별 사이에 슬라이드 중앙에 놓습니다. 고정 지점입니다.
- 이제 이 흑백 슬라이드의 복사본을 만듭니다. 그것의 두 번째 사본은 애프터 이미지 자극의 두 번째 슬라이드가 될 것입니다. 두 개의 동일한 슬라이드 중 첫 번째 슬라이드를 선택하여 첫 번째 슬라이드를 만들기 위해 지금 돌립니다.
- 왼쪽의 별을 선택하고 밝은 파란색으로 균일하게 채웁니다. 오른쪽에 있는 별을 선택하고 밝은 노란색으로 균일하게 채웁니다.
- 자극이 준비되었습니다. 첫 번째 슬라이드는 색상이어야 하며 두 번째 슬라이드는 완전히 검은색과 흰색이어야 합니다. 그림 3은 첫 번째 슬라이드의 모양을 표시하고 그림 4는 두 번째 슬라이드를 표시합니다.

그림 3. 슬라이드 #1 2 슬라이드 색상 애프터 이미지. 애프터 이미지 쌍의 첫 번째 슬라이드는 색상입니다. 가운데의 어두운 디스크는 고정 점입니다.

그림 4. 2슬라이드 색상 후면의 #2 슬라이드합니다. 애프터 이미지 쌍의 두 번째 슬라이드는 흑백입니다. 그러나 관찰자는 프레임에있는 객체의 흰색 채우기 내부의 환상 색상을 인식합니다 (이 경우 별).
- 동일한 절차에 따라 조사를 위해 추가 자극을 합니다. 예를 들어 한쪽에 빨간색 별이 있는 별과 다른 쪽에는 녹색 별이 있는 별을 만듭니다. 그런 다음 한쪽에 녹색 별과 다른 쪽은 파란색 별이 있는 별을 만듭니다. 다른 색상도 사용할 수 있습니다.
- 각 자극은 흑백으로 동일한 슬라이드 뒤에 색상 슬라이드를 포함해야합니다. 그림 5에서는 색상 애프터이미지를 유도하기 위한 추가 슬라이드 쌍의 두 가지 예를 보여 주겠습니다.
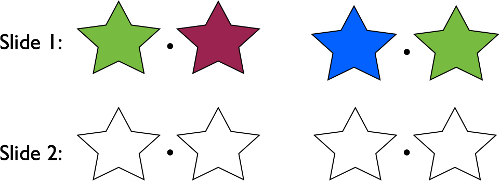
그림 5. 색상 애프터 이미지를 유도하기 위한 슬라이드의 두 가지 추가 예입니다. 각 쌍(위쪽 행)의 첫 번째 슬라이드는 항상 색상입니다. 각 쌍(아래쪽 행)의 두 번째 슬라이드는 항상 흑백으로 표시됩니다.
2. 환상을 생성
- 누군가가 색 애프터 이미지 환상을 경험하게하려면 컴퓨터 모니터 앞에 앉습니다.
- 색상 슬라이드 중 하나를 로드합니다(예:파란색과 노란색 별이 있는 슬라이드).
- 관찰자에게 화면 중앙에 있는 검은 색 디스크에 고정하고 눈을 움직이지 않도록 요청하십시오.
- 10s를 계산한 다음 슬라이드를 앞으로 진행하여 흑백 슬라이드가 색상을 대체합니다.
- 참가자에게 고정을 계속 유지하도록 지시합니다. 그들은 흰색 별이 이전에 그들을 채운 사람들의 상대 색상으로 채워진 것으로 보아야합니다. 그래서, 이전 블루 스타는 노란색으로 보일 것입니다, 이전 노란색 하나는 파란색 보일 것이다. 도 6은 첫 번째 슬라이드의 색상과 인식될 환상적 색상 간의 관계를 스키마화합니다.
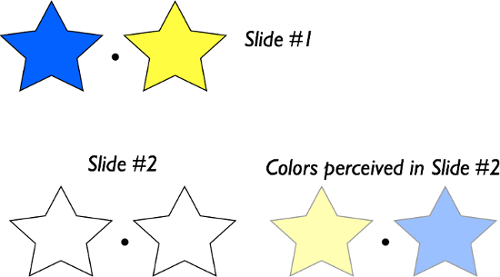
그림 6. 특정 슬라이드 쌍과 관련하여 인식된 일러스트 컬러. 슬라이드 #1 왼쪽 별은 파란색이고 노란색 별은 노란색입니다. 슬라이드 #2 실제로 흑백입니다. 그러나 관찰자가 슬라이드 #1 고정 한 후 로깅 할 때 슬라이드 #2 환상적 인 색상으로 인식됩니다. 특히, 별은 전에 그들을 채우는 것들로부터 상대 색상으로 채워져 표시되므로 왼쪽 별은 노란색으로 인식되고 오른쪽 별은 파란색으로 인식됩니다.
- 관찰자가 눈을 움직이면 환상이 빠르게 사라집니다.
- 참고, 그것은 자신의 자신에이 작업을 수행 하기 쉽습니다., 그리고 그것은 작동.
3. 데이터 수집
- 많은 시각적 환상과 마찬가지로, 효과는 현상학적으로 두드러지며 거의 모든 사람들이 경험합니다. 따라서 정량적 데이터는 주로 어떤 경험을 하는지 확인하는 역할을 합니다.
- 데이터를 수집하는 간단한 기술은 두 번째 슬라이드에 흰색 영역에 X를 한 쌍의 슬라이드에 포함하고 관찰자가 선택할 수 있는 색상 옵션 집합을 제공하는 것입니다.
- 관찰자가 X가 배치된 위치를 인식하는 색상 옵션을 선택하는 작업이 작업입니다. 도 7은 실험의 한 시험에서 이벤트 시퀀스를 나타낸다.
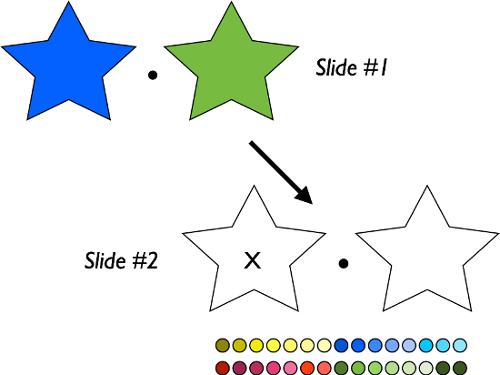
그림 7. 색상 애프터 이미지 실험의 단일 평가판에서 이벤트 순서입니다. 관찰자는 슬라이드 #1 가운데 디스크에 고정됩니다. 10s 후, 실험자는 슬라이드 #2 앞으로 진행합니다. 참가자의 임무는 'X'의 위치에서 인식하는 색상과 가장 일치하는 표시된 옵션 중에서 색상을 선택하는 것입니다.
- 실험의 전체 버전을 실행하려면 여러 다른 슬라이드 쌍을 사용합니다. 실험의 각 시험 동안 두 번째 슬라이드의 개체 중 하나의 다른 부분에 X를 배치합니다.
- 10-20 시험을 가진 실험에 5-10 참가자를 실행합니다. 시험 슬라이드 #1 X의 위치에 있는 색상의 함수로 선택한 색상을 집계합니다. 즉, 흰색 배경의 X 위치에 있는 색상과 해당 위치에 있는 이전 색상과 관련이 있습니다. 이전에 는 해당 위치에서 '유도자 색상'이라고 하며 인식된 색상을 '후색'이라고 합니다.
Results
실험에서 각 유도자 색상에 대해 가장 자주 선택된 후색상을 식별합니다. 그림 8의것과 같이 결과를 시각화하는 테이블을 만듭니다.
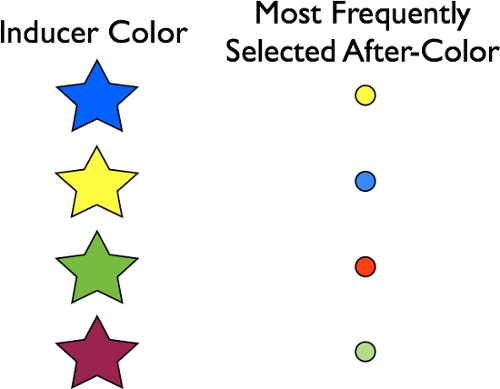
그림 8. 대표적인 결과. 유도자 색상의 함수로서 가장 자주 선택한 후 색상. 가장 자주 인식된 후 색상은 각 유도자의 상대 값입니다.
가장 자주 인식된 후 색상은 각각의 유도자 색상의 상대 값이어야 합니다. 그 이유는 인간의 뇌의 색에 민감한 세포가 공간적으로 매핑되기 때문에 피사체가 눈을 고정하는 위치에 따라 특정 공간에 반응하기 때문입니다. 일반적으로 사람들은 눈을 움직여 다른 세포가 외부 공간의 영역에 반응하는 부담을 공유합니다. 유도자 이미지(각 쌍의 슬라이드 #1)에 디스크를 고정함으로써, 관찰자는 동일한 세포 그룹이 외부 공간의 지정된 영역에 존재하는 포화 된 색상에 지속적으로 반응하도록 합니다. 고정 기간 동안 이러한 셀은 크게 반응합니다. 청색에 민감한 세포는 큰 청색 신호를 생성하고, 노란색에 민감한 세포는 큰 노란색 신호를 생성합니다. 흑백 이미지가 갑자기 표시되고 관찰자가 여전히 고정되어 있는 동안 이러한 셀은 더 이상 자극되지 않습니다- 이미지에 색이 없습니다. 그러나, 그들은 전에 너무 강하게 신호했기 때문에, 뇌의 나머지는 상대 색상의 존재를 신호로 활동의 그들의 갑작스런 부족을 해석. 청색 민감 세포에서 신호의 갑작스런 부족은 노란색의 존재로 해석된다. 노란 민감한 세포에서 신호의 갑작스런 부족은 파란색의 존재로 해석된다, 등등. 뇌는 색 세포의 활동이 없는 것을 상대 색의 존재를 나타내는 것으로 해석하며, 실제로 이 경우 활동이 부족하면 색이 전혀 없기 때문입니다. 뇌는 효과적으로 속여, 사람들이 상대 치수의 관점에서 색상을 구성하는 방법 때문에 어떤이없는 색상을 볼 수 있도록.
Application and Summary
색상 불투명도는 과학적 방법의 위대한 데모 중 하나입니다. 1800 년대에 연구원은 뇌 활동을 관찰 하는 능력 없이 인간의 두뇌에 있는 색상 표현의 본질을 추론할 수 있었습니다. 오늘, 사실, 색상 애프터 이미지는 색상 처리에 관련된 뇌 영역을 식별하기위한 유용한 도구가되었다. 원숭이에서 과학자들은 인간 관찰자에서 애프터 이미지를 생성하는 슬라이드의 원숭이 시퀀스를 보여 준 후, 그렇지 않을 때, 색상이 존재하는 것처럼 발사 뉴런을 기록했다. 1,2 유사하게, fMRI와 함께, 과학자들은 색상의 존재에 선택적으로 반응하는 시각적 피질의 영역을 발견하고, 그 색상이 슬라이드의 후이미지 쌍에 의해 유도 된 환상으로 인식 될 때 또한 반응.
References
- Zeki, S. Colour coding in the cerebral cortex: the reaction of cells in monkey visual cortex to wavelengths and colours. Neuroscience, 9(4), 741-765 (1983).
- Conway, B. R., & Tsao, D. Y. Color architecture in alert macaque cortex revealed by FMRI. Cerebral Cortex, 16(11), 1604-1613 (2006).
건너뛰기...
이 컬렉션의 비디오:

Now Playing
색상 애프터이미지
Sensation and Perception
11.2K Views

사각지대 및 지각 채우기 찾기
Sensation and Perception
17.4K Views

감각과 지각에 대한 관점
Sensation and Perception
11.9K Views

운동 으로 인한 실명
Sensation and Perception
7.0K Views

고무 손 환상
Sensation and Perception
18.6K Views

더 에임스 룸
Sensation and Perception
17.5K Views

부주의한 실명
Sensation and Perception
13.4K Views

공간 큐잉
Sensation and Perception
15.0K Views

주의적 깜박임
Sensation and Perception
16.1K Views

크롤 링
Sensation and Perception
5.8K Views

반전 된 얼굴 효과
Sensation and Perception
15.7K Views

맥거크 효과
Sensation and Perception
16.1K Views

눈에 띄는 차이점
Sensation and Perception
15.4K Views

지각 임계값을 찾기 위한 계단 절차
Sensation and Perception
24.4K Views

개체 대체 마스킹
Sensation and Perception
6.6K Views
Copyright © 2025 MyJoVE Corporation. 판권 소유