
성장 곡선: 군집 형성 단위 및 광학 밀도 측정을 사용하여 성장 곡선 생성
출처: 앤드류 J. 반 알스트1,리안논 M. 레베크1,나탈리아 마틴1,빅터 J. 디리타1
1 미생물학 및 분자 유전학학과, 미시간 주립 대학, 이스트 랜싱, 미시간, 미국
성장 곡선은 세균 성장 운동학 및 세포 생리학에 대한 귀중한 정보를 제공합니다. 그들은 우리가 박테리아가 변수 성장 조건에서 반응 하는 방법을 결정 하 고 주어진 된 박테리아에 대 한 최적의 성장 매개 변수를 정의 할 수 있습니다. 고풍스러운 성장 곡선은 지연, 지수, 고정 및 죽음 (1)의 네 단계를 통해 진행됩니다.

그림 1: 세균 성장 곡선. 배치 배양에서 자란 박테리아는 성장의 4 단계를 통해 진행: 지연, 지수, 고정, 그리고 죽음. 지연 단계는 박테리아가 급속한 세포 성장 및 분열을 할 수있는 생리적 상태에 도달하는 데 걸리는 기간입니다. 지수 단계는 DNA 복제, RNA 전사 및 단백질 생산이 모두 일정하고 빠른 속도로 발생하는 가장 빠른 세포 성장 및 분열의 단계입니다. 고정 된 단계 영양소 제한 및/또는 독성 중간 축적으로 인해 세균 성장의 둔화 및 고원을 특징으로합니다. 죽음의 단계는 세포 리시스가 가혹한 양분 제한결과로 생기는 단계입니다.
지연 단계는 박테리아가 급속한 세포 성장 및 분열을 할 수있는 생리적 상태에 도달하는 데 걸리는 기간입니다. 이 지연은 박테리아가 새로운 환경에 적응하는 데 시간이 걸리기 때문에 발생합니다. 필요한 세포 성분이 지연 단계에서 생성되면 박테리아는 DNA 복제, RNA 전사 및 단백질 생산이 모두 일정하고 빠른 속도(2)로 발생하는 기하급수적 성장 단계에 진입합니다. 기하급수상 동안 급속세포 성장 및 분열의 비율은 생성 시간 또는 두 배로 계산되며, 주어진 조건(1)에서 박테리아가 복제할 수 있는 가장 빠른 속도이다. 두 배로 하는 시간은 세균성 성장에 더 유리한 결정하기 위하여 다른 성장 조건을 비교하기 위하여 이용될 수 있습니다. 기하급수학적 성장 단계는 세균세포 생리학이 전체 인구(3)에 걸쳐 일관되기 때문에 가장 재현가능한 성장 상태입니다. 고정 단계는 세포 성장 고원이 있는 기하급수적 단계를 따릅니다. 고정 된 단계는 영양 고갈 및/또는 독성 중간체의 축적으로 인해 가져온다. 세균세포는 복제 및 세포 분열의 비율이 급격히 감소하더라도, 이 단계에서 살아남기 위하여 계속합니다. 마지막 단계는 심각한 영양소 고갈이 세포의 lysing에 이르게 죽음입니다. 가장 많은 정보를 제공하는 성장 곡선의 특징은 지연 단계의 지속 시간, 두 배의 시간 및 도달 한 최대 셀 밀도를 포함한다.
배치 배양에서 박테리아의 정량화는 식민지 형성 단위 와 광학 밀도 측정을 모두 사용하여 결정될 수 있다. 콜로니 성형 유닛(CFU)에 의한 열거는 세균세포 수의 직접적인 측정을 제공한다. CFU에 대한 측정의 표준 단위는 직렬 희석 및 확산 도금 기술에 의해 결정된 배양 (CFU/mL)의 1 mL 당 존재하는 컬터성 박테리아의 수입니다. 각 타임포인트에 대해, 배치 배양의 1:10 희석 계열이 수행되고 각 희석의 100 μl이 셀 스프레더를 사용하여 도금된다.
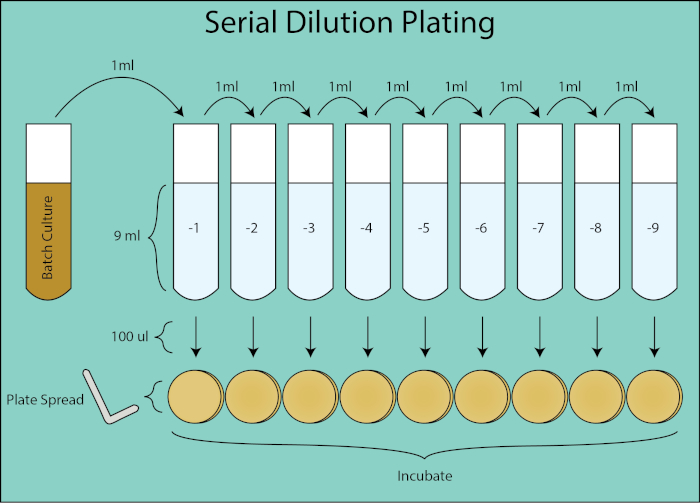
그림 2. 직렬 희석 도금 회로도. 일괄 처리 문화에서 희석 도금에 대한 일반적인 흐름. 배치 배양은 9ml PBS를 포함하는 후속 튜브로 이전 희석의 1mL을 전송하여 1:10으로 연이어 희석된다. 각 희석 관에서, 100 μl은 CFU/mL을 계산할 때 1mL 부피의1/10제부피이기 때문에 1:10의 추가 희석인 플레이트 스프레더를 사용하여 도금된다. 판은 복제 콜로니가 접시에 자면 배양되고 예매됩니다.
플레이트는 하룻밤 동안 배양되고 복제 식민지가 매립됩니다. 30-300콜로니를 성장시킨 희석 플레이트는 주어진 시점(4, 5)에 대한 CFU/mL을 계산하는 데 사용된다. 30 세 미만의 식민지 수의 스토차스 변화는 CFU / mL의 계산에 더 큰 오차가 적용되며 식민지 혼잡및 겹침으로 인해 300 개 이상의 식민지를 세는 것은 과소 평가 될 수 있습니다. 주어진 플레이트에 대한 희석 계수를 사용하여 배치 배양의 CFU는 각 타임포인트에 대해 계산할 수 있습니다.
광학 밀도는 분광광계를 사용하여 측정된 세균 세포 수의 즉각적인 근사치를 제공합니다. 광학 밀도는 1cm의 배양을 통과하고 포토다이오드 센서(6)에 의해 검출되는 광 입자의 흡수를 측정한 값입니다. 배양물의 광학 밀도는 미디어 블랭크와 관련하여 측정되고 세균밀도가 증가함에 따라 증가합니다. 세균 세포의 경우, 600 nm (OD600)의 파장이 일반적으로 광학 밀도 (4)를 측정 할 때 사용됩니다. 콜로니 성형 유닛 및 광학 밀도와 관련된 표준 곡선을 생성함으로써, 광학 밀도 측정은 배치 배양의 세균 세포 수를 쉽게 근사화하는 데 사용될 수 있다. 그러나, 이 관계는 세포가 모양을 바꾸고 CFU (7)와 관련되는 광학 밀도 판독에 영향을 미치는 매체에 세포 외 제품을 축적하기 시작으로 0.3 OD600초기에 악화되기 시작합니다. 이 오류는 고정 및 사망 단계에서 더 두드러집니다.
여기서, 대장균은 30시간(7)의 과정을 통해 루리아-베르타니(LB) 국물에서 37°C에서 재배됩니다. CFU/mL 및 광학 밀도 성장 곡선은 CFU에 대한 광학 밀도와 관련된 표준 곡선뿐만 아니라 생성되었습니다.
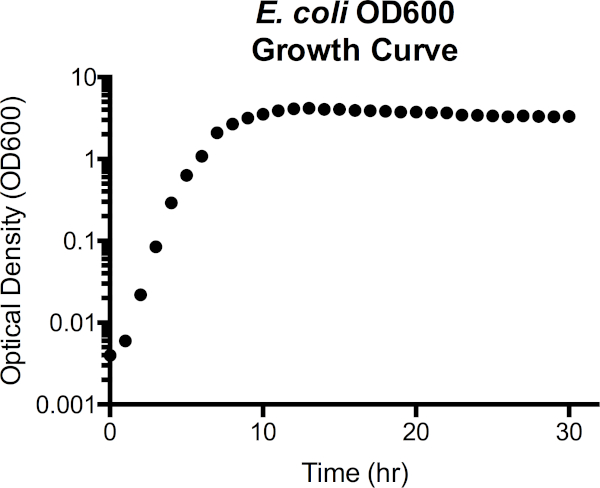
그림 3. 에체리치아 대장균 광학 밀도 600 nm 파장 (OD600) 성장 곡선. 광학 밀도 값은 멸균 LB 매체로 블랭킹한 후 분광계에서 직접 채취하였다. 1.0보다 큰 OD600 값은 100 μl 배양을 900 μl 의 신선한 LB와 결합하여 1:10을 희석하고, 다시 측정한 다음 10을 곱하여 OD600 값을 얻었다. 이 단계는 분광계의 측정정확도가 높은 세포 밀도에서 감소함에 따라 취해질 것이다. 곡선에서 지연 단계는 약 1h의 성장으로 확장되어 2h에서 7h로 기하급수적 단계로 전환한 다음 고원으로 전환하여 고정 단계에 진입합니다. 그러나 15시간 이후에 광학 밀도가 점차 감소하기 시작하면서 사망 단계는 뚜렷한 전환이 아닙니다.

그림 4. 밀리리터당 대장균 콜로니 형성 유닛(CFU/mL) 성장 곡선. 각 시점에 대한 CFU/mL 값은 30-300개의 콜로니를 포함하는 희석 플레이트로부터 계산되었다. 곡선에서 지연 단계는 약 2시간까지 확장되어 2h에서 7h로 기하급수적인 단계로 전환한 다음 고원으로 전환하여 고정 된 단계로 들어갑니다. 그러나 CFU/mL이 30시간 동안 2 x 10⁹의 피크에서 약 5 x 10⁸로 15시간 후에 점차 감소하기 시작하면서 사망 단계는 뚜렷한 전환이 아닙니다.
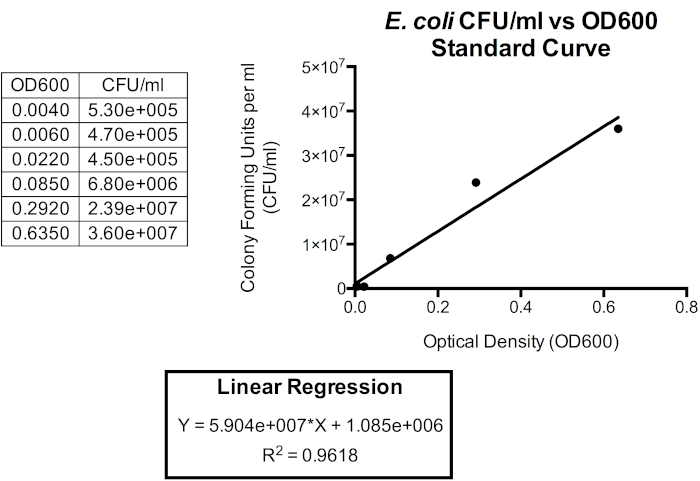
그림 5. CFU/mL 대 OD600의 표준화 곡선. 선형 회귀는 광학 밀도가 세균 세포 밀도를 근사화하는 데 사용될 수 있도록 이러한 단위를 관련시키는 데 사용될 수 있다. 광학 밀도는 배치 배양물의 CFU/mL의 즉각적인 근사치를 제공하고 즉시 근사치하는 데 사용될 수 있다. 여기서, OD600과 CFU/mL 사이의 관계가 1.0 OD600을 넘어서는 것이 덜 정확하기 때문에 처음 6개의 타임포인트만이 1.0 OD600에 도달한 직후 박테리아가 고정된 단계에 진입함에 따라 세포 모양과 세포외 제품이 축적되기 시작하면서 플롯된다. 매체의 세포 모양 및 세포외 제품의 변화는 광학 밀도 판독에 영향을 미치므로 광학 밀도와 배양에 있는 박테리아의 수 사이의 관계도 영향을 미칩니다.
두 배의 시간도 15분 19초로 결정되었습니다. 이 데이터에서, 대장균에 대한 LB의 성장 능력은 시각화되고 다른 미디어 또는 박테리아 사이의 비교에 사용될 수 있다.
1. 셋업
- 필수 실험실 재료: 액체 매체, 고형화 된 천막 매체, Erlenmeyer 플라스크, 15 mL 테스트 튜브, 인산염 완충식 식염수 (PBS), 세균 세포 스프레더, 70 % 에탄올 및 분광광계. 모든 솔루션과 유리 제품은 사용하기 전에 멸균되어야 합니다.
- 70%의 에탄올로 살균하여 워크스테이션을 준비합니다. 분젠 버너 근처에서 작업하여 미디어 오염을 방지합니다.
- 박테리아와 함께 작업 할 때, 적절한 개인 보호 장비와 무균 기술을 사용해야합니다. 세균 배양과 함께 작업할 때는 실험실 코트와 장갑이 필요합니다.
- 버퍼, 솔루션 및 시약용 레시피
- 인산염 완충식식염(PBS) (8).
- 루리아-베르타니 브로스 (LB) (9).
2. 프로토콜
- 미디어 준비
성장 곡선은 박테리아의 성장 운동 및 생리학을 이해하는 데 유용합니다. 그들은 우리가 박테리아가 가변 성장 조건에서 어떻게 반응하는지 결정하고 주어진 박테리아에 대한 최적의 성장 매개 변수를 정의 할 수 있습니다. 콜로니 형성 장치 와 광학 밀도 플롯 모두 지연 단계의 지속 시간을 묘사 하는 귀중 한 정보를 포함, 최대 세포 밀도 도달, 세균성 두 배 시간의 계산에 대 한 허용. 성장 곡선?...
- R. E. Buchanan. 1918. Life Phases in a Bacterial Culture. J Infect Dis 23:109-125.
- CAMPBELL A. 1957. Synchronization of cell division. Bacteriol Rev 21:263-72.
- Wang P, Robert L, Pelletier J, Dang WL, Taddei F, Wright A, Jun S. 2010. Robust growth of Escherichia coli. Curr Biol 20:1099-103.
- Goldman E, Green LH. 2015. Practical Handbook of Microbiology, Third Edition. CRC Press.
- Ben-David A, Davidson CE. 2014. Estimation method for serial dilution experiments. J Microbiol Methods 107:214-221.
- Koch AL. 1968. Theory of the angular dependence of light scattered by bacteria and similar-sized biological objects. J Theor Biol 18:133-156.
- Sezonov G, Joseleau-Petit D, D'Ari R. 2007. Escherichia coli physiology in Luria-Bertani broth. J Bacteriol 189:8746-9.

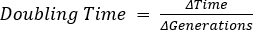
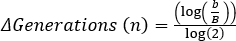 , 여기서 b = t2, B = 세대의 n = 수의 박테리아 수에서 박테리아의 수. 에서 파생 :
 건너뛰기...
이 컬렉션의 비디오:

Now Playing
성장 곡선: 군집 형성 단위 및 광학 밀도 측정을 사용하여 성장 곡선 생성
Microbiology
281.5K Views

위노그라드스키 칼럼 생성: 퇴적물 검체에서 미생물 종을 풍부하게하는 방법
Microbiology
124.6K Views

연속 희석 및 플레이팅: 미생물 나열
Microbiology
306.5K Views

농축 배양: 선택 및 차동 매체에서 호기성 및 혐기성 미생물 배양
Microbiology
129.3K Views

순수 배양 및 줄무늬 평판배양: 혼합 검체에서 단일 박테리아 군집 분리
Microbiology
163.1K Views

16S rRNA 시퀀싱: 박테리아 종 식별을위한 PCR 기반 기술
Microbiology
184.3K Views

항생 물질 감수성 시험: 두 항생제의 MIC 값을 결정하고 항생 시너지를 평가하기 위한 Epsilometer 검사
Microbiology
92.4K Views

현미경 및 염색: 그램, 캡슐 및 내생포자 염색
Microbiology
359.2K Views

플라크 분석: 플라크 형성 단위(PFU)로서 바이러스 역가를 결정하는 방법
Microbiology
183.9K Views

적응 염화칼슘 절차를 이용한 E.coli 세포의 형질변환
Microbiology
84.9K Views

접합: 공여 E.coli에서 수용 E.coli로 암피실린 내성을 전달하는 방법
Microbiology
36.4K Views

파지 형질도입: 공여 E.coli에서 수용 E.coli로 암피실린 내성을 전달하는 방법
Microbiology
27.5K Views
JoVE 소개
Copyright © 2025 MyJoVE Corporation. 판권 소유