
Aby wyświetlić tę treść, wymagana jest subskrypcja JoVE. Zaloguj się lub rozpocznij bezpłatny okres próbny.
Method Article
Deep and Spatially Controlled Volume Ablations using a Two-Photon Microscope in the Zebrafish Gastrula
W tym Artykule
Podsumowanie
Embryonic development requires large-scale coordination of cell motion. Two-photon excitation mediated laser ablation allows the spatially controlled 3-dimensional ablation of large groups of deep cells. In addition, this technique can probe the reaction of collectively migrating cells in vivo to perturbations in their mechanical environment.
Streszczenie
Morphogenesis involves many cell movements to organize cells into tissues and organs. For proper development, all these movements need to be tightly coordinated, and accumulating evidence suggests this is achieved, at least in part, through mechanical interactions. Testing this in the embryo requires direct physical perturbations. Laser ablations are an increasingly used option that allows relieving mechanical constraints or physically isolating two cell populations from each other. However, many ablations are performed with an ultraviolet (UV) laser, which offers limited axial resolution and tissue penetration. A method is described here to ablate deep, significant, and spatially well-defined volumes using a two-photon microscope. Ablations are demonstrated in a transgenic zebrafish line expressing the green fluorescent protein in the axial mesendoderm and used to sever the axial mesendoderm without affecting the overlying ectoderm or the underlying yolk cell. Cell behavior is monitored by live imaging before and after the ablation. The ablation protocol can be used at different developmental stages, on any cell type or tissue, at scales ranging from a few microns to more than a hundred microns.
Wprowadzenie
Cell-cell interactions play vital roles in development. Cells provide signals that their direct neighbors, or cells further away, can perceive, thereby influencing their fate and/or behavior. Many of these signals are chemical in nature. For instance, in the well-characterized induction events, one cell group produces diffusible molecules affecting the fate of another cell population1. Other signals, however, are mechanical; cells exert forces and constraints on their neighbors, which the neighbors perceive and respond to2.
One way of studying the importance of these cell-cell interactions in vivo is to eliminate some cells and observe subsequent development. Unfortunately, available techniques to remove or destroy cells are limited. Cells can be removed surgically3,4, using needles or small wires, but such treatments are invasive, not very precise, and usually performed under a stereomicroscope, preventing immediate imaging under a microscope. Furthermore, targeting deep cells implies piercing a hole in overlying tissues, creating unwanted perturbations. Genetically encoded photosensitizers, such as KillerRed, have been used to induce cell death via light illumination5. Photosensitizers are chromophores that generate reactive oxygen species upon light irradiation. Their main limitation is that they require long light illuminations (around 15 min), which may be difficult to achieve if cells are moving, and that they induce cell death through apoptosis, which is not immediate.
Finally, laser ablations have been developed and widely used in the past 15 years6,7,8,9,10,11,12. A laser beam is focused on the targeted cell/tissue. It induces its ablation through heating, photoablation, or plasma-induced ablation; the involved process depends on the power density and exposure time13. Most ablation protocols use UV lasers for their high energy. However, UV light is both absorbed and scattered by biological tissues. Thus, targeting deep cells requires a high laser power, which then induces damages in more superficial, out-of-plane tissues. This limits the use of UV lasers to superficial structures and explains their relatively low axial resolution. Non-linear optics (so-called two-photon microscopy) uses non-linear properties of light to excite a fluorophore with two photons of approximately half-energy in the infrared domain. When applied to ablations, this has three main advantages. First, the infrared light is less scattered and less absorbed than UV light by biological tissues14, allowing to reach deeper structures without increasing the required laser power. Second, the use of a femtosecond pulsed laser provides very high power densities, creating an ablation through plasma induction, which, contrary to heating, does not diffuse spatially15. Third, the power density inducing plasma formation is reached at the focal point only. Thanks to these properties, two-photon laser ablations can be used to precisely target deep cells without affecting the surrounding tissue environment.
Collective migrations are an excellent example of developmental processes in which cell-cell interactions are fundamental. Collective migrations are defined as cell migrations in which neighboring cells influence the behavior of one cell16. The nature of these interactions (chemical or mechanical) and how they affect cell migration can vary greatly and is often not entirely understood. The ability to remove cells and observe how this affects the others is critical in further unraveling these collective processes. A few years ago, we established — using surgical approaches — that the migration of the polster during zebrafish gastrulation is a collective migration17. The polster is a group of cells that constitutes the first internalizing cells on the dorsal side of the embryo18. These cells, labeled in green in the Tg(gsc:GFP) transgenic line, are located deep in the embryo, below several layers of epiblast cells. During gastrulation, this group leads the extension of the axial mesoderm, migrating from the embryonic organizer to the animal pole19,20,21,22,23 (Figure 1A). We established that cells require contact with their neighbors to orient their migration in the direction of the animal pole. However, better understanding the cellular and molecular bases of this collective migration involves removing some cells to see how this influences the remaining ones. We, therefore, developed ablations of large and deep volumes using a two-photon microscopy setup. Here, we demonstrate the use of this protocol to sever the polster in its middle and observe the consequences on cell migration by tracking nuclei labeled with Histone2B-mCherry.
Protokół
All animal work was approved by the Ethical Committee N 59 and the Ministère de l'Education Nationale, de l'Enseignement Supérieur et de la Recherche under the file number APAFIS#15859-2018051710341011v3. Some of the steps described below are specific to our equipment and software but could be easily adapted to different equipment.
1. Injection preparation
- Prepare 75 mL of 1% agarose solution in Embryo Medium (EM).
- Place the injecting mold in a 90 mm Petri dish and pour approximately 50 mL of agarose, enough for the mold to float. Let the agarose solidify and remove the injecting mold.
- Prepare an agarose-coated dish by pouring 1 mL of agarose in a 30 mm Petri dish.
- Prepare 4 µL of 30 ng/µL Histone2B-mCherry mRNA solution by diluting the stock solution in RNase-free water and keep on ice.
NOTE: Take care to wear gloves while manipulating mRNA to avoid RNase-mediated degradation. - Pull an injection needle from a capillary using the micropipette puller.
2. Embryo preparation
- Once fishes have laid eggs, collect, rinse, and harvest in a 90 mm Petri dish in EM. Place the embryos in a 28.5 °C incubator.
- Wait 20 min for the first cell to become visible.
- Transfer 30 embryos to the injection plate filled with EM. Squeeze embryos in the grooves using slightly blunt forceps and orient them with the animal pole up.
- Using a microloader tip, fill an injection needle with 2 µL of mRNA solution. Insert the needle in the capillary holder placed in a micro-manipulator connected with polytetrafluoroethylene (PTFE) tubing to an air injector.
- Under the stereomicroscope, carefully break the tip of the needle.
- Inject the mRNA solution in the 1-cell stage embryos by inserting the needle in the cell.
NOTE: The volume injected is approximately one-third of the cell volume. - Place back injected embryos in the 28.5 °C incubator.
3. Preparation of the two-photon microscope
NOTE: Two lasers are used in this protocol. One is used to image GFP (at 920 nm) and perform ablations (at 820 nm). It will be referred to as the green/ablation laser. The other is used at 1160 nm to image mCherry. It will be referred to as the red laser.
- Set the green/ablation laser to 820 nm (ablation wavelength) and the red laser to 1160 nm (mCherry excitation).
- Using movable mirrors on the optical path, align green/ablation and red laser beams both at the entry and exit of the scan head.
NOTE: This increases the laser beam focus and minimizes focal volume for excitation and ablation. - Measure the maximum power of the green/ablation laser at 820 nm under the objective. To do so, place the power meter under the objective, close the black chamber, set green/ablation laser power to 100%, and open the shutters. Compute the percentage of laser power needed to reach 300 mW.
- Set back the green/ablation laser to 920 nm (GFP excitation) and set the laser power to 7%. Set the red laser power to 15%.
- Activate epi-PhotoMultiplier Tubes (PMT) detectors for green and red lines; set green and red line PMT sensitivity to 65.
- Set the field of view to 400 x 400 µm, image resolution to 512 x 512 pixels, and scanning frequency to 800 Hz.
- Select 3D Timelapse Imaging mode. Then, create a folder and activate Autosave for data after each acquisition.
- Assemble the heating chamber and set it to 28 °C. Wait at least 10 min for the chamber and the objective to warm.
4. Mounting the embryo
- Under a fluorescence stereomicroscope, identify embryos at 70% epiboly that express GFP.
NOTE: Select embryos with a bright signal in the axial mesoderm and no background fluorescence for better imaging quality. - Transfer three to four selected embryos in the agarose coated dish (step 1.3) using a plastic Pasteur pipette and carefully dechorionate them using fine forceps.
NOTE: Dechorionated embryos are very delicate and will burst upon contact with air or plastic. - Pour 1 mL of 0.2% agarose in 1x penicillin-streptomycin EM in a small glass vial. Place the vial in a preheated 42 °C dry block heater.
NOTE: The following steps must be performed quickly to allow embryo orientation before agarose sets. - Transfer a dechorionated embryo in the 0.2% agarose glass vial using a fire-polished glass pipette. Take care not to add too much EM in the agarose to avoid diluting it. Discard the remaining EM from the pipette and aspirate the embryo back along with enough agarose to cover the slide of the glass bottom dish before the embryo falls out of the pipette.
- Blow the agarose and the embryo on the glass slide of the dish. Take care not to let the embryo touch the air or the plastic side of the dish. Next, fill the chamber around the glass slide with agarose.
- Use an eyelash to orient the embryo so that the targeted region is at the top (Figure 1B).
NOTE: When orienting embryos, take care to only touch the blastoderm, not the very fragile yolk. Agarose will set in around 1 min, depending on room temperature. - Wait ~5 min for the agarose to set completely, and then add a few drops of penicillin-streptomycin EM.
5. Locating the embryo and pre-ablation imaging
- Place the glass bottom dish under the objective in the heated chamber. Immerse the objective in penicillin-streptomycin EM and close the heated chamber.
- Move the slider to set the light path to oculars. Then, using oculars, fluorescent lamps, and stage control, find an embryo and set the focus to the surface of the embryo.
- Turn the fluorescence lamp off, set the light path to PMTs, and close the black chamber.
NOTE: Be careful to turn off all light sources in the black chamber as it might damage the PMTs. - Start live imaging and locate axial mesoderm. Adjust the green/ablation and red laser powers to have a good signal (i.e., between 1,000 and 20,000 photons per pixel for GFP expressing areas). Use the red channel to move the stage to the very top of the embryo and set this position as Z = 0.
- Choose a time-step of 1 min and a Z-step of 2 µm. A Z-course of 110 µm is sufficient to encompass the whole polster and is acquired in less than 1 min with these settings. Set the first slice 15 µm above the axial mesoderm (in the more superficial ectoderm).
NOTE: The polster moves along a curved line so that the bottom slice of the Z-stack should be set 30 µm deeper than the polster deepest position to accommodate its movement during the time-lapse imaging (Figure 1E). - Record 10-15 min of pre-ablation movie.

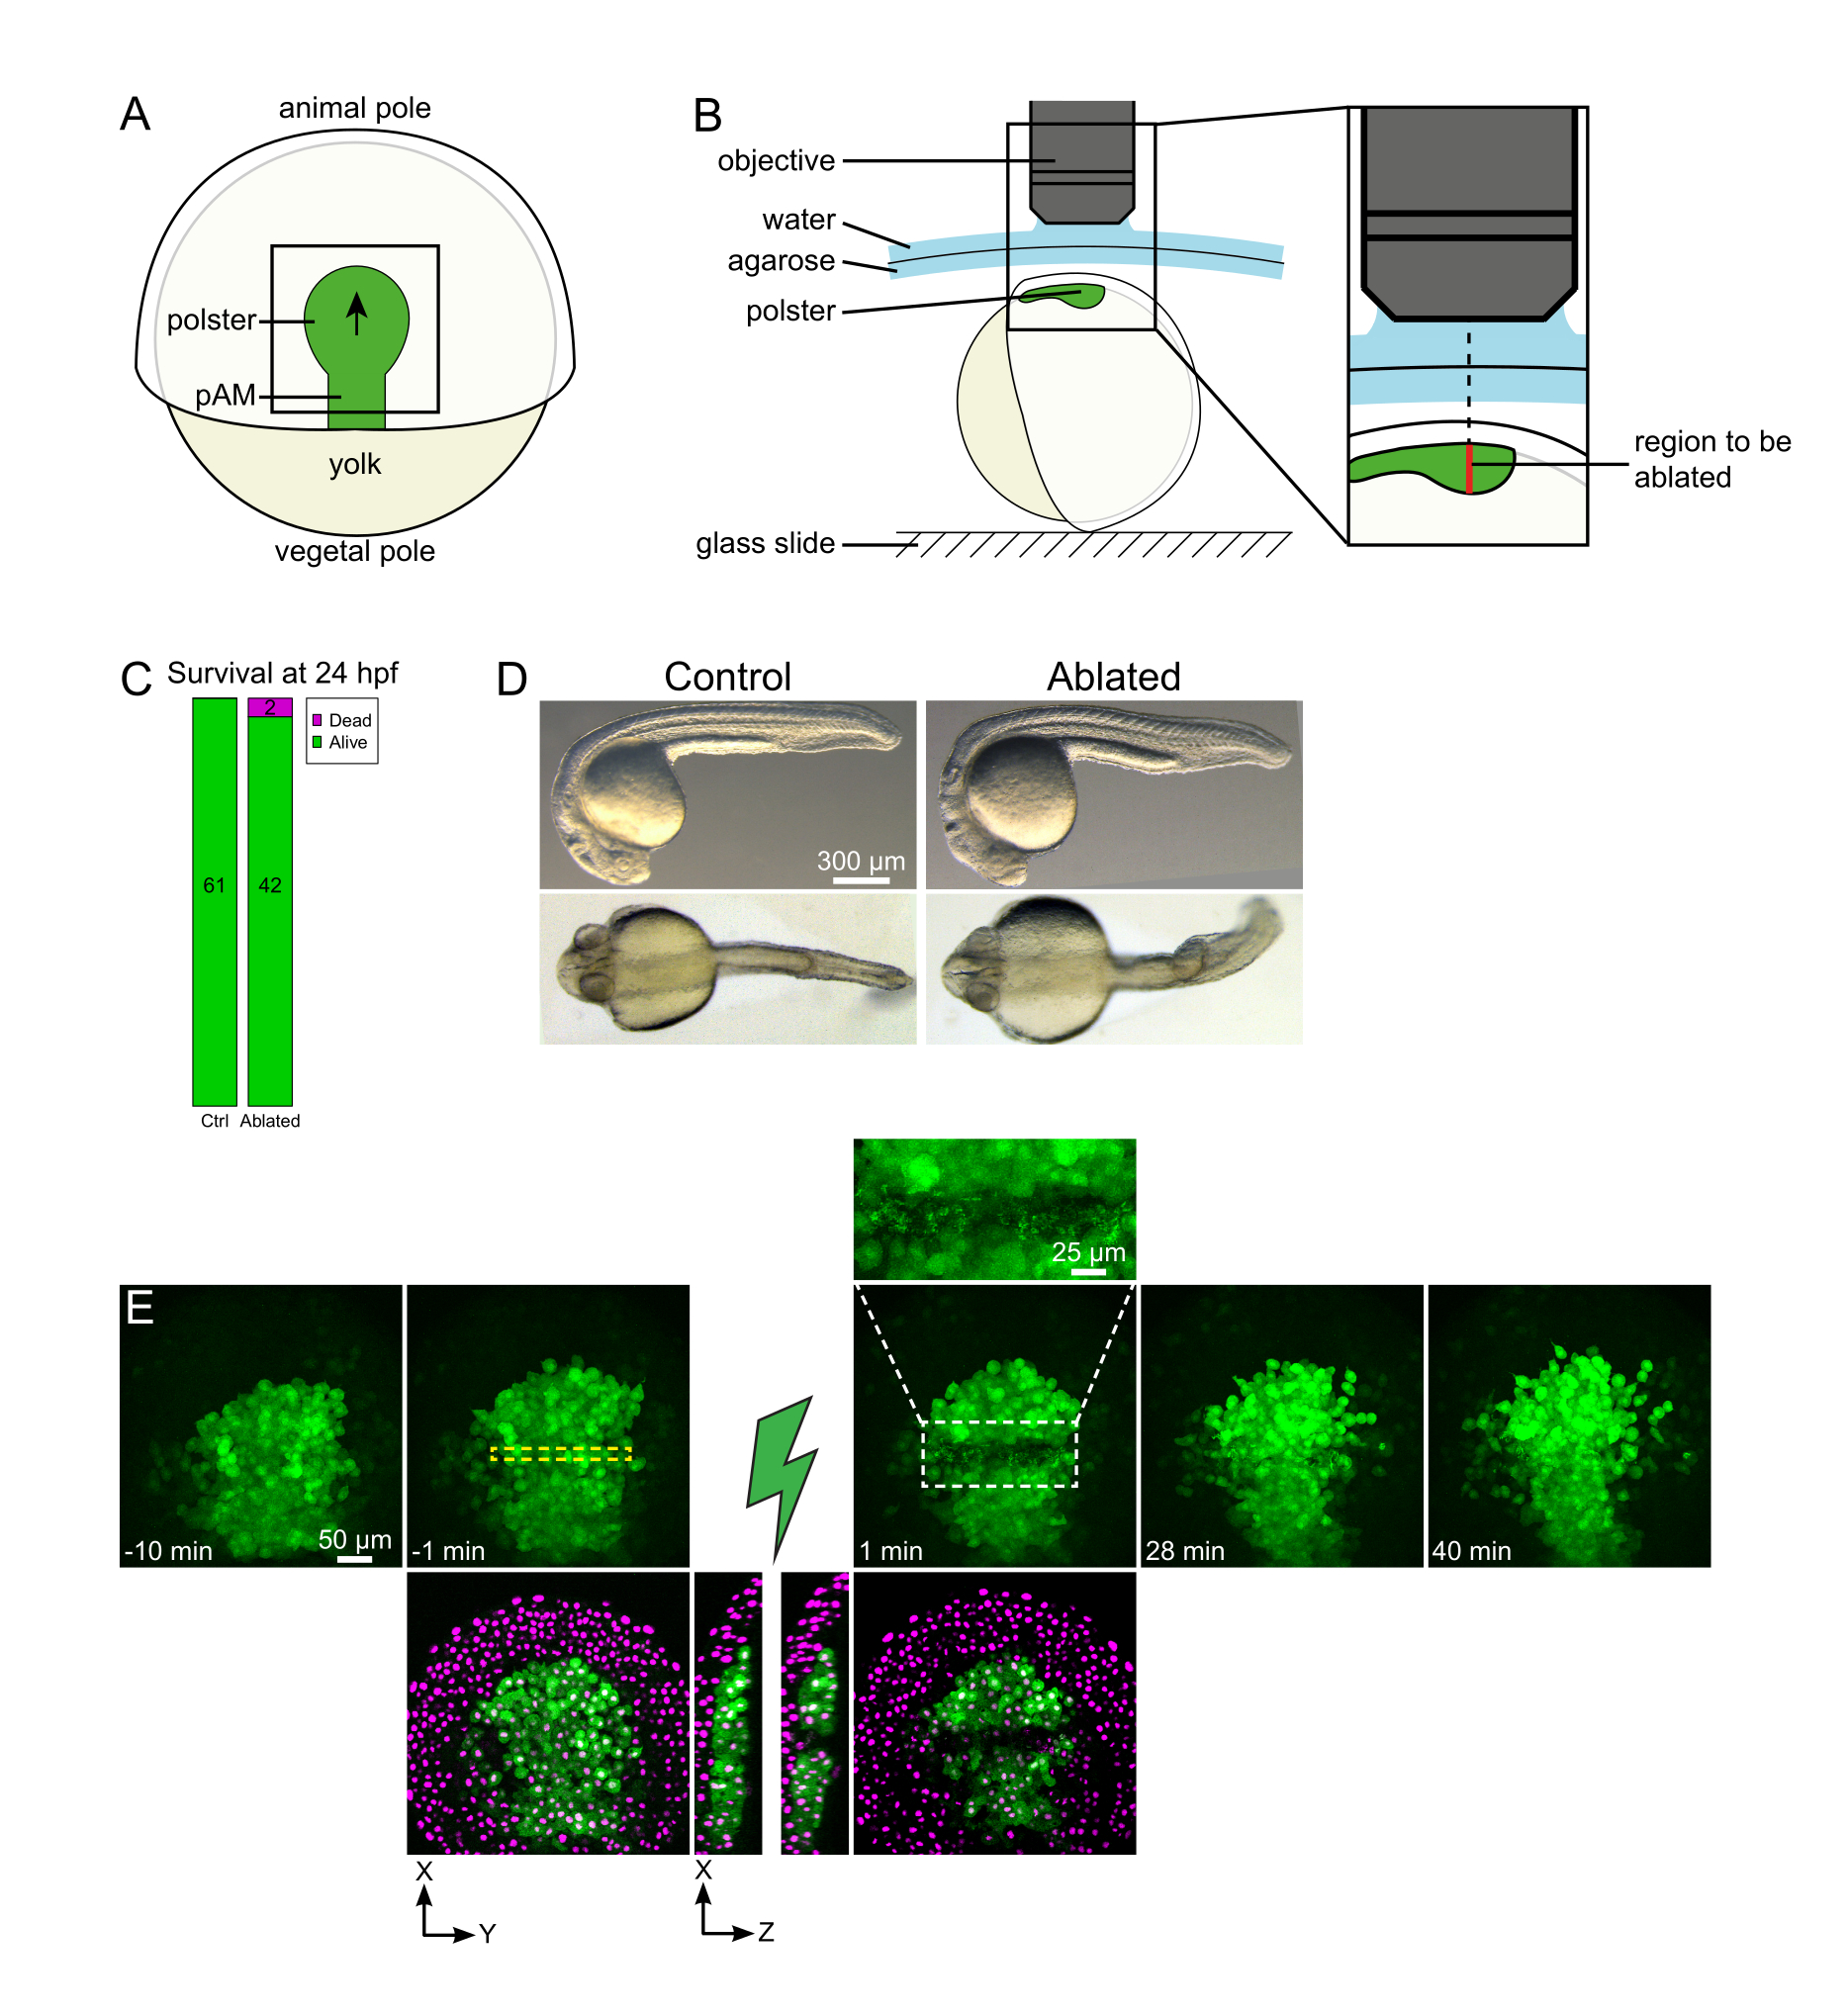
Figure 1: Successful outcome of laser ablations. (A) Scheme of a gastrulating embryo at 70% epiboly in dorsal view; pAM: posterior axial mesoderm; black arrow marks the direction of polster migration; black square indicates a typical field of view for ablations in the polster. (B) Scheme of embryo mounting for polster severing. Lateral view. The embryo is mounted such that the plane of the polster is perpendicular to the optical axis. (C) survival and (D) morphology of control and ablated embryos at 24 h post-fertilization. Scale bar is 300 µm. (E) Time sequence from laser ablation in the polster of a Tg(gsc:GFP) embryo expressing Histone2B-mCherry. Views with the green channel only are maximum projections. The close-up displays the ablated area containing cell debris. Views with green and red (displayed as magenta) channels are XY and XZ slices before and after ablation (the green lightning bolt represents ablation). XZ slices show that the overlying tissues (magenta nuclei without GFP expression) have not been affected by the ablation of underlying structures. The yellow dashed box corresponds to the ROI selected for laser ablation treatment. The scale bar is 50 µm in large views and 25 µm in the close-up. Please click here to view a larger version of this figure.
6. Target location and laser ablation
- Locate the polster contour on live imaging and, using the Electro-Optic Modulator Region of Interest (EOM ROI) tool, draw a 20 pixel (15 µm) large rectangle that spans the width of the polster. Place this rectangle in the middle of the polster (Figure 1E).
- Note the axial position of the highest and lowest planes containing polster cells. Ablations will be performed every 10 µm in between these two planes. Take care that the ROI does not overlap the yolk cell on any of these planes.
- Place the stage at the lowest Z position of the interval. Ablations must be performed bottom-up as debris absorb light.
- Set the green/ablation laser wavelength to 820 nm and set the Power Percentage to obtain an exit power of 300 mW (step 3.3).
- Set the Imaging Frequency to 200 Hz.
- Set green/ablation laser imaging EOM to 0 and select ROI-Treat mode.
- Turn on the EOM and set the treatment to start immediately (after 0 frame).
- Set the Imaging Mode to Timelapse and de-activate Autosave.
- Set the Time Step to Fast mode.
- Set the Number of Treatment Frames and Number of Frames to the value corresponding to the targeted depth (Table 1).
| Depth (µm) | Treatment frames |
| -30 | 1 |
| -35 | 1-2 |
| -40 | 1-2 |
| -45 | 2 |
| -50 | 2-3 |
| -55 | 3 |
| -60 | 3-4 |
| -65 | 4 |
| -70 | 4 |
| -75 | 4-5 |
| -80 | 4-5 |
| -85 | 5 |
| -90 | 5 |
| -95 | 5-6 |
| -100 | 6 |
| -105 | 6 |
Table 1: Suggested number of laser treatment frames as a function of targeted cell depth in the embryo (0 being the embryo's surface).
- Start imaging. The acquisition is black as the shutter to PMT closes during EOM treatment.
- Move up the stage to the next Z position of the list (step 6.2).
- Repeat steps 6.10 to 6.12 until the top of the polster is reached.
7. Post-ablation verification and imaging
- Set the green/ablation laser to 920 nm and 5% power. Set the green/ablation laser imaging EOM to 100 and select the Fullfield mode.
- Set the Imaging Frequency to 800 Hz. Turn EOM off.
- Go through the whole stack in live mode to check whether every plane has been ablated. If this is not the case, go back to step 6.2.
NOTE: Ablation sometimes induces a vertical shift of neighboring tissues so that the Z-stack might have to be redefined. - Set the Imaging Mode to 3D Timelapse and re-activate Autosave. Record 40-60 min of post-ablation movie.
- Check, in the post-ablation movie, whether the targeted cells were effectively ablated. Fluorescence recovery, or targeted cells occupying space and preventing follower cells from moving through, indicate that targeted cells were only photobleached and not ablated (Figure 1E and Figure 2A).

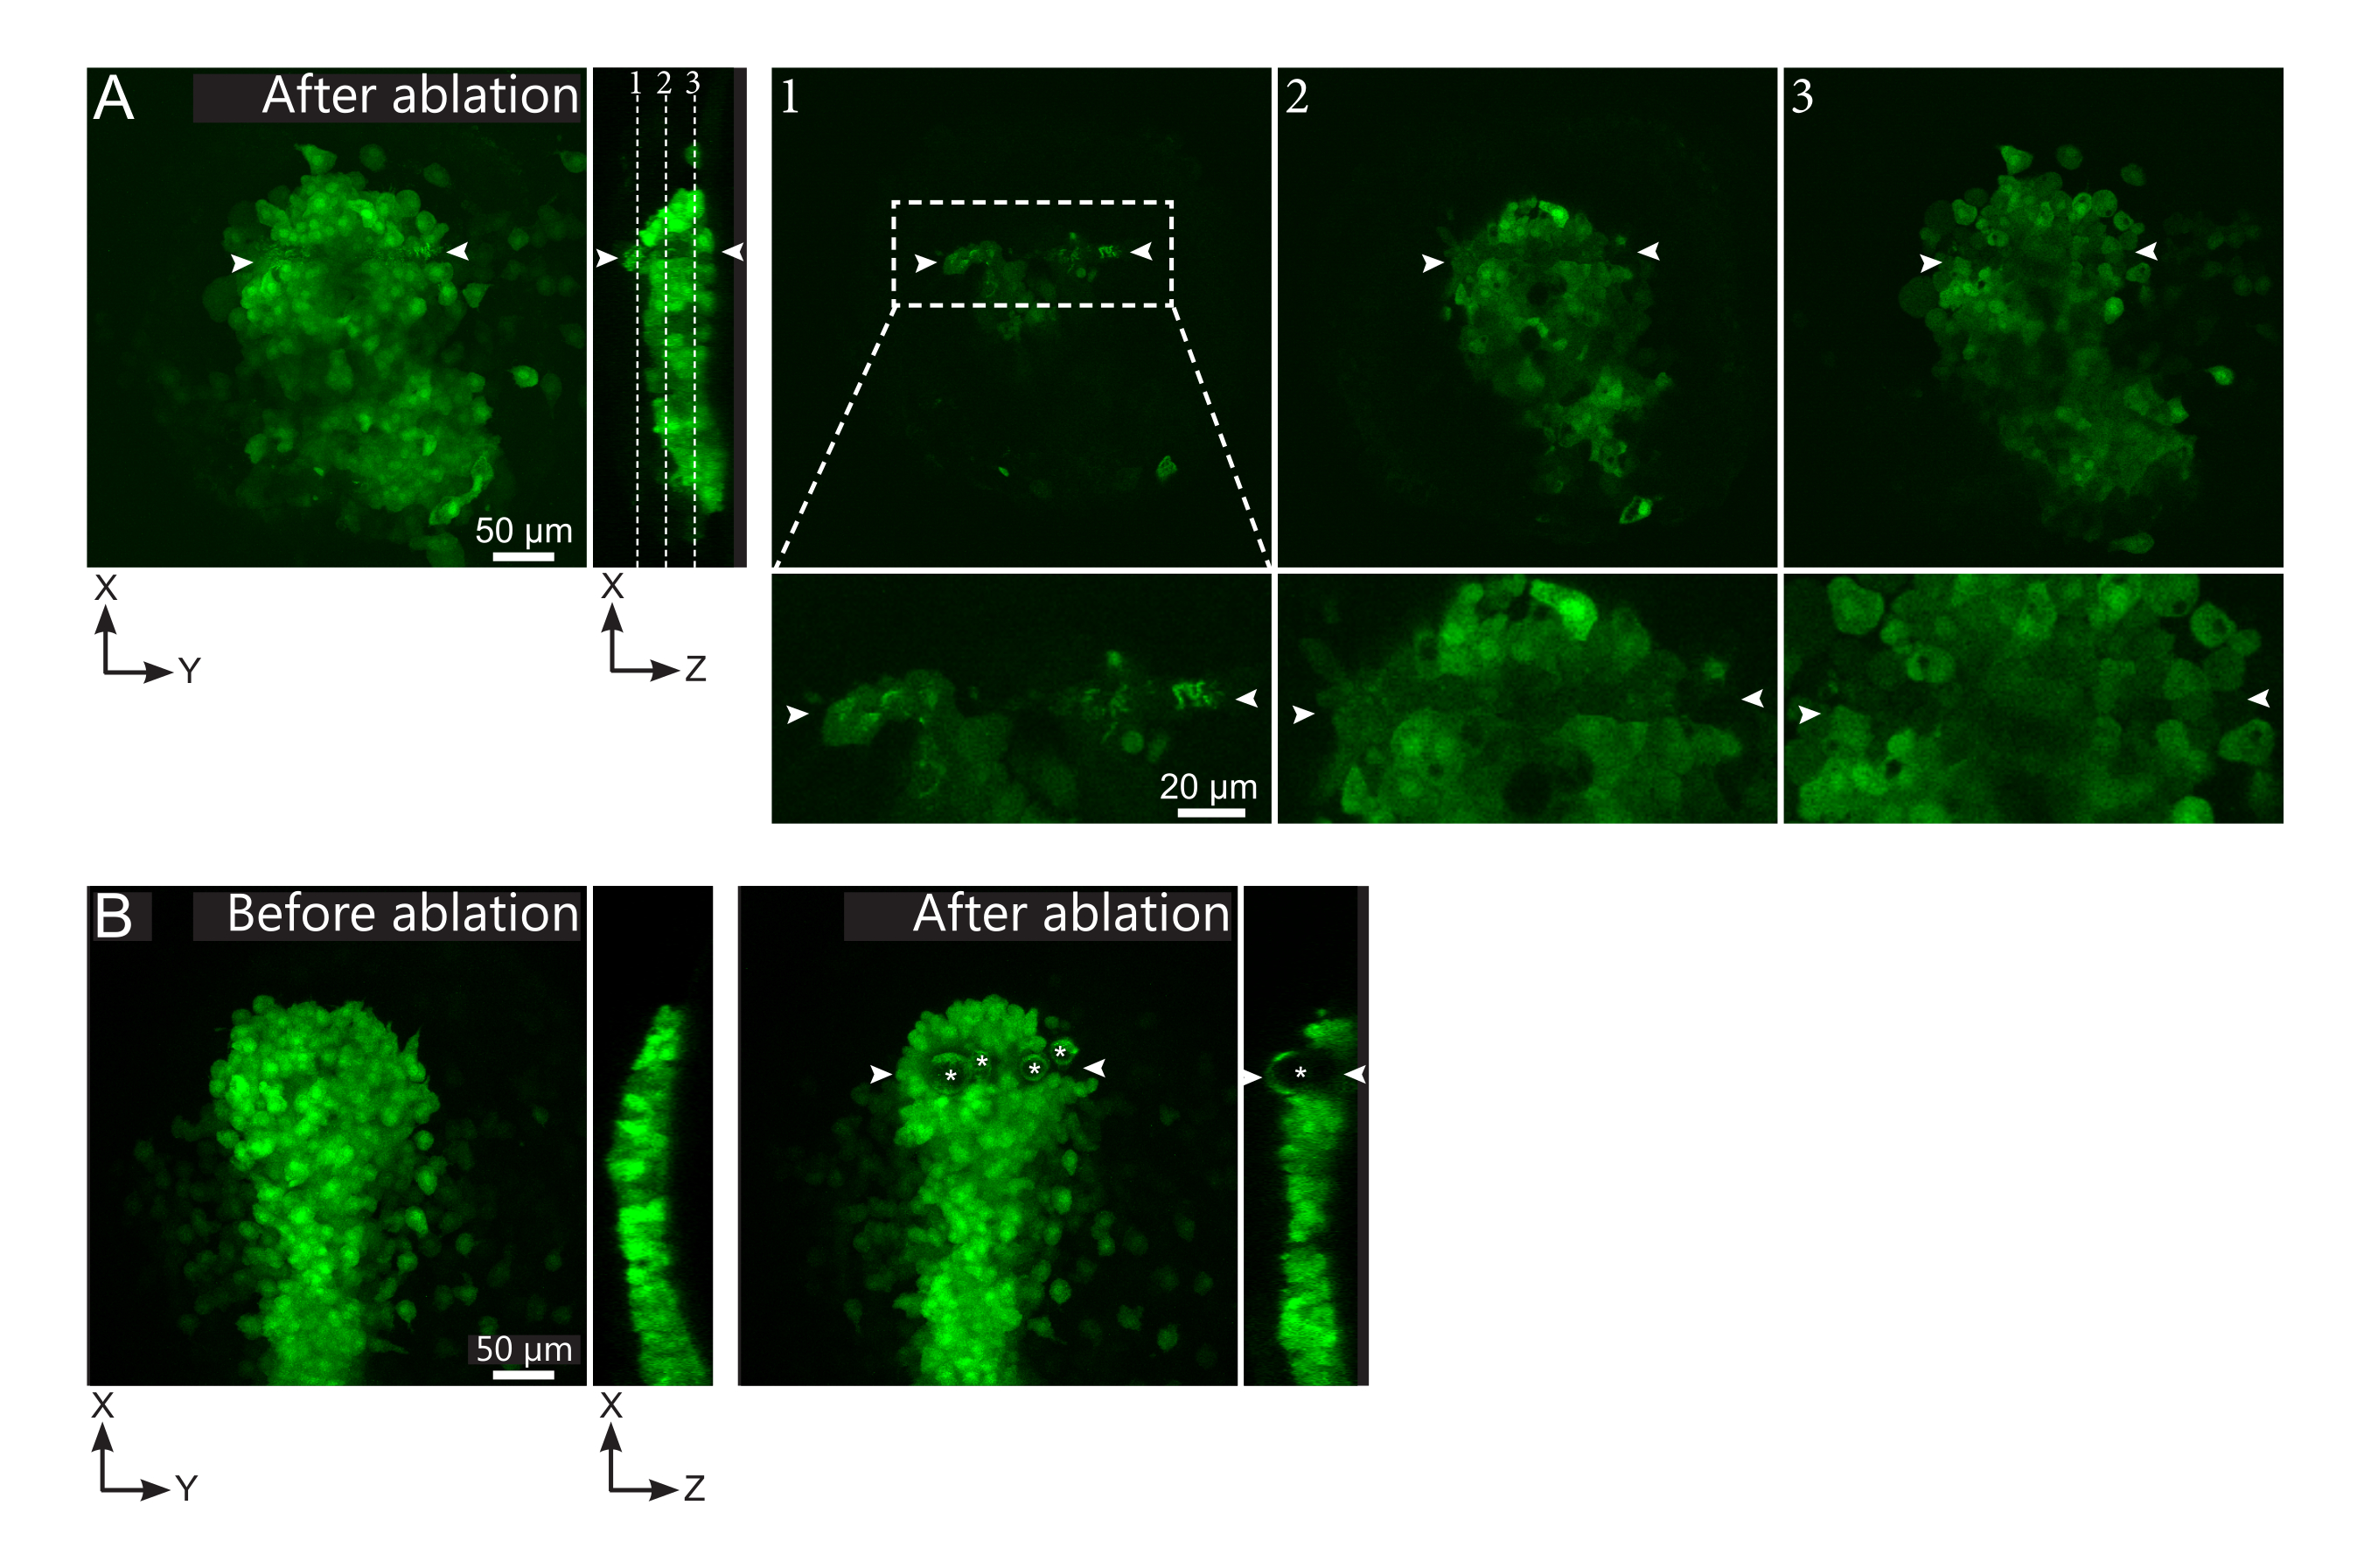
Figure 2: Negative results of laser ablations. (A) Typical examples of potential failures in laser ablation. Large XY views are maximum projections, XZ view is a reconstructed section. Laser treated area is located between the two white arrowheads. Three focal planes are highlighted in the reconstructed section and displayed on the right. They correspond to three different kinds of failures. Plane 1 shows that cells above the polster have been ablated. This can be identified by the presence of autofluorescent debris on this focal plane (see close-up) above the polster (see position of plane 1 on the reconstructed section). This likely results from an incorrect definition of the region to be ablated. Plane 2 shows cells that have been bleached but not ablated. They can be identified as the low fluorescence signal still reveals intact cell contours (see close-up). Plane 3 displays intact cells, which have hardly been bleached by laser treatment. This could result from an incorrect definition of the region to be ablated or from poor treatment. In the situations depicted in planes 2 and 3, it is possible to re-apply the ablation treatment to the non-ablated targeted cells. The scale bar is 50 µm in large views and 20 µm in close-ups. (B) A typical example of bubbles (marked by white asterisks) formed by cavitation because of a too intense laser treatment. Such bubbles are not limited to a Z-plane, sometimes even spanning the full height of the polster, deforming neighboring tissues. The scale bar is 50 µm. Please click here to view a larger version of this figure.
8. Data analysis
- Open time-lapse series with the image analysis software and set correct pixel size.
- In the Spot function, set the Object Size to 10 µm, as this is the average nucleus size during gastrulation. Then, run the Spot function to detect and track the nuclei.
NOTE: Detection may be slightly improved by considering the lower axial resolution, fitting a 12 µm long ellipsoidal shape along the Z-axis. - Use filters to remove false positives. In the Tg(Gsc:GFP) line, cells from the embryonic axis and some endodermal cells are labeled in green. Hence, filtering on green intensity allows a quick selection of these cells (Figure 3A).
- Set the maximal distance between consecutive points to a value compatible with the speed of the cells.
NOTE: Be careful to consider the time interval between two frames. Polster cells migrate at 2.8 ± 0.8 µm/min. Hence, allowing 4 µm of maximum displacement for a time step of 1 min removes most artefactual tracks. - Allowing gaps over one or two time points provides longer continuous tracks but may introduce tracking errors. If a nucleus is not detected correctly at a one-time point, consider re-running spot detection with different parameters/filters.
- Visually check tracks and, if necessary, correct them.
- Export the results as a .xlsx file. Process the file using published spreadsheet routines24 (Figure 3B) and custom routines on data analysis software (available on request).

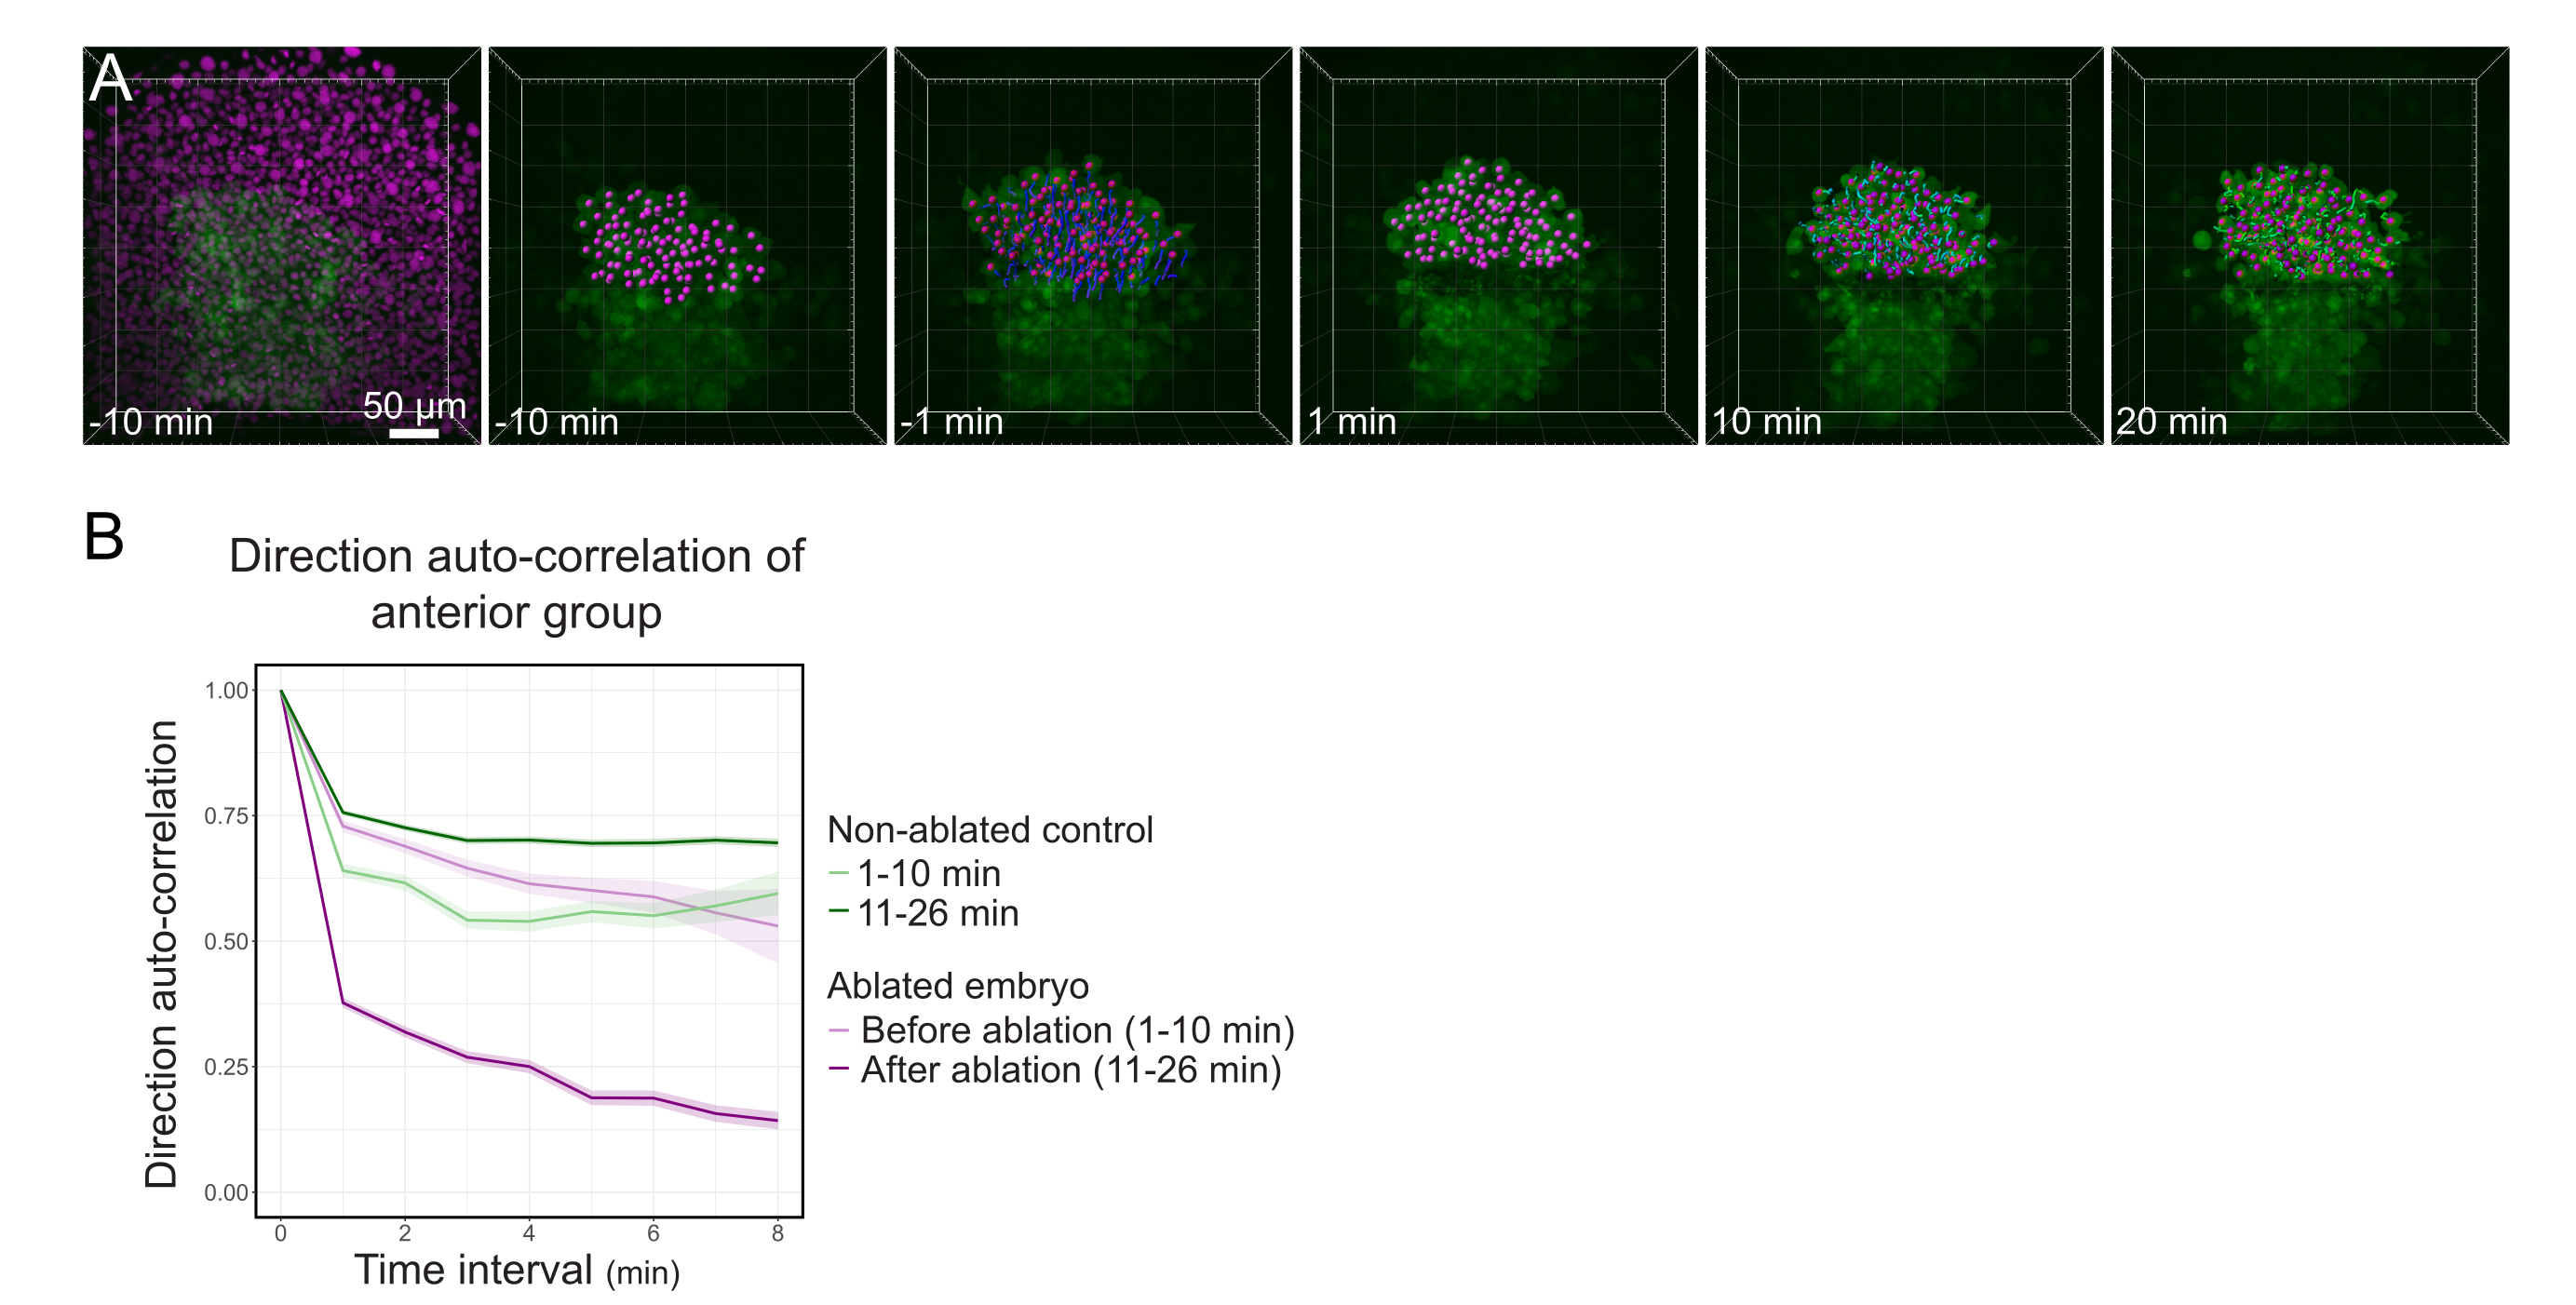
Figure 3: Isolation of the anterior half of the polster affects cell directionality. (A) 3D reconstructions a Tg(gsc:GFP) embryo expressing Histone2B-mCherry (displayed in magenta), before and after a laser ablation severing the polster in its middle. Nuclei belonging to the anterior half of the polster are marked with a magenta dot and tracked over time before and after ablation (see Movie S1). The scale bar is 50 µm. (B) As a measure of migration persistence, direction auto-correlation of cells belonging to the anterior part of the polster before and after ablation. Cells display a continuous motion before ablation, which drastically decreases after ablation, indicating loss of collective-oriented migration. Direction auto-correlation was also measured on cells forming the anterior half of the polster of a non-ablated embryo, as a control. The graph envelopes indicate standard error. Please click here to view a larger version of this figure.
Wyniki
To sever the polster in its middle, a Tg(gsc:GFP) embryo, injected with Histone2B-mCherry mRNAs was mounted at the 70% epiboly stage, as described in step 4. The polster was identified by GFP expression, and the embryo was mounted so that the plane of the polster is perpendicular to the optical axis (Figure 1B). Tilting the embryo away from this position will complicate the procedure. The light will have to go through more tissues to reach the ablation planes, and ablation planes wi...
Dyskusje
Here, we describe a protocol that uses non-linear optics to perform deep and spatially well-defined volume ablations. The most critical step of the protocol is to find treatment conditions that provide sufficient energy to allow ablations, but not too much energy, to avoid excessive debris or cavitation. The amount of delivered energy at the target site mainly depends on: (1) the laser exit power, (2) the quality of laser alignment, (3) the nature of the tissue through which the light passes to reach the ablation plane, ...
Ujawnienia
The authors declare no competing interests.
Podziękowania
We thank Emilie Menant for fish care, the Polytechnique Bioimaging Facility, in particular Pierre Mahou, for assistance with live imaging on their equipment partly supported by Région Ile-de-France (interDIM) and Agence Nationale de la Recherche (ANR-11-EQPX-0029 Morphoscope2, ANR-10-INBS-04 France BioImaging). This work was supported by the ANR grants 15-CE13-0016-1, 18-CE13-0024, 20-CE13-0016, and the European Union's Horizon 2020 research and innovation programme under the Marie Skłodowska-Curie grant agreement No 840201, the Ministère de l'Enseignement Supérieur et de la Recherche and the Centre National de la Recherche Scientifique.
Materiały
| Name | Company | Catalog Number | Comments |
| 25x water immersion objective | Olympus | XLPLN25XWMP2 | |
| Agarose | PanReac AppliChem | A8963,0500 | |
| Data analysis software : Matlab | Math Works | ||
| Electro-optic modulator (EOM) | ConOptics | 350-80LA | |
| Embryo Medium (EM) solution | Westerfield, M. The Zebrafish Book. A Guide for the Laboratory Use of Zebrafish (Danio rerio), 5th Edition. University of Oregon Press, Eugene (Book). (2000). | ||
| Environmental chamber chamber | Okolab | H201-T-UNIT-BL | |
| EOM driver | ConOptics | 302RM | |
| Fluorescence source | Lumencor | SOLA | |
| Glass bottom dishes | MatTek | P35G-0-10-C | |
| Glass capillaries | Harvard Apparatus | 300085 | Outside diameter 1.0 mm, inside diameter 0.58 mm |
| Glass pipettes | Volac | D810 | Tip should be fire polished |
| Green/ablation laser | Spectra Physics | Mai Tai HP DeepSee | |
| Histone2B-mCherry mRNA | Synthesized from pCS2-H2B-mCherry plasmid (Dumortier& al. 2012) | ||
| Image analysis software: IMARIS | Bitplane | ||
| ImSpector software | Abberior Instruments Development Team | ||
| Injection mold | Adapative Science Tools | I-34 | |
| Microloader tips | Eppendorf | 5242956003 | |
| Micromanipulator | Narishige | MN-151 | |
| Micropipette puller | Sutter | P-1000 | |
| mMESSAGE mMACHINE SP6 Transcription Kit | Invitrogen | AM1340 | |
| Penicillin-Streptomycin | Thermofisher | 15140-122 | 10 000 units penicillin and 10 mgstreptomycin per ml |
| Photomultiplier tube (PMT) | Hammamatsu | H7422-40 | |
| PicoPump (Air injector) | World Precision Instrument | PV820 | |
| Red laser | Spectra Physics | OPO/Insight DeepSee | |
| RNAse free water for injection | Sigma | W3500 | |
| Spreadsheet software: Excel | Microsoft | ||
| Stereomicroscope | Nikon | SMZ18 | |
| Tg(gsc:GFP) zebrafish line | Doitsidou, M. et al. Guidance of primordial germ cell migration by the chemokine SDF-1. Cell. 111 (5), 647–59, doi: doi.org/10.1016/S0092-8674(02)01135-2 (2002). | ||
| TriM Scope II microscope | La Vision Biotech |
Odniesienia
- Slack, J. M. W. Embryonic induction. Mechanisms of Development. 41 (2-3), 91-107 (1993).
- Fernandez-Sanchez, M. -. E., Brunet, T., Röper, J. -. C., Farge, E. Mechanotransduction's impact on animal development, evolution, and tumorigenesis. Annual Review of Cell and Developmental Biology. 31, 373-397 (2015).
- Shih, J., Fraser, S. E. Characterizing the zebrafish organizer: microsurgical analysis at the early-shield stage. Development. 122 (4), 1313-1322 (1996).
- Selleck, M. A. J. Culture and microsurgical manipulation of the early avian embryo. Methods in Cell Biology. 51 (51), 1-21 (1996).
- Bulina, M. E., et al. A genetically encoded photosensitizer. Nature Biotechnology. 24 (1), 95-99 (2006).
- Fang-Yen, C., Gabel, C. V., Samuel, A. D. T., Bargmann, C. I., Avery, L. Laser microsurgery in Caenorhabditis elegans. Methods in Cell Biology. 107, 177-206 (2012).
- Colombelli, J., Grill, S. W., Stelzer, E. H. K. Ultraviolet diffraction limited nanosurgery of live biological tissues. Review of Scientific Instruments. 75 (2), 472-478 (2004).
- Smutny, M., Behrndt, M., Campinho, P., Ruprecht, V., Heisenberg, C. -. P. UV laser ablation to measure cell and tissue-generated forces in the zebrafish embryo in vivo and ex vivo. Methods in Molecular Biology. 1189, 219-235 (2015).
- Behrndt, M., et al. Forces driving epithelial spreading in zebrafish gastrulation. Science. 338 (6104), 257-260 (2012).
- Volpe, B. A., Fotino, T. H., Steiner, A. B. Confocal microscope-based laser ablation and regeneration assay in zebrafish interneuromast cells. Journal of Visualized Experiments: JoVE. (159), (2020).
- Bonnet, I., et al. Mechanical state, material properties and continuous description of an epithelial tissue. Journal of the Royal Society, Interface. 9 (75), 2614-2623 (2012).
- Rauzi, M., Lenne, P. F., Lecuit, T. Planar polarized actomyosin contractile flows control epithelial junction remodelling. Nature. 468 (7327), 1110-1115 (2010).
- Niemz, M. H. . Laser-Tissue Interactions. Encyclopedia of Biomaterials and Biomedical Engineering, Second Edition - Four Volume Set. , (2019).
- Smith, A. M., Mancini, M. C., Nie, S. Bioimaging: second window for in vivo imaging. Nature Nanotechnology. 4 (11), 710-711 (2009).
- Rauzi, M., Lenne, P. -. F. Cortical forces in cell shape changes and tissue morphogenesis. Current Topics in Developmental Biology. 95, 93-144 (2011).
- Theveneau, E., David, N. B. Migrations cellulaires collectives. Medecine/Sciences. 30 (8-9), 751-757 (2014).
- Dumortier, J. G., Martin, S., Meyer, D., Rosa, F. M., David, N. B. Collective mesendoderm migration relies on an intrinsic directionality signal transmitted through cell contacts. Proceedings of the National Academy of Sciences of the United States of America. 109 (42), 16945-16950 (2012).
- Solnica-Krezel, L., Stemple, D. L., Driever, W. Transparent things: cell fates and cell movements during early embryogenesis of zebrafish. BioEssays. 17 (11), 931-939 (1995).
- Montero, J. -. A., Kilian, B., Chan, J., Bayliss, P. E., Heisenberg, C. -. P. Phosphoinositide 3-kinase is required for process outgrowth and cell polarization of gastrulating mesendodermal cells. Current Biology. 13 (15), 1279-1289 (2003).
- Ulrich, F., et al. Slb/Wnt11 controls hypoblast cell migration and morphogenesis at the onset of zebrafish gastrulation. Development. 130 (22), 5375-5384 (2003).
- Kai, M., Heisenberg, C. -. P., Tada, M. Sphingosine-1-phosphate receptors regulate individual cell behaviours underlying the directed migration of prechordal plate progenitor cells during zebrafish gastrulation. Development. 135 (18), 3043-3051 (2008).
- Smutny, M., et al. Friction forces position the neural anlage. Nature Cell Biology. 19 (4), 306-317 (2017).
- Johansson, M., Giger, F. A., Fielding, T., Houart, C. Dkk1 controls cell-cell interaction through regulation of non-nuclear β-Catenin pools. Developmental Cell. 51 (6), 775-786 (2019).
- Gorelik, R., Gautreau, A. Quantitative and unbiased analysis of directional persistence in cell migration. Nature Protocols. 9 (8), 1931-1943 (2014).
- Grill, S. W., Howard, J., Schäffer, E., Stelzer, E. H. K., Hyman, A. A. The distribution of active force generators controls mitotic spindle position. Science. 301 (5632), 518-521 (2003).
- Desprat, N., Supatto, W., Pouille, P. -. A. A., Beaurepaire, E., Farge, E. Tissue deformation modulates twist expression to determine anterior midgut differentiation in Drosophila embryos. Developmental Cell. 15 (3), 470-477 (2008).
- Farhadifar, R., Röper, J. -. C., Aigouy, B., Eaton, S., Jülicher, F. The influence of cell mechanics, cell-cell interactions, and proliferation on epithelial packing. Current Biology. 17 (24), 2095-2104 (2007).
- Willier, B. H., Oppenheimer, J. M. . Foundations of Experimental Embryology. , (1964).
- Ashby, W. J., Zijlstra, A. Established and novel methods of interrogating two-dimensional cell migration. Integrative Biology: Quantitative Biosciences from Nano to Macro. 4 (11), 1338-1350 (2012).
- Bosze, B., et al. Pcdh18a regulates endocytosis of E-cadherin during axial mesoderm development in zebrafish. Histochemistry and Cell Biology. 154 (5), 463-480 (2020).
Przedruki i uprawnienia
Zapytaj o uprawnienia na użycie tekstu lub obrazów z tego artykułu JoVE
Zapytaj o uprawnieniaThis article has been published
Video Coming Soon
Copyright © 2025 MyJoVE Corporation. Wszelkie prawa zastrzeżone