É necessária uma assinatura da JoVE para visualizar este conteúdo. Faça login ou comece sua avaliação gratuita.
Method Article
Análise da expressão global de Gene usando uma plataforma Microarray Zebrafish Oligonucleotide
Resumo
Gene microarrays são ferramentas poderosas no perfil de expressão gênica ao nível do genoma. Esta tecnologia tem aplicação em uma variedade de disciplinas biológicas, incluindo biologia do desenvolvimento e toxicologia. Neste vídeo, detalhamos um protocolo para análise global de expressão gênica utilizando uma plataforma de microarray abrangente de oligonucleotídeos para o peixe-zebra.
Resumo
Gene microarray tecnologia permite a medição quantitativa e perfil de expressão gênica dos níveis de transcrição em uma base de todo o genoma. Gene microarray tecnologia é utilizada em numerosas disciplinas biológicas em uma variedade de aplicações, incluindo análise global de expressão gênica em relação ao estágio de desenvolvimento, para um estado de doença, e em respostas tóxicas. Aqui, nós incluímos uma demonstração de análise global de expressão gênica utilizando um abrangente zebrafish específicos plataforma de microarranjos de oligonucleotídeos. O peixe-zebra plataforma de microarray expressão contém 385.000 sondas, 60 pares de bases de comprimento, interrogando 37.157 alvos com até 12 sondas por alvo. Para esta plataforma, todas as informações de cDNA e genômica disponível para o peixe-zebra foi coletado a partir de bases de dados genômicos diversos, incluindo Ensembl (http://www.ensembl.org), VEGA (http://vega.sanger.ac.uk), UCSC ( http://genome.ucsc.edu), e ZFIN (http://www.zfin.org). Como resultado dessa matriz de expressão fornece cobertura completa do transcriptoma zebrafish atual. O microarray expressão zebrafish foi impresso pela Roche NimbleGen (Madison, WI). Esta demonstração técnica inclui a marcação fluorescente de um produto cDNA, hibridação do produto marcado para a plataforma de cDNA microarray, e digitalização de matriz para a aquisição de sinal usando a estratégia de uma análise de cor.
Protocolo
Part 1: Fluorescent Labeling of cDNA
The Cy3 dye used in the microarray experiment is sensitive to photo-degradation. The procedure should take place in a minimal amount of light. The labeling protocol was adapted from the BioPrime Array CGH Genomic Labeling System Manual1.
- The reagents for the labeling reaction are stored at -20°C. From the BioPrime Array CGH Genomic Labeling System thaw 2.5X Random Primer Buffer, 10X dCTP mix, and nuclease-free water. Also thaw the Cy3-dCTP dye. After thawing, briefly centrifuge all reagents before using.
- A separate labeling reaction will need to be completed for each cDNA sample to be analyzed. Into a 0.6 ml thick-walled tube add 500 ng cDNA, 40 μl 2.5X Random Primer Buffer and nuclease-free water to achieve a total volume of 86 μl.
- Mix well and briefly centrifuge. Incubate reaction for 5 minutes at 100°C on a thermocycler.
- Immediately transfer reaction into an ice bath slurry for 10 minutes.
- To each tube then add 10 μl 10X dCTP mix, 2 μl 1 mM Cy3-dCTP and 2 μl Exo Klenow DNA polymerase. The Exo Klenow DNA polymerase should be left in the freezer until needed and should always be kept on ice.
- Mix reaction well and briefly centrifuge.
- Incubate reaction at 37°C for 16 hours in a thermocycler.
Part 2: Precipitation of Labeled cDNA
- Before continuing in the protocol turn on the NimbleGen Hybridization System and allow the system to equilibrate to 42°C.
- For each reaction, place a Microcon column into a 1.5 ml tube. Add 300 μl 0.1X SSC to each column followed by the contents of the labeling reaction (100 μl).
- Centrifuge the tube containing the column at 16,100 x g for 10 minutes at 4°C.
- Discard the flow through, which may be slightly pink in color, and add another 300 μl 0.1X SSC to column.
- Repeat centrifugation at 16,100 x g for 10 minutes at 4°C.
- Discard the flow through and add an additional 300 μl 0.1X SSC to column.
- Centrifuge at 16,100 x g for 12 minutes at 4°C.
- Discard flow through. The flow through should be clear after this last wash and you should be able to see the pink labeled cDNA on the column.
- Apply 100 μl nuclease-free water to column. Remove column from the 1.5 ml tube and invert column into a new 1.5 ml tube.
- Centrifuge at 2,300 x g for 2 minutes at 4°C. The labeled cDNA should be rehydrated in the water that collects at the bottom of the tube.
- Use a NanoDrop ND-1000 spectrophotometer according to the manufacturer's instructions to calculate DNA concentration and evaluate dye incorporation by calculating the base to dye ratio where the nucleotide to Cy3 ratio equals the A260/A550 ratio multiplied by 23.15. The base to dye ratio should be between 50 and 80.
- If cDNA if labeled sufficiently, aliquot 6 μg of labeled cDNA into a new 1.5 ml tube.
- Mix in 0.1X volume of 3 M NaOAc, pH 5.2 and 1X volume isopropanol. Allow mixture to incubate in the dark for 30 minutes at room temperature.
- Next centrifuge the sample at 16,100 x g for 20 minutes at room temperature.
- Carefully discard the supernatant without disturbing the DNA pellet, which should be pink in color.
- Perform an ethanol wash by adding 500 μl 70% EtOH and mix by gentle inversion.
- Centrifuge sample at 16,100 x g for 5 minutes at room temperature.
- Remove the supernatant, invert the tube, and allow the pellet to dry for 5 minutes. At this step the pellet may be stored at -20°C if desired or the protocol can be continued to the hybridization step.
Part 3: Hybridization
The hybridization procedure is adapted from the Roche NimbleGen Arrays User's Guide for Gene Expression Analysis2.
- Dissolve the pellet in 5 μl of nuclease-free water.
- Once the pellet is dissolved add hybridization components listed in Table 1. Hybridization components are from the Roche NimbleGen Hybridization Kit. After all components are added the total volume should now total 18 μl. Mix well and briefly spin the tube to collect the contents at the bottom.
- The next step is to denature the labeled cDNA by placing it on a heat block at 95°C for 5 minutes.
- Immediately transfer the tube to the NimbleGen Hybridization System while the arrays are prepared in the following steps.
- Microarrays should always be handled carefully and stored according to manufacturer's instructions. Roche NimbleGen recommends storing their expression arrays in the dark with desiccant at room temperature.
- Load the array into the Precision Mixer Alignment Tool (PMAT) provided in the NimbleGen array processing accessories.
- Load an X1 mixer onto the PMAT and remove the adhesive strip with forceps. Close the PMAT securely. Apply pressure to the mixer through the hole in the PMAT and slowly open so that the array and mixer disengage from the PMAT.
- Firmly apply pressure with the brayer around the outside of the mixer to ensure the seal to the array is complete and to remove any bubbles. Place the array-mixer complex onto the hybridization system to warm.
- Using a displacement pipette, slowly add 15 μl of the labeled sample into the fill port. This is the hole located in the center of the mixer. Apply slow and steady pressure to the pipette so that the sample spreads evenly through the mixer without any air bubbles. Wipe off any excess sample from the port holes and seal port holes with adhesive strips.
- Close the latch and start mixing of the hybridization solution using program B on the NimbleGen Hybridization System. Allow microarrays to hybridize for 16-20 hours.
Part 4: Post-hybridization Washes and Scanning of Microarray
The washing and scanning procedure is adapted from the Roche NimbleGen Arrays User's Guide for Gene Expression Analysis2.
- Once hybridization is near completion prepare wash buffers as outlined in Table 2. Pre-warm Wash Buffer IA to 42°C in a water bath.
- Turn on GenePix 4000B array scanner and allow the scanner to warm for about 15 minutes before use.
- Pour the pre-warmed Wash Buffer IA into a dish.
- Remove the array-mixer complex from the NimbleGen Hybridization system and slide into the jig (supplied in the NimbleGen array processing accessories). Submerge assembly into pre-warmed Wash Buffer IA and carefully remove mixer by peeling away from slide.
- Remove array from jig and agitate for 15 seconds in Wash Buffer IA.
- Quickly transfer array into a slide rack in the room temperature Wash Buffer IB. Agitate the slide rack vigorously for 2 minutes.
- Transfer the slide rack into Wash Buffer II and agitate for 1 minute.
- Transfer the slide rack into the Wash Buffer III and agitate for 15 seconds.
- Transfer the array into the slide drying centrifuge and spin for 2 minutes to remove all moisture. Proceed to scanning.
- It is recommended to scan the array immediately since the dye is sensitive to both light and ozone.
- Load the array, barcode down, into the GenePix 4000B array scanner.
- Open the GenePix Pro software and proceed to scanning of array. The Roche NimbleGen gene expression arrays utilize a one color hybridization strategy. As a result only one wave length is required for scanning. Scan Cy3 fluorescence signal using the 532 nm laser. Open the hardware setting dialog box and set PMT value of the 532 nm laser to a value of 500.
- In the hardware setting dialog box, set power to 100%, pixel size to 5 microns, lines to average to 1, and focus position to 0 microns.
- Perform a preview scan and set scan area.
- Perform scan.
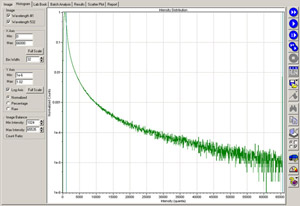
- Once scanning is complete check the image histogram. Ideally 1e-5 normalized counts should be at 65,000 saturation limit meaning that ~1-2% of the features are saturated. If the normalized counts are less than 1e-5, increase the PMT gain and rescan the slide. If the normalized counts are greater than 1e-5, decrease the PMT gain and rescan the slide.
- Once scanning is complete save the image. It is recommended to choose a standard naming convention for images for ease in reference. The image can now be loaded into the data analysis program of preference for data normalization and calculation of intensity values.
Representative Results
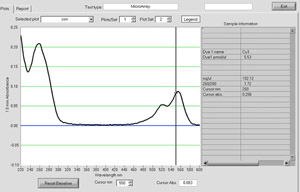
You can first begin to assess the efficiency of the Cy3 fluorescence labeling reaction of the cDNA when beginning the washes with 0.1X SSC. During each subsequent wash the flow through should become less pink in color with the last flow through clear. In addition, the Cy3-labeled cDNA product should be visible on the column during these wash steps. If the flow through is bright pink in color or there is no pink product on the column, this is a good indication that the labeling reaction did not proceed correctly. The labeling reaction can be assessed quantitatively using the NanoDrop ND-1000 spectrophotometer to determine concentration of the labeled DNA and base to dye ratio (Figure 1). The labeling reaction routinely yields at least 10 μg of labeled DNA in our laboratory. Dye incorporation can be calculated by using a simple base/dye ratio where the nucleotide to Cy3 ratio equals the A260/A550 ratio multiplied by 23.15. Values ranging from 50-80 indicate sufficient dye incorporation in the labeling reaction. If the labeling reaction yields a low concentration of DNA or poor dye incorporation, hybridization of the sample onto the microarray is not recommended and labeling reaction should be repeated.
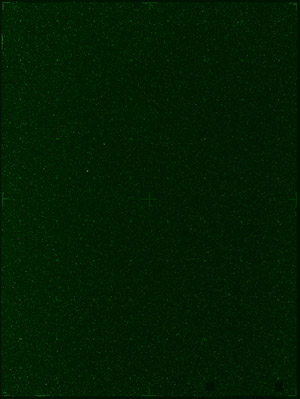
Assessment of the quality of the hybridization can be conducted by evaluating the image histogram and the scanned image of the microarray (Figure 2). Acceptable hybridizations will have 1-2% of the features saturated (i.e., yielding 1e-5 normalized counts at the 65,000 saturation limit) with the PMT value set near 500. If the PMT value has to be adjusted drastically from 500 to attain 1e-5 normalized counts at the 65,000 saturation limit, this generally indicates poor hybridization of the labeled cDNA to the microarray. Data quality will be comprised if this data is continued through subsequent analysis. Hybridization quality can also be qualitatively assessed by viewing images of the scanned array (Figure 3). The Roche NimbleGen Hybridization Kit contains an alignment oligo mixture of Cy3- and Cy5-labeled 48mer oligonucleotides that hybridize to alignment features on the arrays. Qualitative assessment of the intensity of the alignment oligos to other features on the array permits a quality check on the hybridization efficiency of the fluorescently labeled cDNA onto the array. Following further analysis, a scatter plot of your analyzed data can be used to determine the relative levels of gene expression and to identify genes that are differentially expressed between your samples (Figure 4).

Figure 1. A NanoDrop spectrum from cDNA labeled with Cy3. Labeled cDNA yield and dye incorporation can be assessed using a NanoDrop ND-1000 spectrophotometer. Please click here to see a larger version of figure 1.

Figure 2. A GenePix histogram for microarray scan. Quality of the hybridization can be assessed by evaluating the image histogram. Acceptable hybridizations will have 1-2% of the features saturated with 1e-5 normalized counts at the 65,000 saturation limit with the PMT value set near 500. Please click here to see a larger version of figure 2.

Figure 3. A scanned microarray image. Hybridization quality can be assessed by viewing the scanned image of the microarray. The image should be examined for the presence of dust or other interfering factors prohibiting visualization of each feature and thus, preventing accurate calculation of the fluorescence intensity of the feature. The intensity of the alignment oligos can be compared to the other features on the array to assess hybridization efficiency.

Figure 4. A scatter plot of an analyzed microarray experiment. The goal of this procedure is to identify genes that are differentially expressed in your samples. Microarray data can be further analyzed and viewed in a scatter plot to visualize genes that are differentially expressed.
Table 1. Components from Roche NimbleGen Hybridization Kit to add for hybridization step 2.
| Component | Volume |
| Sample (dissolved in water) | 5 μl |
| 2X Hybridization Buffer | 9 μl |
| Hyb A | 3.6 μl |
| Alignment Oligo | 0.4 μl |
| Total volume | 18 μl |
Table 2. Wash buffers to be prepared for washing of arrays following hybridization.
| Component | Wash Buffer IA* | Wash Buffer IB | Wash Buffer II | Wash Buffer III |
| Water | 225 ml | 225 ml | 225 ml | 225 ml |
| 10X Wash Buffer I, II, or III | 25 ml | 25 ml | 25 ml | 25 ml |
| 1 M DTT | 25 μl | 25 μl | 25 μl | 25 μl |
| Total volume | 250 ml | 250 ml | 250 ml | 250 ml |
*Pre-warm to 42°C
Discussão
Protocolos microarray muitos, incluindo o detalhado aqui, use corantes fluorescentes como meio de medir e quantificar a hibridização. O corante fluorescente Cy3 é sensível a foto e degradação de ozônio. Recomenda-se que o procedimento seja realizado em uma iluminação mínima. Além disso, pequenas partículas de poeira pode interferir com a hibridação e digitalização. Especial atenção deve ser dada para garantir que a área de trabalho está limpo e livre de poeira.
Há muitas...
Materiais
| Name | Company | Catalog Number | Comments |
| Array Microcentrifuge Dryer | ISC Bioexpress | C-1303-T | |
| BioPrime Array CGH Genomic Labeling System | Invitrogen | 18095-011 | |
| Cyanine 3-dCTP | PerkinElmer, Inc. | NEL576 | |
| GenePix 4000B | Molecular Devices | GENEPIX 4000B | |
| Microcon YM-30 | EMD Millipore | 42411 | |
| NimbleGen Array Processing Accessories | Roche Group | 5223539001 | |
| NimbleGen Hybridization Kit | Roche Group | 5223474001 | |
| NimbleGen Hybridization System 4 | Roche Group | 5223652001 | |
| NimbleGen Wash Buffer Kit | Roche Group | 5223504001 | |
| X1 Mixers | Roche Group | 5223725001 |
Referências
Reimpressões e Permissões
Solicitar permissão para reutilizar o texto ou figuras deste artigo JoVE
Solicitar PermissãoThis article has been published
Video Coming Soon
Copyright © 2025 MyJoVE Corporation. Todos os direitos reservados