13.1 : Reaction Rate
The rate of reaction is the change in the amount of a reactant or product per unit time. Reaction rates are therefore determined by measuring the time dependence of some property that can be related to reactant or product amounts. Rates of reactions that consume or produce gaseous substances, for example, are conveniently determined by measuring changes in volume or pressure.
The mathematical representation of the change in the concentration of reactants and products, over time, is the rate expression for the reaction. The brackets indicate molar concentrations, and the symbol delta (Δ) indicates “change in.”
For example, the concentration of hydrogen peroxide, H2O2, in an aqueous solution changes slowly over time as it decomposes according to the equation:

The rate at which the hydrogen peroxide decomposes can be expressed in terms of the rate of change of its concentration:

Thus, [H2O2]t1 represents the molar concentration of hydrogen peroxide at time t1; likewise, [H2O2]t2 represents the molar concentration of hydrogen peroxide at a later time t2; and Δ[H2O2] represents the change in molar concentration of hydrogen peroxide during the time interval Δt (that is, t2 − t1). Since the reactant concentration decreases as the reaction proceeds, Δ[H2O2] is a negative quantity. Reaction rates are, by convention, positive quantities, and so this negative change in concentration is multiplied by −1.
Average reaction rate and instantaneous reaction rate
Reaction rates vary with time and decrease as the reaction proceeds. An average reaction rate over a time interval can be calculated using the concentrations at the beginning and end of this period, over which the reaction rate is changing. At any specific time, the rate at which a reaction is proceeding is known as its instantaneous rate. The instantaneous rate of a reaction at “time zero,” when the reaction commences, is its initial rate.
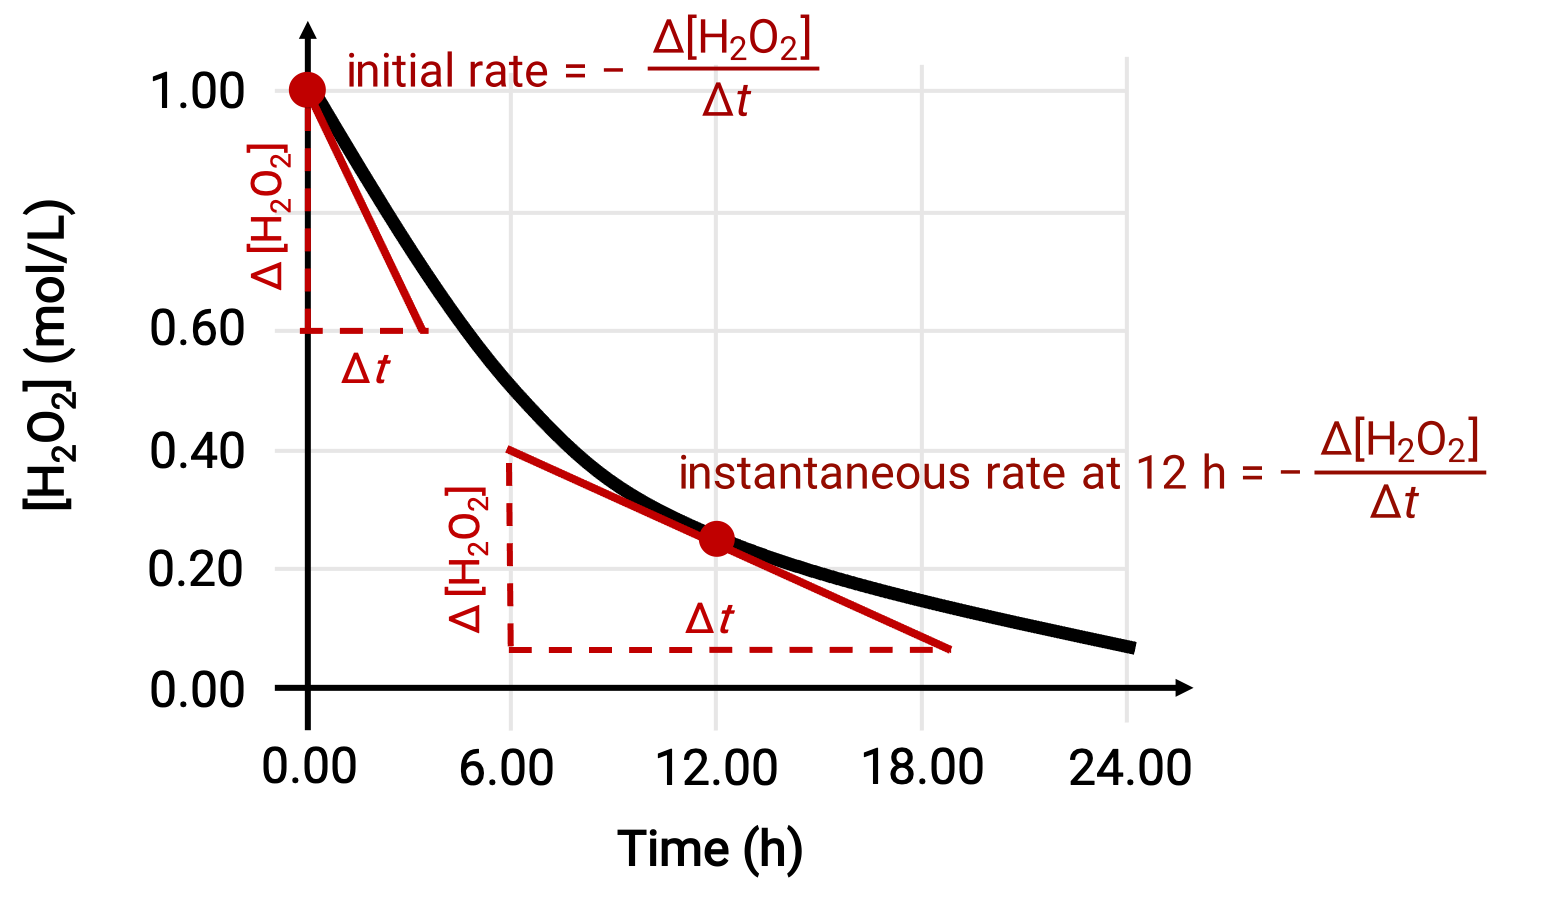
The instantaneous rate of a reaction may be determined by one of the two ways. If experimental conditions permit the measurement of concentration changes over short time intervals, then the computation of average rates provide reasonably good approximations of instantaneous rates. Alternatively, a graphical procedure may be used. For instance, in the hydrogen peroxide decomposition example, by plotting the concentration of hydrogen peroxide against time, the instantaneous rate of decomposition of H2O2 can be computed at any time ‘t’ from the slope of a tangent drawn to the curve at that time.

This graph shows a plot of concentration versus time for a 1.000 M solution of H2O2. The rate at any time is equal to the negative of the slope of a line tangent to the curve at that time. Tangents are shown at t = 0 h (“initial rate”) and at t = 12 h (“instantaneous rate” at 12 h).
Relative Rates of Reaction
The rate of a reaction may be expressed as the change in concentration of any reactant or product. For any given reaction, these rate expressions are all related to one another according to the reaction stoichiometry. The rate of the general reaction aA ⟶ bB can be expressed in terms of the decrease in the concentration of A or the increase in the concentration of B. These two rate expressions are related by the stoichiometry of the reaction, where:

Note that a negative sign has been included as a factor to account for the opposite signs of the two amount changes (the reactant amount is decreasing while the product amount is increasing).
This text is adapted from Openstax, Chemistry 2e, Chapter 12 Introduction and Openstax, Chemistry 2e, Section 12.1: Chemical Reaction Rates.
From Chapter 13:

Now Playing
13.1 : Reaction Rate
Chemical Kinetics
50.8K Views

13.2 : Measuring Reaction Rates
Chemical Kinetics
24.3K Views

13.3 : Concentration and Rate Law
Chemical Kinetics
29.8K Views

13.4 : Determining Order of Reaction
Chemical Kinetics
54.7K Views

13.5 : The Integrated Rate Law: The Dependence of Concentration on Time
Chemical Kinetics
34.2K Views

13.6 : Half-life of a Reaction
Chemical Kinetics
34.0K Views

13.7 : Temperature Dependence on Reaction Rate
Chemical Kinetics
80.9K Views

13.8 : Arrhenius Plots
Chemical Kinetics
38.2K Views

13.9 : Reaction Mechanisms
Chemical Kinetics
25.1K Views

13.10 : Rate-Determining Steps
Chemical Kinetics
31.5K Views

13.11 : Catalysis
Chemical Kinetics
26.5K Views

13.12 : Enzymes
Chemical Kinetics
80.4K Views
Copyright © 2025 MyJoVE Corporation. All rights reserved