A subscription to JoVE is required to view this content. Sign in or start your free trial.
Method Article
A Novel Approach for Documenting Phosphenes Induced by Transcranial Magnetic Stimulation
Summary
Phosphenes are transient percepts of light that can be induced by applying Transcranial Magnetic Stimulation (TMS) to visually sensitive regions of cortex. We demonstrate a standard protocol for determining the phosphene threshold value and introduce a novel method for quantifying and analyzing perceived phosphenes.
Abstract
Protocol
1. Inducing a Phosphene with Stimulation to the Right Occipital Lobe
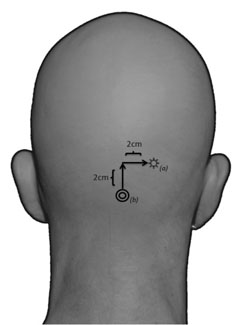
- In a dimly lit room, seat the participant in a comfortable position. Have the participant put on a swim cap, provide them with hearing protection, and adjust the cap and ear plugs for comfort. To locate and mark the initial point of stimulation, first identify the inion, and then move ~2cm rostrally and ~2cm laterally (figure 1). Alternatively, a frameless stereotaxic system can be used to position the TMS coil over the targeted cortical region.
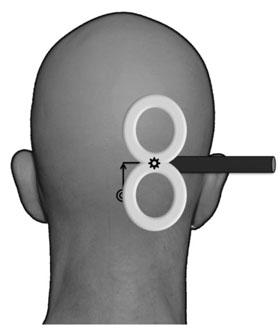
- Using a standard figure-eight (double) TMS coil (70mm), place the center of the coil directly over the location determined in the previous step. The coil should be held tangential to the surface of the scalp and oriented in a medial to lateral orientation with the handle facing away from the midline (figure 2).
- When the participant is ready, apply a single pulse at 60% intensity output. Ask the participant to describe any visual sensation they may have perceived. Participants who are naíve to phosphenes may benefit from wearing a blindfold. If no phosphene was reported, reposition the coil and redeliver a pulse. If the participant still does not report a phosphene, continue delivering pulses every 7 to 10 seconds (~ 0.1 Hz), increasing the intensity by 5% after every five attempts until 100% intensity is reached.
- When the participant reports a phosphene ask him or her to describe in detail what they perceived including color, shape and location. Note: Phosphenes should appear in the contralateral visual field to the hemisphere that is being stimulated. For example if TMS is applied over the right visual cortex, phosphenes should be perceived in the left visual field.
- When phosphenes are reliably reported, mark the location of the coil on the swim cap.
2. Obtaining a Phosphene Threshold Value for the Right Occipital Lobe
- Deliver a series of pulses at the same coil location and orientation as above. Ask the participant to confirm the presence of the induced phosphene.
- Deliver pulses every 7 to 10 seconds (~ 0.1 Hz). Instruct the participant to report, after each pulse, whether a phosphene was perceived using the following criteria: with a "yes" an unambiguously perceived phosphene; "no" the absence of any visual perception; "maybe" if they are not sure. A "maybe" response should not be counted as a positive response when determining the threshold value.
- Adjust the stimulation intensity, delivering 10 pulses at each intensity level, until a phosphene threshold is determined. The threshold is defined as the lowest intensity of stimulation at which the participant reports unambiguous phosphenes for at least fifty-percent of delivered pulses.
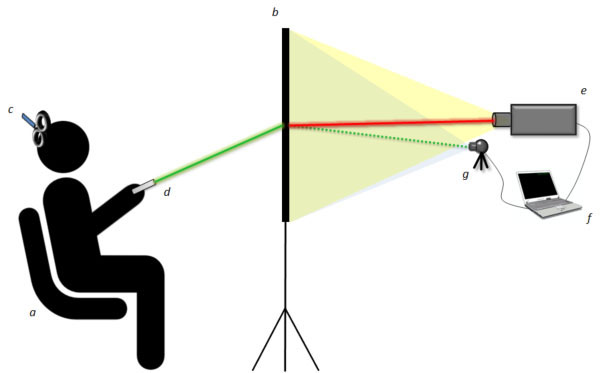
3. Using the LTaP System (Figure 3) to Determining the Size and Location of Phosphenes at Various Fixation points
- Seat the participant so that the nasion (area between the eyes) is approximately 30cm from the center of the projection screen.
- To acclimate the participant to the LTaP system, give them the laser pointer and instruct them to practice tracing figures that resemble perceived phosphenes. If the participant needs more practice, you may ask the participant to direct the laser point to indicated locations on the projection screen. When the participant is acquainted with the LTaP system and can accurately draw shapes on the screen, deliver a series of TMS pulses to the location marked in the previous steps sufficient to induce a visible phosphene. Ask the participant to trace or outline the perceived phosphene on the projection screen using the laser pointer.
- In the three test conditions the stimulus intensity should be 120% of the determined threshold value. For example, if the determined threshold value is 65%, the stimulus intensity value should be set to 78%. The coil location and orientation are the same as determined and described in the above steps.
- In the first of the three test conditions, have the participant direct their gaze towards a central fixation point. After delivering a pulse instruct the participant to trace or outline the perceived phosphene using the laser pointer. Deliver a series of pulses sufficient to induce ten phosphenes.
- In the second test condition, have the participant direct their gaze towards a fixation point that is elevated 45° from the central fixation point. Repeat the protocol as described for the first condition.
- In the third test condition, have the participant direct their gaze towards a fixation point that is positioned 45° to the right of the central fixation point. Repeat the protocol as described for the first condition.
4. Data Analysis
- After the completion of the study data obtained from the LTaP system can be analyzed. The output of the LTAP system consists of an .xml file including color coded X-Y coordinates with timestamps for each record tracing. Analyze the data in order to detect the shift in phosphene position in reference to shift of gaze.
5. Representative Results
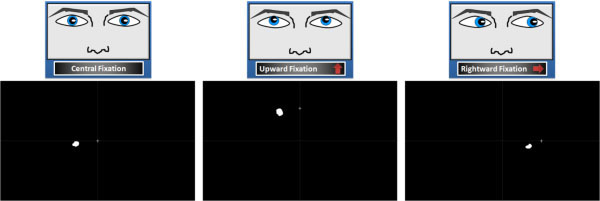
When the TMS coil is placed over the right hemisphere all phosphenes should be observed in the left visual field. When participants are instructed to look straight ahead, phosphenes are typically located in the lower left visual field. Phosphenes should move in accordance with the shift in visual gaze (either 45° vertically or horizontally from central fixation) (figure 4).

Figure 1. Locating and marking the initial stimulation site. For occipital visual areas, the initial stimulation site (a) is typically located ~ 2 cm dorsally and ~ 2 cm laterally from the inion (b).

Figure 2. Position the coil for stimulation. The center of the coil is held tangential to the scalp at the site of stimulation. To minimize an unintended spread of stimulation, orient the handle of the coil away from the midline.

Figure 3. The LTaP (Laser Tracking and Painting) system. A participant (a) sits in front of a rear projection screen (b). After stimulation by the TMS coil (c), the participant uses a laser pointer (d) to draw the perceived phosphenes on the screen (d). A rear-facing webcam (e) records the laser and feeds it to a computer (f) running the LTaP software. The data is then projected back onto the screen via a rear-facing projector (g).

Figure 4. Post-processing of the LTaP data. The location and size of the perceived phosphenes (white shapes) are shown relative to the location of fixation, indicated by the crosshairs.
Discussion
In this video, we have demonstrated a standard protocol for obtaining a phosphene threshold value and introduced a novel method for recording phosphene size and visual field location. Phosphenes were elicited by delivering individual pulses of TMS to the right occipital cortex adjacent to the occipital pole. Phosphene threshold values provide a valuable indication of relative cortical excitability; and have been used both as an outcome measure and as a means of determining the appropriate intensity of TMS in variety of s...
Materials
| Name | Company | Catalog Number | Comments |
| TMS | Magstim | Magstim 200 | |
| Webcam | Logitech | QuickCam Orbit MP | |
| Projector | Epson | Epson PowerLite 7900p | |
| Projection Screen | DA LITE | Da-View fast-fold deluxe screen | |
| Laser Pointer | Generic |
References
- Kammer, T., Puls, K., Strasburger, H., Hill, N. J., Wichmann, F. A. Transcranial Magnetic Stimulation in the Visual System. I. the Psychophysics of Visual Suppression. Experimental Brain Research. 160, 118-128 (2005).
- Afra, J., Mascia, A., Gérard, P., Maertens de Noordhout, A., Schoenen, J. Interictal cortical excitability in migraine: a study using transcranial magnetic stimulation of motor and visual cortices. Ann. Neurol. 44, 209-215 (1998).
- Aurora, S. K., Ahmad, B. K., Welch, K. M., Bhardhwaj, P., Ramadan, N. M. Transcranial magnetic stimulation confirms hyperexcitability of occipital cortex in migraine. Neurology. 50, 1111-1114 (1998).
- Silvanto, J., Pascual-Leone, A. . State-Dependency of Transcranial Magnetic Stimulation. Brain Topography. 21, 1-10 (2008).
- Silvanto, J., Muggleton, N., Cowey, A., Walsh, V. Neural adaptation reveals state-dependent effects of transcranial magnetic stimulation. European Journal of Neuroscience. 25, (2007).
- Kammer, T., Beck, S. Phosphene thresholds evoked by transcranial magnetic stimulation are insensitive to short-lasting variations in ambient light. Exp Brain Res. 145, 407-4010 (2002).
- Bjoertomt, O., Cowey, A., Walsh, V. Spatial neglect in near and far space investigated by repetitive transcranial magnetic stimulation. Brain. 125, 2012-2022 (2002).
- Gothe, J. Changes in visual cortex excitability in blind subjects as demonstrated by transcranial magnetic stimulation. Brain. 125, 479-490 (2002).
- Hotson, J. R., Anand, S. The selectivity and timing of motion processing in human temporo-parieto-occipital and occipital cortex: a transcranial magnetic stimulation study. Neuropsychologia. 37, 169-179 (1999).
- Kammer, T. Phosphenes and transient scotomas induced by magnetic stimulation of the occipital lobe: their topographic relationship. Neuropsychologia. 37, 191-198 (1998).
- Stewart, L., Ellison, A., Walsh, V., Cowey, A. The role of transcranial magnetic stimulation (TMS) in studies of vision, attention and cognition. Acta Psychol (Amst). , 107-275 (2001).
Reprints and Permissions
Request permission to reuse the text or figures of this JoVE article
Request PermissionThis article has been published
Video Coming Soon
Copyright © 2025 MyJoVE Corporation. All rights reserved