
A subscription to JoVE is required to view this content. Sign in or start your free trial.
Method Article
Understanding Dissolved Organic Matter Biogeochemistry Through In Situ Nutrient Manipulations in Stream Ecosystems
In This Article
Summary
Dissolved organic matter provides an important source of energy and nutrients to stream ecosystems. Here we demonstrate a field-based method to manipulate the ambient pool of dissolved organic matter in situ through easily replicable nutrient pulses.
Abstract
Dissolved organic matter (DOM) is a highly diverse mixture of molecules providing one of the largest sources of energy and nutrients to stream ecosystems. Yet the in situ study of DOM is difficult as the molecular complexity of the DOM pool cannot be easily reproduced for experimental purposes. Nutrient additions to streams however, have been shown to repeatedly alter the in situ and ambient DOM pool. Here we demonstrate an easily replicable field-based method for manipulating the ambient pool of DOM at the ecosystem scale. During nutrient pulse experiments changes in the concentration of both dissolved organic carbon and dissolved organic nitrogen can be examined across a wide-range of nutrient concentrations. This method allows researchers to examine the controls on the DOM pool and make inferences regarding the role and function that certain fractions of the DOM pool play within ecosystems. We advocate the use of this method as a technique to help develop a deeper understanding of DOM biogeochemistry and how it interacts with nutrients. With further development this method may help elucidate the dynamics of DOM in other ecosystems.
Introduction
Dissolved organic matter (DOM) provides an important energy and nutrient source to freshwater ecosystems and is defined as organic matter that passes through a 0.7 µm filter. Within aquatic ecosystems, DOM can also influence light attenuation and metal complexation. DOM is a highly diverse and heterogeneous mixture of organic compounds with various functional groups, as well as essential nutrients such as nitrogen (N) and phosphorous (P). While the term "DOM" describes the entire pool including its C, N and P components, its concentration is measured as dissolved organic carbon (DOC). The inherent molecular complexity of the DOM pool however, creates challenges to its study. For example, there is no direct way to measure the fraction of the total DOM pool comprised of organic nutrients such as dissolved organic nitrogen (DON) and dissolved organic phosphorus (DOP). Instead, the concentration of organic nutrients must be determined by difference (e.g. [DON] = [total dissolved nitrogen] - [dissolved inorganic nitrogen]).
Adding a realistic DOM amendment to a stream is difficult due to the diversity of the ambient DOM pool. Previous studies have added single carbon sources (e.g. glucose, urea1) or a particular source such as leaf litter leachate2 to manipulate concentrations in the field. However, these sources are not particularly representative of the ambient DOM pool. Trying to refine or concentrate ambient DOM for subsequent experimentation is also wrought with difficulties including the loss of certain fractions (e.g. highly labile components) during processing. As a result, it is difficult to understand the controls on the ambient DOM pool as we currently do not possess any method to directly manipulate the ambient DOM pool. However, since the biogeochemistry of DOM is linked to nutrients commonly found in the environment (e.g. nitrate [NO3-]3), we can add other solutes to stream ecosystems and measure the response of the DOM pool to these manipulations. By examining how the DOM pool responds to a wide range of experimentally imposed nutrient concentrations we hope to gain better insight into how DOM responds to fluctuating environmental conditions.
One method commonly used in stream biogeochemistry is the nutrient addition method. Nutrient addition experiments have traditionally been used to understand uptake kinetics or the fate of the added solute4,5,6,7. Nutrient additions can be short-term on the hr6 to day scale4, or longer-term manipulations over the course of multiple years8. Nutrient additions can also include isotopically labelled nutrients (e.g. 15N-NO3-) to trace added nutrient through biogeochemical reactions. However, isotope-based studies are often expensive and require challenging analyses (e.g. digestions) of the multiple benthic compartments where isotopically-labeled nutrients may be retained. Recent experimentation has revealed the utility of short-term nutrient pulses to elucidate the controls on non-added and ambient solutes such as DOM9,10, revealing a new way by which to examine real-time in situ biogeochemical reactions. Here we describe and demonstrate the key methodological steps to conducting short-term nutrient pulses with the objective of understanding the coupled biogeochemistry of C and N and specifically the controls on the highly diverse DOM pool. This easily reproducible method involves adding a nutrient pulse to an experimental stream reach and measuring changes in the concentration of both the manipulated solute and the response variable of interest (e.g. DOC, DON, DOP). By directly manipulating nutrient concentrations in situ we are able to indirectly alter the DOM pool and examine how DOM concentration changes across a dynamic range of nutrient concentrations10.
Access restricted. Please log in or start a trial to view this content.
Protocol
1. Identifying and Characterizing the Ideal Experimental Stream Reach
- Ensure that experimental stream reaches are long enough to promote complete mixing of solutes11 and long enough where biological uptake can occur. Reach lengths can vary among streams and experiments. In small first-order headwater streams, reach length may vary from 20-150 m (or longer if the system requires it) depending on discharge and other physical properties of the stream.
- Exclude large pools from experimental reaches, as they retard the downstream movement of solutes, minimal flow sections, and tributaries that dilute the added solution. Times of low discharge may require shortening the reach length while higher discharge may require a longer reach.
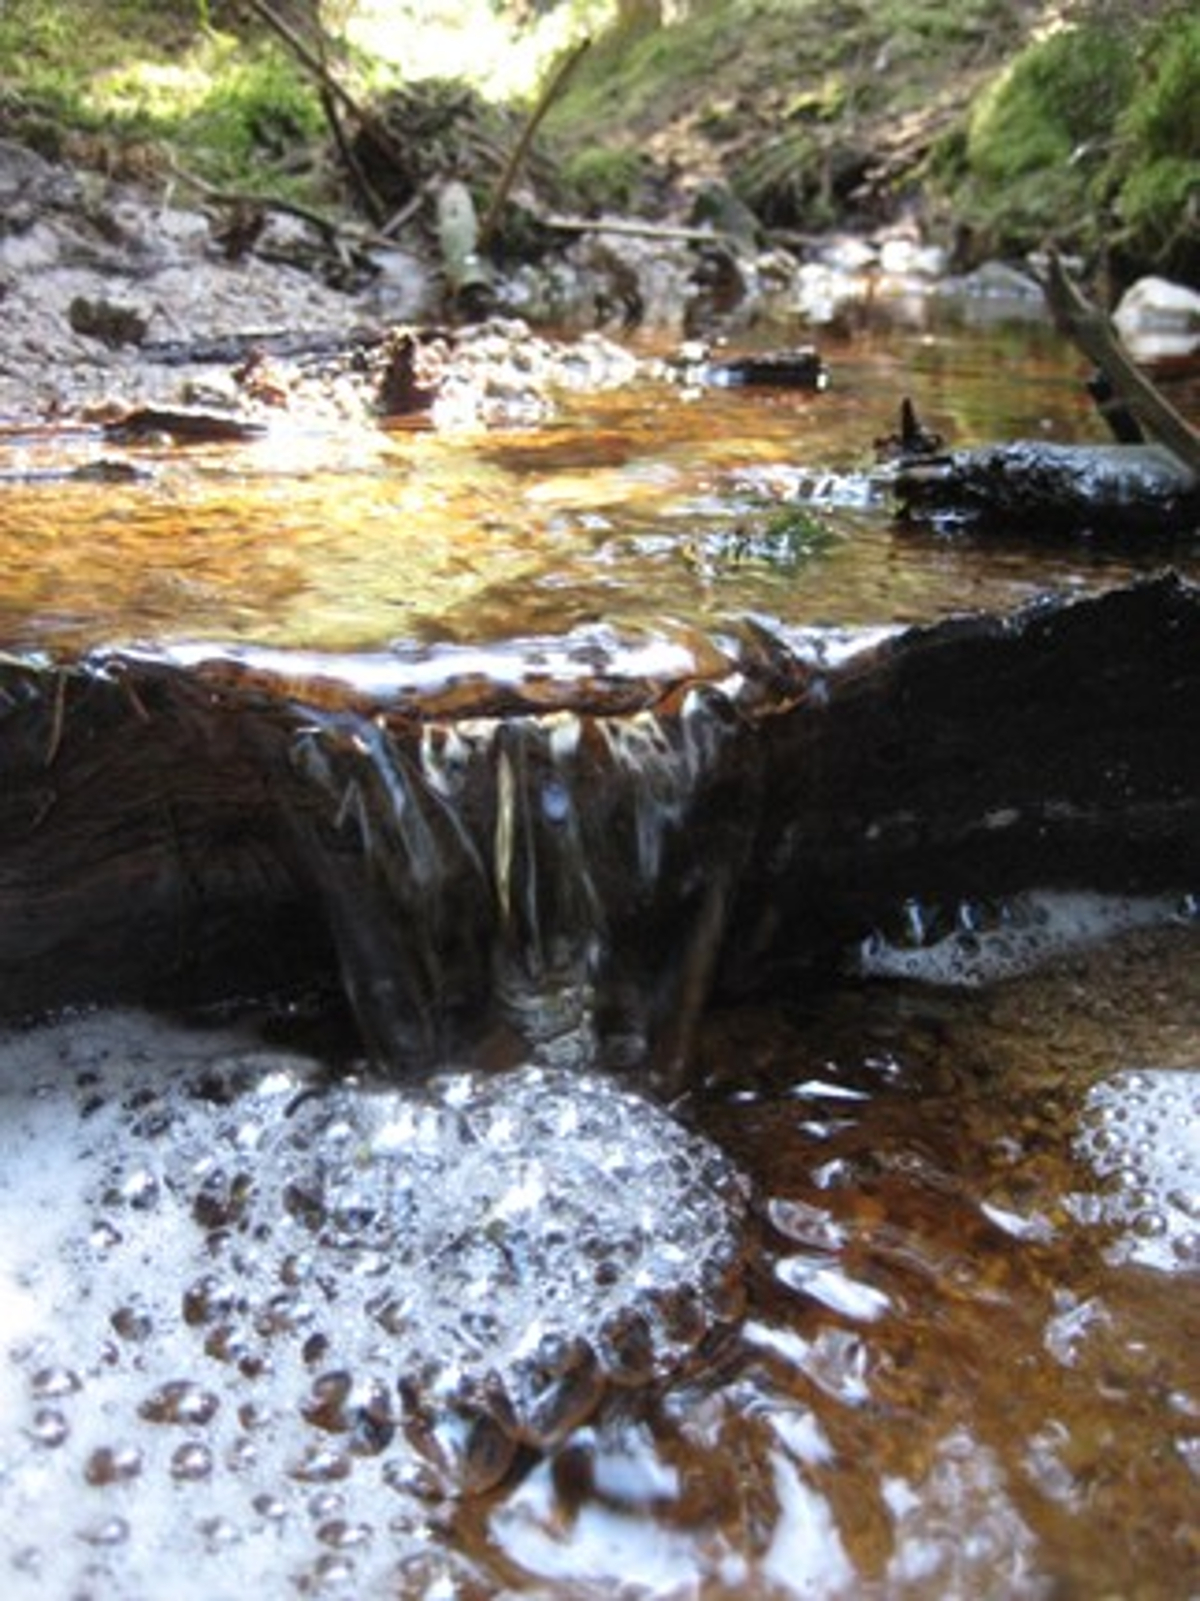
- Identify a location at the top of the experimental stream reach above a riffle to facilitate mixing of the added solutes. This will be the addition site. At the bottom of the experimental stream reach, identify a location where flow is constricted and representative of about 90% of the total flow (Figure 1). This will be the sample collection site.

Figure 1: Example of Downstream Sampling Site. An ideal sampling site is where the majority of flow is constricted and easily accessible without disturbance of the stream channel and benthos. Here a fallen piece of wood debris has created this sampling point in a small first-order headwater stream. Please click here to view a larger version of this figure.
- Obtain discharge measurement and background nutrient concentrations of the solutes of interest prior to experiments in order to calculate the mass of solutes needed for the manipulations. Please see calculations in step 2.2.1.
- Obtain background concentration data for the target solute of manipulation (e.g. NO3-) and chloride (Cl-) which is often used as the conservative tracer. Use the conservative tracer in the context of these experiments, to track changes in conductivity, which indicate the arrival of the nutrient pulse at the sampling station and the rate in which the pulse is passing through. Conductivity, or specific conductance, is a surrogate for in-situ changes in concentration of the conservative tracer.
- Characterize the physio-chemical properties of the experimental reach by collecting ancillary data such as reach width and depth, temperature, pH and dissolved oxygen.
- Perform measurements that cannot be made with the use of an environmental probe (e.g. width and depth), the day before or immediately after the experiment in order to minimize any benthic or chemical disturbance within the stream channel. Divide the experimental reach in equidistant transects (e.g. every 10 m) where width and at least 3 depth measurements can be assessed (e.g. right bank, thalweg, and left bank). These data are valuable to connect the physical properties of a stream to biogeochemical measurements and if the researchers are also interested in calculating nutrient uptake kinetics and parameters6.
2. Preparation for Experiment
- Determine the mass (kg) of solute required for manipulation using the outlined equations below.
Note: The example below applies to a nitrate-based experiment with NO3- in the form of sodium nitrate (NaNO3) and assumes a targeted increase of 3x above background (equations are based on those of Kilpatrick and Cobb12). In this example the following assumptions have been made with respect to background conditions: discharge = 10 L/sec; [Cl] = 10 mg/L; [NO3-] = 50 µg N/L. Due to variation among experiments, adjust required input data.- Calculate the Targeted increase (Equation 1):
Targeted [NO3- μg N/L] increase = expected background [NO3- μg N/L] * targeted increase
150 μg N/L = 50 μg N/L * 3 - Calculate the total atomic mass flux (Equation 2):
Total atomic mass flux (NO3- μg N) = 30 min * 60 sec * Q(L/sec) * targeted [NO3- μg N/L] increase
Where 30 minutes is the assumed duration of solute peak12 and Q is discharge
2 700 000 μg N = 30 min * 60 sec * 10 L/s * 150 μg N/L - Calculate the total molecular mass flux (Equation 3):
Total molecular mass flux (NO3- μg N) = total atomic mass flux (NO3- μg N)/atomic mass (14) * molecular weight (85)
Where atomic mass refers to N and molecular weight refers to NaNO3.
16,392,857.14 μg N = 2,700,000 μg N/(14 * 85) - Calculate the mass to add (Equation 4):
Mass to add (g) = total molecular mass flux (NO3- μg N)/1,000,000 g/μg
16.39 g NaNO3 = 16,392,857.14 μg N/1,000,000 g/μg
Note: Follow the above calculations for any other solutes including the conservative tracer (e.g. sodium chloride). Make sure to adjust the atomic and molecular masses for the solute of interest.
- Calculate the Targeted increase (Equation 1):
- Prepare all solutes one day prior to field experiments. Weigh out enough solutes to raise the ambient concentration of both the biological tracer and the conservative tracer three times (or desired amount) above background. It is important that the quantity of added solutes causes a measureable change above background concentration that is sufficient to create a wide dynamic range in added nutrient concentration.
- Weigh solutes using analytical scales and subsequently store in clean acid-washed high-density polyethylene bottles with appropriate labels. Examples of biological tracers include: NO3-: sodium nitrate (NaNO3); NH4+: ammonium chloride (NH4Cl); PO4-3: potassium phosphate (K2HPO4). However, the choice of biological tracer will be a function of the biogeochemical question being asked. Options for conservative tracers include sodium chloride (NaCl) and sodium bromide (NaBr).
- Collect remaining materials: field book, labeling tape and pen, field measuring tape, cooler, conductivity meter, ~ 20 L bucket and large stirring rod (e.g. beer paddle, rebar, large stick), approximately 50 clean and acid-washed 125 ml high-density polyethylene bottles. Label the 125 ml bottles #1-50.
Note: Less than 50 samples can be taken per experiment and background samples are included in the 50 total bottles. - Optional: Depending on the numbers of field personnel, perform sample filtering on-site (see section #5). If this option is chosen, bring 50 clean, pre-labeled and acid-washed 60 ml high-density polyethylene bottles into the field. Label the 60 ml bottles #1-50 to match the 125 ml collection bottles.
3. Day of Set Up
- Deploy the field conductivity meter at the collection site. Place the instrument upstream (approximately 0.5-1.0 m) of where samples will be taken so sample collection does not interfere with instrument readings. The meter will remain in place throughout the experiment. A field conductivity meter is best as it provides real-time conductivity readings, which are required to determine the sampling rate (see step 5.2) and filtration and analysis order (steps 5.3 and 6.1).
- Collect 125 ml background samples in triplicate at the addition site and at the collection site of the experimental reach prior to the addition of the solution. These data will be used to verify day-of ambient concentration and to determine variation in solute concentration along the stream reach. These data are also valuable to connect ambient stream chemistry (e.g. DOC: NO3- ratios13) to the biogeochemical measurements of interest.
- Record the time and conductivity of background samples collected.
- Record the background conductivity of stream prior to addition of solutions.
4. Adding Solutes
- Pour all reagents (16.39 g NaNO3 and 1483 g NaCl) into a large container (e.g. 20 L bucket) and add enough stream water to completely dissolve the solutes. Rinse reagent vessels thrice with additional stream water and pour rinse into solution container. Keep track of amount of water added.
- For example, use a 500 ml bottle to pour stream water into the container. Stir solution until all reagents have been completely dissolved.
- Collect 60 ml aliquot of the addition solution. Keep this highly concentrated sample separate (e.g. zip-lock bag) from all other samples to minimize cross contamination. Such samples are important if calculating nutrient uptake kinetics6 is an additional goal of the research project as these samples can be used to determine the exact mass of solutes added.
- Pour solution into addition site. Do this by pouring the solution in a smooth and quick motion to minimize travel lag time and splashing that could reduce the amount of reagents added. Rinse the container and the stir stick three times in the stream immediately after the addition to guarantee all reagents have been added to the stream.
- Record the time the solution was added: hr:min:sec.
- Record the masses of tracers added (e.g. NaNO3 and NaCl).
- After the solution has been added, do not disturb the stream. Make sure that all travel along the stream occurs on the banks to ensure that the stream benthos and the solution itself are not disturbed.
5. Field Sampling
- Order sampling bottles in ascending order while waiting for solution to arrive to the sampling location. Travel time will be a function of discharge and reach length and can be determined ahead of time (one-day prior) either with a NaCl-only injection or rhodamine dye (which can be used to establish travel time14).
Note: If working on a DON-themed project, avoid using rhodamine dye as it is a type of DON and will therefore alter the ambient DON pool if any remains in the study reach.

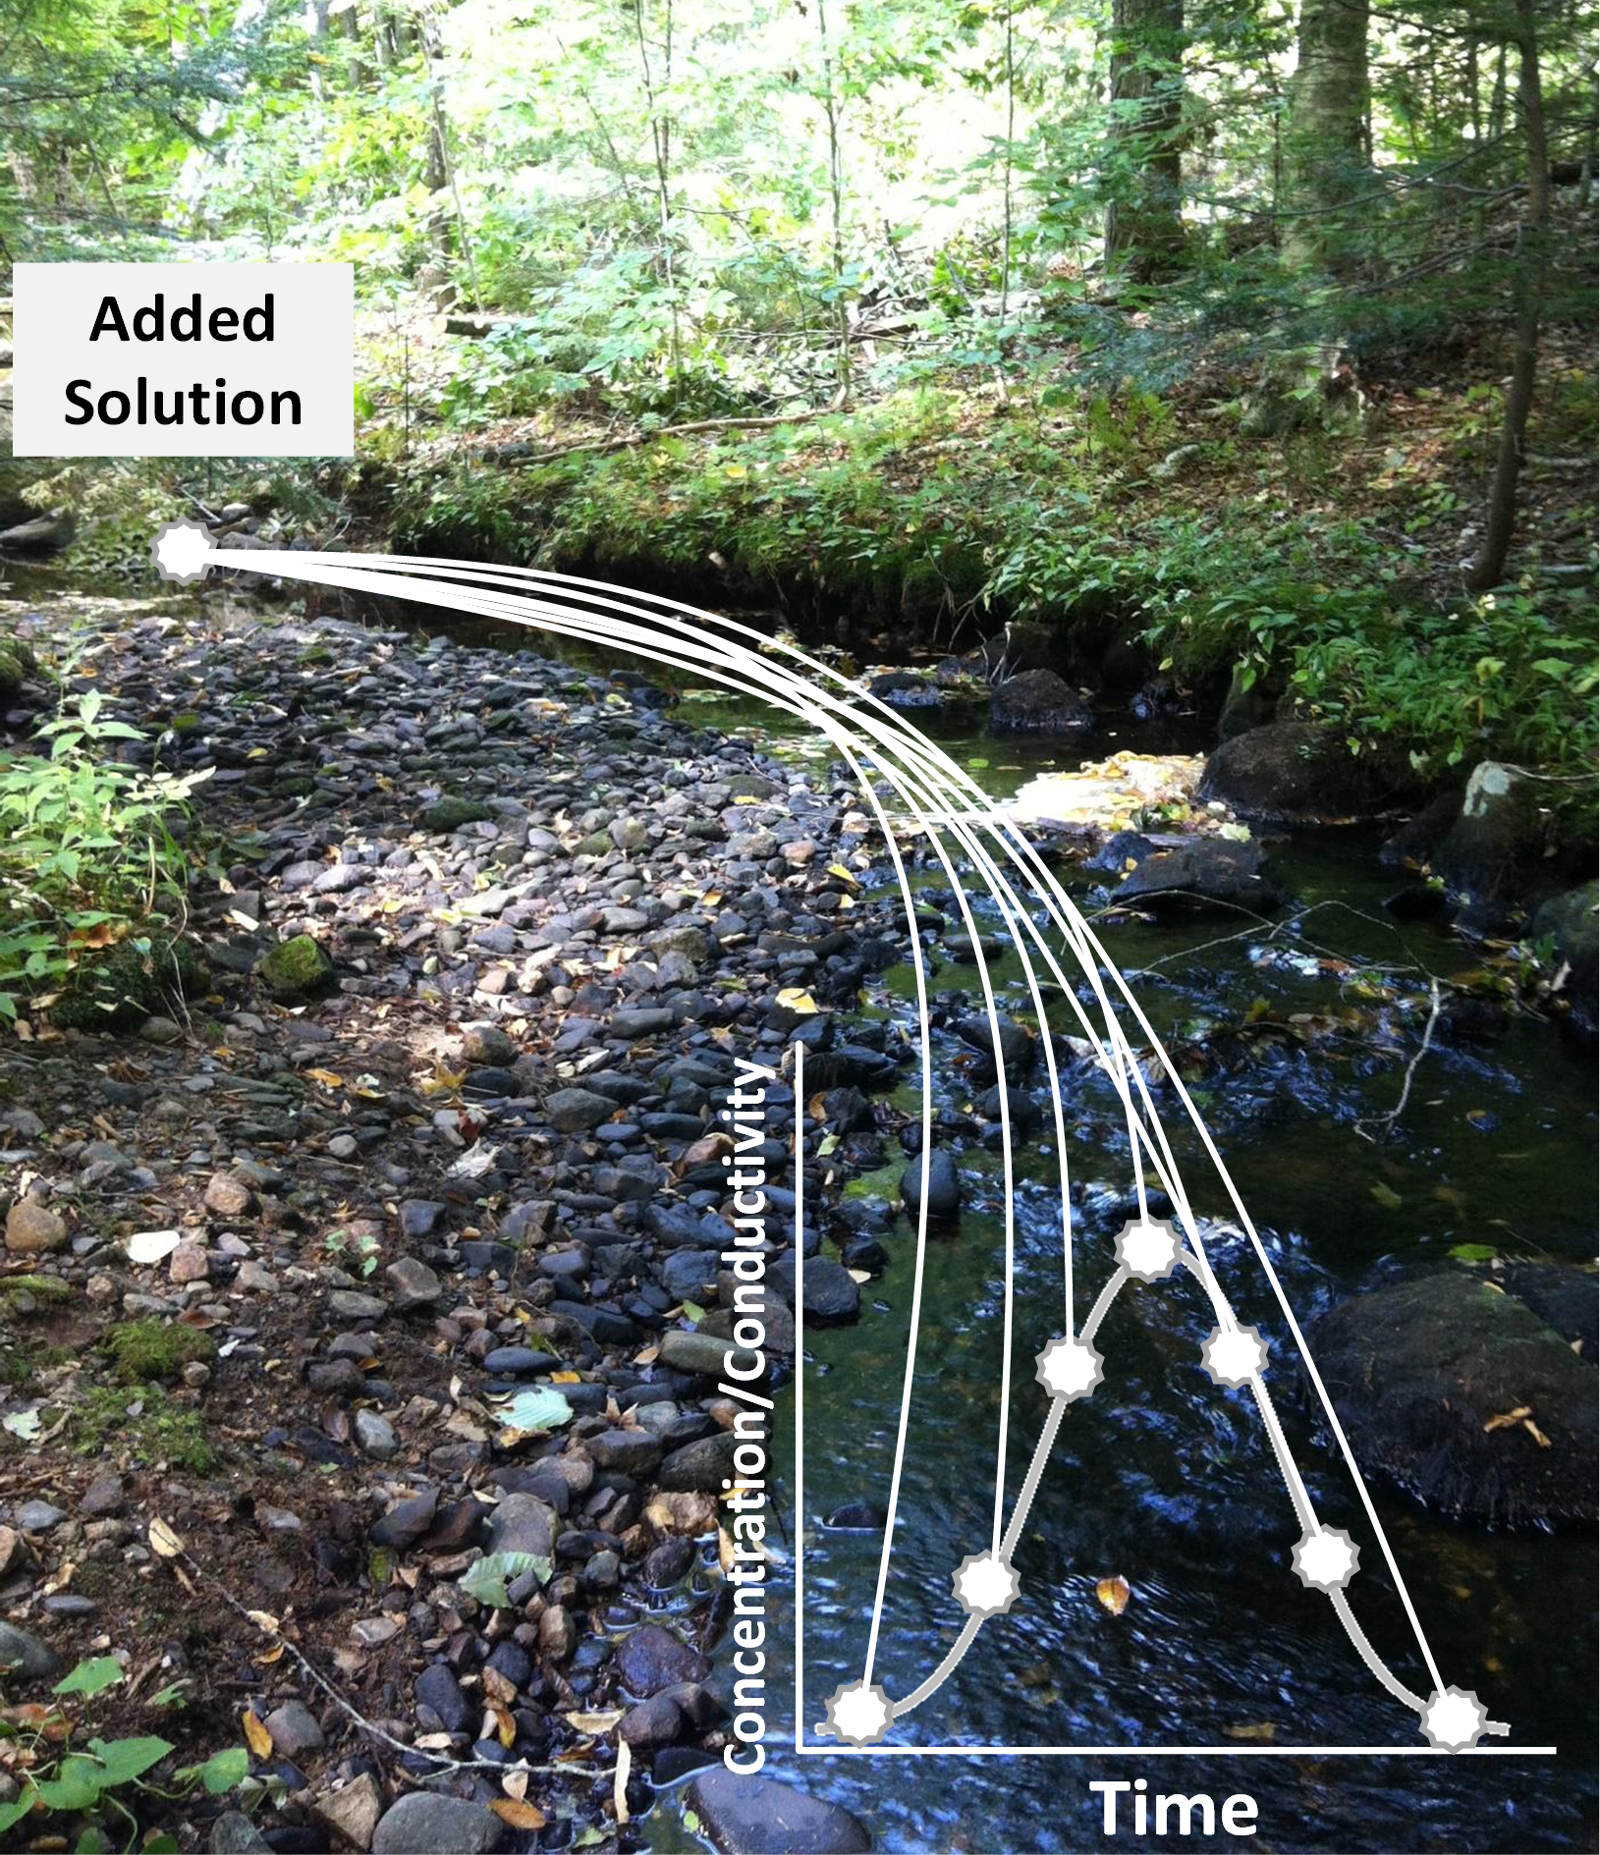
Figure 2: Example Schematic of Solute Breakthrough Curve (BTC). A BTC represents changes in solute concentration over time and can be used to explain the transit and biogeochemical cycling of a tracer in a stream. Grab samples should be taken across the BTC with a frequency that gives equal representation to both the ascending and descending limbs of the BTC. Please click here to view a larger version of this figure.
- Sample Collection
Note: The over-arching objective of sample collection, is to adequately represent changes in solute concentration along both the rising and falling limbs of the break through curve (BTC) (Figure 2).- Upon arrival of the solution (detected via an increase in conductivity), collect samples in 125 ml bottles throughout the BTC by holding a 125 ml bottle into the main flow of water at the sampling point. Quickly rinse the bottle with stream water and discard rinse downstream and then take sample. Cap sample and place into cooler.
- Record the time (hr:min:sec) and conductivity of each sample taken along the BTC into a field book (Table 1).
- Collect samples based on time (e.g. 1 min intervals) or based on the rate at which conductivity changes. For example, if conductivity is changing quickly, sample every 30-60 sec until changes in conductivity slow, at which time samples can be taken every 5-10 min. For intervals based on conductivity, take samples every 15-30 units depending on the rate at which conductivity is changing.
- Sample until conductivity returns to background or within 5 µS/cm of background conditions. Intervals of sample collection can be adjusted during the experiment as long as the BTC is well represented in the grab samples.
| Bottle # | Specific Conductance | Time | Notes |
| 1 | hr:min:sec | e.g. background (downstream) | |
| 2 | e.g. background (downstream) | ||
| 3 | |||
| 4 | |||
| 5 | e.g. sample at peak conductance | ||
| . | |||
| . | |||
| . | |||
| Highest Bottle # |
Table 1PField book: Example Page from Lab Book and Required Information
- Sample Filtering
Note: Filtering of samples can occur either in the field or upon returning to the laboratory.- Filter samples from the rising limb in order of ascending specific conductivity until the peak in specific conductivity. Wait for the experiment to be over and filter samples from the falling limb in ascending order of specific conductivity (i.e. start with the last sample and work backwards toward peak specific conductivity).
Note: This order of samples minimizes cross contamination between samples and allows for the same filter, syringe, and filter holder to be used as long as the filter, syringe and filter holder are appropriately rinsed in between each sample (see steps 5.3.2-5.3.4). - Remove plunger from a 60 ml syringe and then close stop-cock. Pour ~10 ml of sample into syringe and return plunger to syringe. Shake syringe so that sample rinses internal walls of syringe. Attached syringe to filter-holder and open stop-cock. Push sample through filter-holder and discard rinse.
- Remove plunger and close stop-cock. Pour ~30 ml of sample into syringe and return plunger to syringe. Open stock-cock and expel ~10 ml through filter-holder and into 60 ml sampling bottle. Cap the bottle, swirl with filtrate and discard. Repeat this step for a total of 3 rinses. This will ensure any impurities have been removed from the 60 ml sample bottle and that the walls are coated with sample.
- Remove plunger and close stop-cock. Pour ~60 ml of sample into syringe and return plunger to syringe. Push the sample through the filter holder and into the 60 ml sample bottle. Fill bottles up to the shoulder to prevent cracking of bottles when frozen. Cap bottle and place into cooler.
- Repeat steps 5.3.2-5.3.4 for all remaining samples. Change filter between rising and falling limb samples to minimize contamination.
- Transport samples back to the laboratory on the same day and on ice.
- Filter samples from the rising limb in order of ascending specific conductivity until the peak in specific conductivity. Wait for the experiment to be over and filter samples from the falling limb in ascending order of specific conductivity (i.e. start with the last sample and work backwards toward peak specific conductivity).
6. Preparation for Laboratory Analysis
- If filtering of samples is to occur in the laboratory, follow protocol as outlined in section 5.3.1. Filter samples from both the ascending and descending limbs of the BTC in order of increasing conductivity. Change the filter between rising limb and falling limb samples.
- Freeze filtered samples at -20 °C until analysis.
- Ensure that analytical facilities are equipped to handle highly concentrated samples.
Note: Some laboratories are not equipped to run highly concentrated samples and thus care should be taken. Incorporate prepared standards that capture that higher end of expected solute concentrations. High concentration standards will help to ensure a standard curve that captures the expected range of manipulated solute concentrations. - Analyze samples from low to high conductivity on all analytical instruments. Ordering samples from low to high specific conductance prevents contamination of low salt/nutrient samples by high salt/nutrient samples. This means samples from the rising and falling limbs will be mixed with respect to sequence.
- Analyze samples for total dissolved organic carbon, total dissolved nitrogen, nitrate and ammonium, although the exact combination of solute analysis will be a function of the research question (see Wymore et al.10 for example).
7. Data Analysis
- Analyze the data using simple linear regression. The independent variable is the concentrations of the added nutrient and the dependent variable is DOM concentration either as DOC or DON. Each point on the figure represents one grab sample from the breakthrough curve and that sample's nutrient and DOC/DON concentration.
Access restricted. Please log in or start a trial to view this content.
Results

Figure 3: Example Results from Nitrate (NO3-) Additions with Dissolved Organic Nitrogen (DON) as the Response Variable. Analyses are linear regressions. Asterisks represent statistical significance at α = 0.05. Note the dynamic range in NO3- concentration that was achieved with the nutrient pulse method. Different pane...
Access restricted. Please log in or start a trial to view this content.
Discussion
The objective of the nutrient pulse method, as presented here, is to characterize and quantify the response of the highly diverse pool of ambient stream water DOM across a dynamic range of an added inorganic nutrient. If the added solute sufficiently increases the concentration of the reactive solute, a large inferential space can be created to understand how the biogeochemical cycling of DOM is linked to nutrient concentrations. This nutrient pulse approach is ideal as it involves none of the machinery associated with p...
Access restricted. Please log in or start a trial to view this content.
Disclosures
The authors have nothing to disclose.
Acknowledgements
The authors acknowledge the Water Quality Analysis Laboratory at the University of New Hampshire for assistance with sample analysis. The authors also thank two anonymous reviewers whose comments have helped to improve the manuscript. This work is funded by the National Science Foundation (DEB-1556603). Partial funding was also provided by the EPSCoR Ecosystems and Society Project (NSF EPS-1101245), New Hampshire Agricultural Experiment Station (Scientific Contribution #2662, USDA National Institute of Food and Agriculture (McIntire-Stennis) Project (1006760), the University of New Hampshire Graduate School, and the New Hampshire Water Resources Research Center.
Access restricted. Please log in or start a trial to view this content.
Materials
| Name | Company | Catalog Number | Comments |
| Sodium Nitrate | Any | Any | |
| Sodium Chloride | Any | Any | Store purchased table salt can be used as well, however, it does contain trace levels of impurities |
| Whatman GFF glass-fiber filters | Any | Any | |
| BD Filtering Syringe | Any | Any | |
| EMD Millipore Swinnex Filter Holders | Any | Any | |
| Syringe stop-cock | Any | Any | |
| YSI Multi-parameter probe | Yellow Springs International | 556-01 | |
| Wide mouth HDPE 125 ml bottles | Any | Any | |
| 60 ml HDPE bottles | Any | Any | |
| 20 L bucket | Any | Any | |
| Field measuring tape | Any | Any | |
| Lab labeling tape | Any | Any | |
| Stir stick | Any | Any | |
| Cooler | Any | Any | |
| Sharpie pen | Any | Any | |
| Field notebook | Any | Any | |
| Tweezers | Any | Any | |
| Zip-lock bags | Any | Any |
References
- Brookshire, E. N. J., Valett, H. M., Thomas, S. A., Webster, J. R. Atmospheric N deposition increases organic N loss from temperate forests. Ecosystems. 10 (2), 252-262 (2007).
- Bernhardt, E. S., McDowell, W. H. Twenty years apart: Comparisons of DOM uptake during leaf leachate releases to Hubbard Brook Valley streams in 1979 and 2000. J Geophys Res. 113, G03032(2008).
- Taylor, P. G., Townsend, A. R. Stoichiometric control of organic carbon-nitrate relationships from soils to sea. Nature. 464, 1178-1181 (2010).
- Mulholland, P. J., et al. Stream denitrification across biomes and its response to anthropogenic nitrate loading. Nature. 452, 202-205 (2008).
- Tank, J. L., Rosi-Marshall, E. J., Baker, M. A., Hall, R. O. Are rivers just big streams? A pulse method to quantify nitrogen demand in a large river. Ecology. 89 (10), 2935-2945 (2008).
- Covino, T. P., McGlynn, B. L., McNamara, R. A. Tracer additions for spiraling curve characterization (TASCC): quantifying stream nutrient uptake kinetics from ambient to saturation. Limnol Oceanogr. 8, 484-498 (2010).
- Johnson, L. T., et al. Quantifying the production of dissolved organic nitrogen in headwater streams using 15 N tracer additions. Limnol Oceanogr. 58 (4), 1271-1285 (2013).
- Rosemond, A. D., et al. Experimental nutrient additions accelerate terrestrial carbon loss from stream ecosystems. Science. 347 (6226), 1142-1145 (2015).
- Diemer, L. A., McDowell, W. H., Wymore, A. S., Prokushkin, A. S. Nutrient uptake along a fire gradient in boreal streams of Central Siberia. Freshwater Sci. 34 (4), 1443-1456 (2015).
- Wymore, A. S., Rodríguez-Cardona, B., McDowell, W. H. Direct response of dissolved organic nitrogen to nitrate availability in headwater streams. Biogeochemistry. 126 (1), 1-10 (2015).
- Stream Solute Workshop. Concepts and methods for assessing solute dynamics in stream ecosystems. J N Am Benthol Soc. 9 (2), 95-119 (1990).
- Kilpatrick, F. A., Cobb, E. D. Measurement of discharge using tracers: U.S Geological Survey Techniques of Water-Resources Investigations. , http://pubs.usgs.gov/twri/twri3-a16 (1985).
- Rodríguez-Cardona, B., Wymore, A. S., McDowell, W. H. DOC: NO3- and NO3- uptake in forested headwater streams. J Geophys Res - Biogeo. 121, (2016).
- Kilpatrick, F. A., Wilson, J. F. Book 3 Chapter A9, Measurement of time of travel in streams by dye tracing. Techniques of Water-Resources Investigations of the United States Geological Survey. , (1989).
- Lutz, B. D., Bernhardt, E. S., Roberts, B. J., Mulholland, P. J. Examining the coupling of carbon and nitrogen cycles in Appalachian streams: the role of dissolved organic nitrogen. Ecology. 92 (3), 720-732 (2011).
- Michalzik, B., Matzner, E. Dynamics of dissolved organic nitrogen and carbon in a Central European Norway spruce ecosystem. Eur J Soil Sci. 50 (4), 579-590 (1990).
- Solinger, S., Kalbitz, K., Matzner, E. Controls on the dynamics of dissolved organic carbon and nitrogen in a Central European deciduous forest. Biogeochemistry. 55 (3), 327-349 (2001).
- Kaushal, S. S., Lewis, W. M. Patterns in chemical fractionation of organic nitrogen in Rocky Mountain streams. Ecosystems. 6 (5), 483-492 (2003).
- Kaushal, S. S., Lewis, W. M. Fate and transport of organic nitrogen in minimally disturbed montane streams of Colorado, USA. Biogeochemistry. 74 (3), 303-321 (2005).
Access restricted. Please log in or start a trial to view this content.
Reprints and Permissions
Request permission to reuse the text or figures of this JoVE article
Request PermissionThis article has been published
Video Coming Soon
Copyright © 2025 MyJoVE Corporation. All rights reserved