Method Article
Continuous-Wave Propagation Channel-Sounding Measurement System - Testing, Verification, and Measurements
In This Article
Summary
This report describes the setup, validation and verification, and results from propagation measurements using a continuous-wave, radio frequency channel-sounding measurement system.
Abstract
Channel sounders are used to measure channel characteristics for radio systems. There are several types of channel sounders used today: continuous-wave (CW), direct pulse, frequency domain using a vector network analyzer (VNA), correlation-based, and swept-time delay cross-correlator. Each of these has unique advantages and disadvantages. CW systems have a larger dynamic range than other systems with a signal that can propagate further into the environment. As the audio sampling rates allow smaller file sizes than other systems, data collection can be continuous and last for several hours. This article discusses a CW-channel sounder system, which has been used to make numerous propagation loss measurements in various cities in the United States of America. Such propagation measurements should be accurate, reproducible, and free of artifacts or biases. This article shows how to set up the measurement, how to validate and verify that the system is making reliable measurements, and finally, it shows results from some of the measurement campaigns such as repeatability measurements, clutter loss measurements (where clutter loss is defined as the excess loss from free-space transmission loss), and reciprocity measurements.
Introduction
The Institute for Telecommunication Sciences (ITS) is the research laboratory of the National Telecommunications and Information Administration (NTIA), an agency of the U.S. Department of Commerce. ITS has a long history of conducting accurate, well-regarded radio frequency (RF) propagation measurements. The increase in spectrum-sharing has been accompanied by the need for accurate, reproducible measurements that provide a better understanding of the radio environment that multiple services will have to share. For the past few years, the military services have been developing spectrum-sharing arrangements with commercial wireless carriers in the Advanced Wireless Services (AWS)-3 band (1755-1780 MHz)1. This will allow commercial wireless carriers to use the AWS-3 band prior to phasing military services out of the band. The use of the band will be coordinated by both isolating systems geographically and by modeling frequency interference scenarios. To share this band of spectrum, propagation measurements are necessary to develop and improve propagation models for the evaluation of RF interference between the military and commercial wireless systems within the band.
The Defense Spectrum Organization (DSO) is responsible for the management of the AWS-3 transition and has tasked ITS and others with performing a series of channel-sounding measurements. These measurements will be used to build new models for the calculation of the impact of foliage and man-made structures in the environment (collectively known as clutter). Improved propagation modeling that accounts for clutter could lead to fewer restrictions on commercial transmitters in the vicinity of military systems. The CW-channel-sounder system discussed in this article has been used for the past five years to collect radio propagation measurement data and calculate the clutter attenuation. This measurement system produces accurate, repeatable, and unbiased results, and DSO encouraged ITS to share its institutional knowledge-including best measurement practices for the measurement and processing of RF propagation data-with the wider technical community.
Best measurement practices require understanding a system from the component level to the assembled-system level. These best measurement practices have been documented in the recently published NTIA Technical Memorandum TM-19-5352 that describes a set of best practices for the preparation and verification of radio propagation measurement systems. ITS recently completed a JoVE article on calibrating a VNA used to measure component losses and identify bad components for this measurement system3. This article is a continuation in documenting these best measurement practices for the wider community. Although best practices are discussed in this article for a CW-channel sounder, these same techniques can be used to verify other channel sounder systems: VNA systems; CW systems; full-bandwidth, correlation-based systems; direct pulse systems; and sliding correlator-based systems4,5,6.
This article describes in detail how to setup a CW-channel sounder measurement system using a vector signal analyzer (VSA), a spectrum analyzer (SA), two rubidium oscillators, a power meter, a vector signal generator (VSG), and various filters and power dividers for measurements in an outdoor measurement environment7,8. The transmitting side of the system consists of the VSG, which generates a CW signal that is boosted by a power amplifier. This is then split by a directional couple to divert some of the signal to the power meter, which allows the user to monitor the system output. The rest of the signal is sent to the receiving side of the system via the propagation channel. The receiving side consists of a low-pass filter to reduce interference and harmonics produced by the power amplifier. The filtered signal is split in a power divider and fed into the SA for monitoring during the measurement along with a time stamp and Global Positioning System (GPS) location. The other half of the signal is sent to the VSA to be downconverted into in-phase quadrature (I-Q) data in the range of 1-5 kHz. The sampling rate is determined by the instrument span9 and is guided by the expected Doppler spectrum shifts, which are a function of the speed of the vehicle. The resulting time series is then transferred to a computer for postprocessing and data analysis.
Rubidium clocks are used at both the transmitter and receiver to provide highly accurate measurements and highly stable frequencies. The rubidium clock at the receiving end has a fine frequency adjustment for the precise alignment of the transmitting and receiving frequencies. Typically, the frequencies are adjusted to be within 0.1 Hz of each other for testing. Rubidium clocks are essential for high-accuracy CW propagation measurements. They ensure precise time base accuracy over the course of the measurements and prevent frequency drift of the transmitter and receiver. This article also details how to validate and verify that a system is making accurate measurements in a laboratory setting, both with and without an antenna, prior to making measurements in an outdoor environment. The system has been used for an extensive series of outdoor and indoor tests at frequencies ranging from 430 MHz to 5.5 GHz and for many different transmitting powers7,8,10.
Protocol
NOTE: The ITS channel sounder system is shown in Figure 1 and Figure 2, and a benchtop evaluation setup is shown in Figure 3. Reference these figures while setting up the CW-channel sounder to ensure all components are properly configured. The following sections explain how to verify and validate a system prior to making measurements.
1. Measurement system setup
NOTE: This section describes how a system is set up for field measurements. First, system losses in both the transmitting and the receiving side of the system must be accounted for and measured separately before the full system is assembled. Then, the full system is assembled, and individual instruments are configured, calibrated, and synchronized to prepare for lab verification and validation.
- Measure the S-parameters, using a VNA2, for individual system components before assembling the system: cables, attenuators, power splitters, directional couplers, and low-pass filters.
NOTE: This will characterize losses and identify broken cables, or a device out of specification. - Assemble the Type N cable at the output of the power amplifier, the directional coupler, the bandpass filter, and the Type N cable that will be connected to the antenna, and use the VNA to measure the component chain.
NOTE: This measurement will include internal reflections that are not seen by measuring individual components with a VNA. - Record the S21 value, which will be a negative number, and will be used as the transmitting system losses. Use these values to correct the received signal level discussed in the representative results section.
- Transmitting system setup
- Plug in all devices to a power source: either an uninterruptible power supply (UPS) or a surge-protected set of outlets. Make sure that all instruments are in a powered off state while hooking components together.
- Assemble the transmitting equipment (Figure 1).
- Connect the 10 MHz output of the rubidium oscillator to the Ref IN port of the VSG using a Bayonet-Neill-Concelman (BNC) cable. Connect RF OUT port of the VSG to the input of the directional coupler IN port using a Type N cable. No power amplifier is inserted until Protocol Step 3.2.
- Connect the OUT port of the directional coupler to the input port appropriate bandpass filter (if needed) using a Type N female to female connector.
NOTE: A bandpass filter is used to minimize harmonic frequencies in other bands.
- Assemble the Type N cable that will be connected to the receiving antenna, the filter, the cable between the filter and the power splitter, and the Type N cable that will be connected to the VSA; use the VNA to measure this system of components.
- Make the same measurement, but through the same components connected to the SA. Record the S21 values, which will be used as the receiving system losses on the VSA side of the power splitter and the SA side of the power splitter. Use these values to correct the received signal level discussed in the representative results section.
- Receiving system setup
- Plug in all devices to a power source: either a UPS or a surge-protected set of outlets. Make sure all instruments are in a powered off state while hooking components together.
- Assemble the receiving equipment (Figure 2).
- Connect a Type N cable to the input of the bandpass filter. Connect the output of the bandpass filter to the input of the power divider (port 1).
- Connect port 2 of the power divider to the RF IN port on the VSA. Connect port 3 of the power divider to the RF IN port on the SA.
- Using a BNC to banana plug cord, connect the Frequency Adj of the rubidium oscillator to the DC OUT of the direct-current (DC) power supply.
- Connect a 10 MHz output of the rubidium oscillator to the Ext Ref In port on the VSA using a BNC cable. Connect a 10 MHz output of the rubidium oscillator to the Ext Trig/Ref In port on the spectrum analyzer.
- Power on the VSG and ensure that it is set to RF OFF. Power on the power meter. Turn all instruments on, and allow the instruments to warm up for an hour before making any measurements.
- Configure the VSA in VSA 89601B mode. While in VSA mode, set the center frequency to the CW frequency of interest. Finally, select the number of points taken with the desired length of the overall measurement in mind.
NOTE: Although the system operates using a CW, the span must be set to capture any Doppler shifts and fading. The resolution bandwidth determines the filter used by the VSA to measure power as it sweeps across the frequency span, so selecting a low-resolution bandwidth allows a more precise measurement. As a tradeoff, a lower resolution bandwidth takes a greater time per point. - Configure the VSA with the following settings: select VSA 89601B mode; center Frequency: Freq MHz (e.g., 1770 MHz); span: 3 kHz; TimeLen: 1 s; ResBW: 3.81938 Hz; NumPts: max (491026 pts, 409601 pts)-depends on VSA; Rng: -42 dBm; top graph upper scale value: -30 dBm.
- Ensure that the SA is controlled by instrument control software that uses programmable standard commands for programmable instruments (SCPI) commands, so that continuous sweeps can be collected and saved.
- Set the SA such that the start and stop frequencies match the VSA center frequency. As the RBW similarly determines the filter size used by the SA, set the RBW to the same value as the span of the VSA measurement.
- Set the video bandwidth to the same value as the resolution bandwidth and the detection mode to sample to record unaveraged data. Leave attenuation off, making sure the SA will not be overloaded, and keep the preamp on.
- Configure the SA with the following for each sweep: StartFreq: Same center frequency as in the VSA setup (e.g., 1770 MHz); StopFreq: Same center frequency as in the VSA setup (e.g., 1770 MHz); RBW (MHz): 0.003; VBW (MHz): 0.003; detector: sample; sweep time: 500 ms; pts/trace: 461; preamp ON; attenuation: 0; auto attenuation: Off.
- On the SA, press Enter to access the menus. Enable External Reference by pressing the Shift button and selecting the System button on the spectrum analyzer. Then, select More | Port Settings | Ext Input | Ref using the softkeys near the screen.
- Configure the VSG by selecting a CW output.
- Set the frequency to 1770 MHz. Follow the procedure in section 4.22 to determine the linear range of the power amplifier.
- Set the VSG output amplitude to -4 dBm, the upper limit to the linear range of the power amplifier.
- Calibrate the power meter.
- Plug the power meter head into the reference port (channel A or B) and the other end of the power meter into a measurement port.
- Set the power meter frequency to 1770 MHz for the reference port used above. Zero and calibrate the power meter. Ensure the power meter reading remains within 0.2 dB of 0 dBm.
- Unplug the power meter head from the reference port, and connect the power meter head to the output of the attenuator shown in Figure 1.
- Calibrate the VSA: Utilities | Calibration | Calibration. Turn RF ON the VSG.
NOTE: Make sure there is a signal on the spectrum analyzer. If the signal level drops down to -120 dBm, the external reference is not on. If the signal is too strong, it will overload the receiving system and damage either the VSA or SA. Be aware of maximum input signal levels (usually shown on the front of the instrument), and stay at least 10 dB below this level. - Synchronize the rubidium oscillators by setting the voltage, but do not exceed the maximum input voltage allowed on the rubidium synchronization port.
- Change TimeLen on the top graph on the VSA screen to 100 ms. Set the y-axis on the bottom plot to I-Q.
- Press Current/Voltage on the front panel of the power supply. Change the voltage a little at a time and watch the dot on the VSA screen: if it rotates back and forth, do nothing, the frequencies are aligned. If it rotates in one direction consistently, change the power meter reading (voltage) until the dot on the I-Q plot starts to slow down, and it moves slowly back and forth (pendulum motion) (Figure 4).
- Set TimeLen on the top graph on the VSA screen back to 1 s, and set the y-axis back to Log Magnitude.
- Take 10 records of acquisition on the SA to verify that all parameters have been set correctly, and that the signal level on the SA screen matches the signal level on the VSA lower screen.
2. Lab verification and validation
- Without attaching antennas, insert a variable attenuator between the transmitting side of the system and the receiving side of the system (Figure 5). Remove the power amplifier from the measurement setup for this verification.
- Set the stepped attenuator attenuation to 0 dB and the number of records on the VSA Input > Recording to 120.
NOTE: One record is equal to the TimeLen set on the VSA. - Set the number of sweeps on the SA to 120 records. Change the output amplitude of the VSG to 0 dBm, and press the RF ON button on the VSG.
- Set a peak marker to find the value of the signal strength, and verify a signal is seen on the VSA. Start the VSA by hitting the Record button at the top of the screen. Start an SA measurement using the instrument control software.
- Change the stepped attenuator to 10 dB, and repeat steps 4-10. Go through all settings of the stepped attenuator and record the values for each attenuation setting.
NOTE: As the attenuator approaches 90 to 110 dB, the signal will get noisier as it approaches the system noise floor of the instrument. Measurement values near the noise floor of the system will be highly variable. - To verify the VSA received signal levels, calculate a 0.5 s windowed average to the 120 s VSA record, and average each sweep of the SA. Add the VSG output power level, the transmitting side and receiving side system losses, and the stepped attenuator setting.
NOTE: The value of the aforementioned sum in step 2.6 should equal the averaged received signal levels recorded by the VSA and the SA within 0.5 dB, for stepped attenuations less than 80 dB. If they do not, go back and remeasure system losses.
3. Field measurements
NOTE: Always test and verify the system before every measurement campaign.
- Complete steps 1.1-1.3 before each new measurement campaign, and set up the transmitting side of the system, as discussed in section 1.4.
NOTE: This is typically housed in a cellular-on-wheels (COW), which remains fixed during measurements. - Connect the power amplifier between the VSG and the directional coupler, as described in step 1.4.2.1.
- Use a directional coupler that can handle the power levels generated by the power amplifier. Add a 50 dB attenuator to the directional coupler at the coupled port to stay within the specified input power levels of the power meter, and attach the power meter to this port. Connect the output Type N cable from the directional coupler to the transmitting antenna.
- Set up the receiving side of the system, as discussed in steps 1.5-1.6, inside a mobile vehicle. Connect the receiving antenna to the Type N cable connected to the filter.
- In addition to the SA setup steps 1.11.3-1.11.4, the GPS antenna needs to be set up in the SA.
- Enable the GPS record: Meas Settings | Enable GPS Record | Standard GPS.
- Enable GPS on the spectrum analyzer by holding the Shift button and selecting the System button on the spectrum analyzer. Then, select More | GPS | GPS-ON & GPS Info-ON using the softkeys near the screen.
- Place the GPS antenna on the roof of the receiver measurement vehicle. Ensure that the measurement software also reads in NMEA strings from the GPS for each sweep.
- Continue the setup as discussed in steps 1.11-1.17, and set the number of records on the VSA Input | Recording based on estimated measurement time. Set the number of SA records to the number of VSA records plus about 300 records, noting that the SA sweeps slower than the VSA.
- Begin the measurement by first starting the VSA by pressing the Record button at the top of the screen. Initiate the spectrum analyzer measurement.
- After the measurement, save the VSA recording file | Save | Save Recording. Save Options | Save Headers with Data. When saving the file, append a _VSA to the end of the file. Change the name of the data file for the spectrum analyzer to match the filename of the VSA, but append _SA for the spectrum analyzer.
Results
The following results were obtained during a field verification of the presented system. The transmitter was located on the Kohler Mesa behind the Department of Commerce Boulder Laboratories in Boulder, Colorado. The receiver was driven through Boulder, Colorado, in a specially designed measurement vehicle (see Figure 6), and continuous measurements were taken. The SA stores the swept data as log magnitude format in an event data structure, while the GPS data are stored in a separate event data structure within in the same file. An example of data for one sweep is shown in Figure 7. The stored data are converted to linear power in Watts; a mean is computed for all points in that sweep and then converted back to log magnitude. The GPS information is assigned to this mean value for the sweep shown by the red X at a value of −71.5 dBm. This process is done for every sweep in the file.
Next, the baseband I-Q data from the VSA are processed as shown in equation 1. The power in dBm is calculated for every I-Q sample. The VSA collects peak data, which must be converted to dBm, during this step.
 (1)
(1)
During the measurement, the baseband I-Q data are stored in a temporary file. No GPS information is acquired by the VSA. The length of the file is chosen such that the number of records requested is equal to the number of seconds of drive time. Once the measurement has finished, the data are written to a file whose structure is preprogrammed by the VSA software developers. Data saved into this file include the time difference between measurement samples, the frequency, and the complex data samples. The processing step involves the smoothing of the magnitude of the baseband I-Q data over a 500 ms window for the entire data set to approximate a 40-wavelength driving distance. Figure 8 shows how the smoothed mean power compares to the raw data for a larger portion of a drive test. The raw data are shown by the blue trace, and the smoothed mean power is shown by the red trace.
The VSA and SA data sets are aligned using a circular convolution. The VSA data point at each second is aligned with the SA samples generated at each second to transfer the GPS coordinates from the SA to the VSA data points. A linear regression model aligns the data by minimizing the residuals between the measured power levels of the two data sets. The aligned data are presented by plotting the SA power in dBm on the x-axis and the VSA power in dBm on the y-axis (Figure 9). As the SA system noise floor is higher than the VSA system noise floor, the graph will show a downward curvature at points below approximately -115 dBm for data sets close to the noise floor. Figure 9 and Figure 10 show the alignment of the VSA power and the SA power vs. the elapsed time in seconds. The GPS time stamp from the SA mean power is then attached to the first data point of the VSA average-smoothed power data series. The vertical offset between the two data sets is eliminated by correcting for cable loss from the power divider to the SA; however, as only the time-stamped VSA data are used, this extra step is unnecessary. These data are then saved and used in the Longley-Rice/Irregular Terrain Model (ITM)11,12 to predict terrain losses. The VSA data are corrected by adding system losses and removing system gains to obtain the measured basic transmission loss (BTL) or basic transmission gain (BTG) along the drive route as shown in Figure 11 and Figure 12 and given by equation 2.
 (2)
(2)
where, BTL is the basic transmission loss, Pt and Pr are the transmitting and receiving powers in dBm, Gt and Gr are the gains of the transmitting and receiving antennas in dBi, respectively, and Lt and Lr are the system losses for the transmitting system and receiving system in dB, respectively.
In Figure 11, the purple star is the transmitting location. The yellow and purple dots represent the highest and lowest received signal levels, respectively. A plot of the measured BTG (black x's), the ITM-modelled BTG (blue +'s), free-space transmission gain (FSTG) (red circles), and the system noise floor (pink dots) is shown in Figure 12. When the ITM BTG equals the FSTG, there are no terrain interactions, and all losses (difference between FSTG and MBTG) can be assumed to come from buildings, foliage, or other interactions with the surrounding environment. This is shown in Figure 13, where the black line is the terrain pulled from the USGS terrain database13, the red, dashed line is the line-of-sight (LOS) line between the transmitting antenna and the receiving antenna, and the blue, dotted and dashed lines are the upper and lower first Fresnel zones14 where most of the energy is localized.
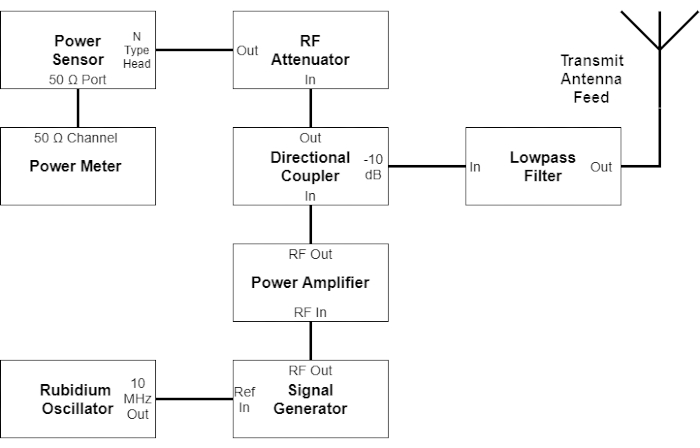
Figure 1: Diagram of transmitting components and connections. Transmitting side of continuous-wave (CW)-channel sounder. Abbreviations: RF = radio frequency; Ref = reference. Please click here to view a larger version of this figure.
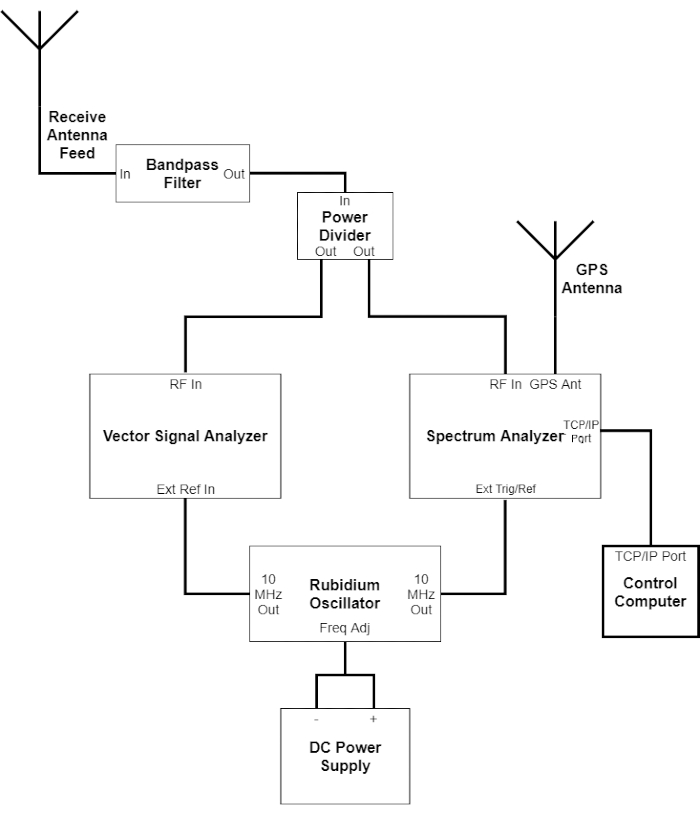
Figure 2: Diagram of receiving components and connections. Receiving side of continuous-wave (CW) channel sounder. Abbreviations: GPS = Global Positioning System; RF = radio frequency; Ext Ref = external reference; GPS Ant = GPS antenna; Ext Trig/Ref = external Trigger/Reference; TCP/IP = transmission control protocol/internet protocol; Freq Adj = Frequency-adjusted; DC = direct current. Please click here to view a larger version of this figure.
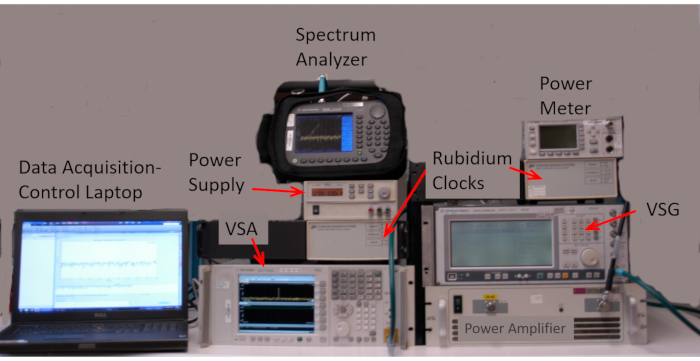
Figure 3: CW channel sounder system in laboratory. A benchtop deployment of the Institute for Telecommunication Sciences (ITS) channel sounder for system validation and accuracy testing showing the main components. Abbreviations: VSA = vector signal analyzer; VSG = vector signal generator. Please click here to view a larger version of this figure.
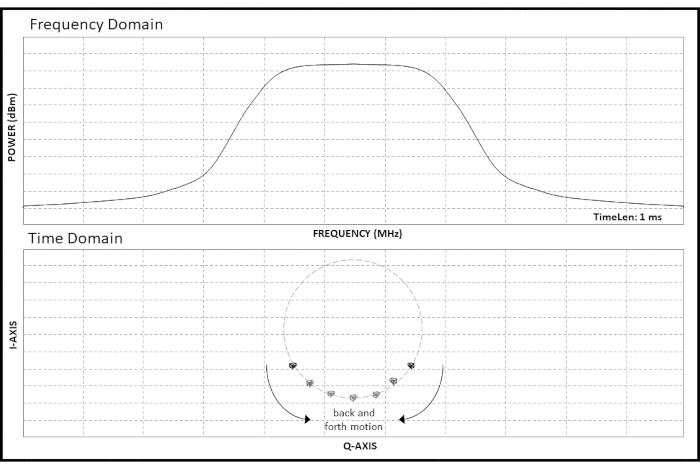
Figure 4: I-Q display. Frequency adjustment using in-phase and quadrature (I-Q) plot. Abbreviations: CW = continuous-wave; TimeLen = time length; I-axis = in-phase axis; Q-axis = quadrature axis. Please click here to view a larger version of this figure.
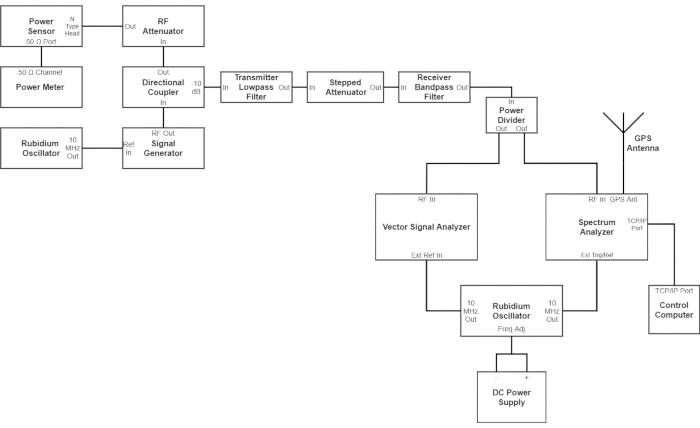
Figure 5: Verification and validation system setup. System setup for verification and validation measurements. Abbreviations: I-Q = in-phase quadrature; RF = radio frequency; Ref = reference; GPS = Global Positioning System; Ext Trig/Ref = external trigger/Reference; TCP/IP = transmission control protocol/internet protocol; Freq Adj = frequency adjusted; DC = direct current. Please click here to view a larger version of this figure.
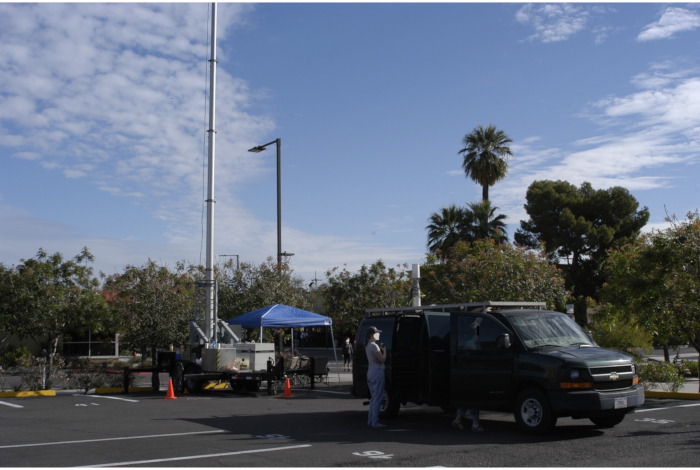
Figure 6: Cellular-on-wheels (COW) and measurement van. Photo showing green van used for receiving system and cellular-on-wheels (COW) used to house transmitting system. Please click here to view a larger version of this figure.
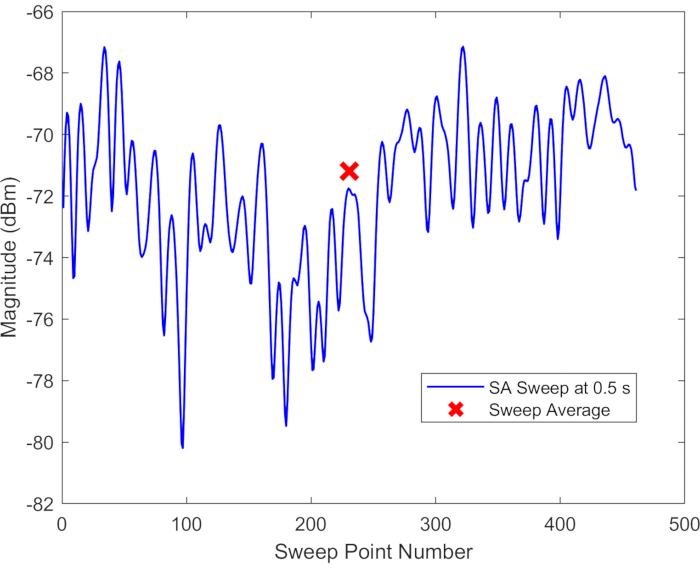
Figure 7: Spectrum analyzer sweep and sweep average. Single sweep for spectrum analyzer data capture consisting of 461 points over a 0.5 s sweep time. Abbreviation: SA = spectrum analyzer. Please click here to view a larger version of this figure.
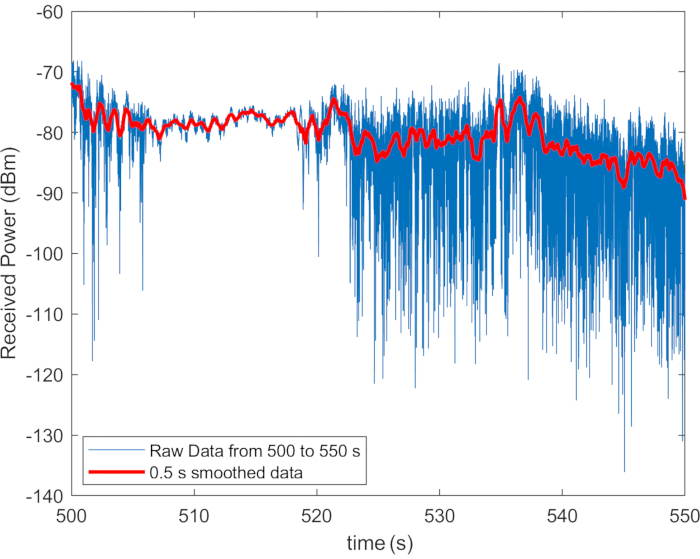
Figure 8: Vector signal analyzer received power and moving average. In-phase and quadrature (I-Q) magnitude data (blue trace) for a small slice of a larger run compared to the mean power (red trace) calculated over a 0.5 s window. Please click here to view a larger version of this figure.
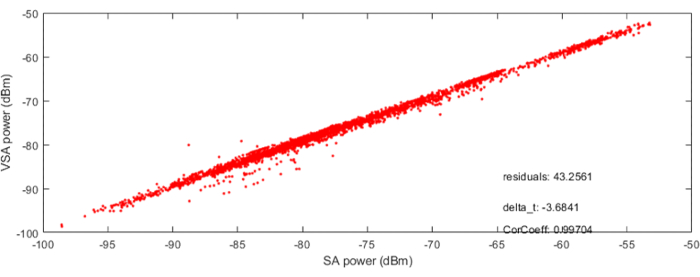
Figure 9: VSA and SA signal alignment. Alignment of vector signal analyzer power and spectrum analyzer power. Abbreviations: VSA = vector signal analyzer; SA = spectrum analyzer. Please click here to view a larger version of this figure.
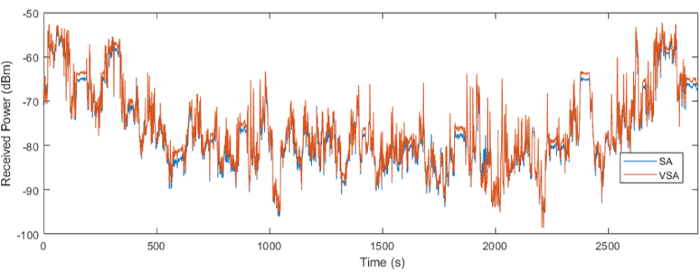
Figure 10: VSA and SA received power after signal alignment. Aligned vector signal analyzer power and spectrum analyzer power vs elapsed time in seconds. Abbreviations: VSA = vector signal analyzer; SA = spectrum analyzer. Please click here to view a larger version of this figure.
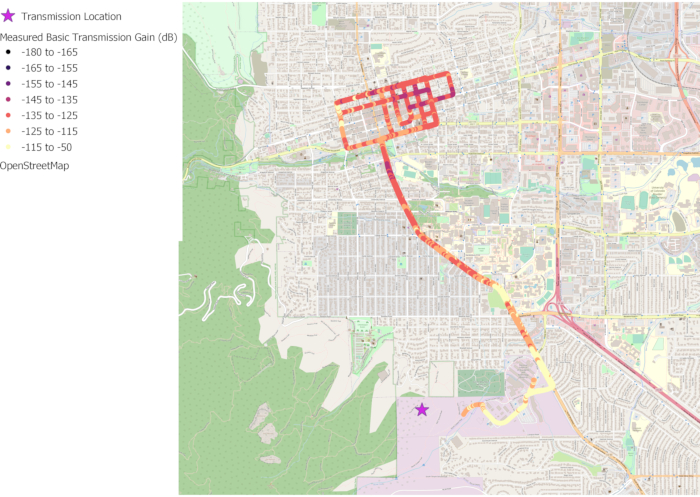
Figure 11: Geolocation of measured basic transmission gain. Measured basic transmission gain along the drive route. Please click here to view a larger version of this figure.
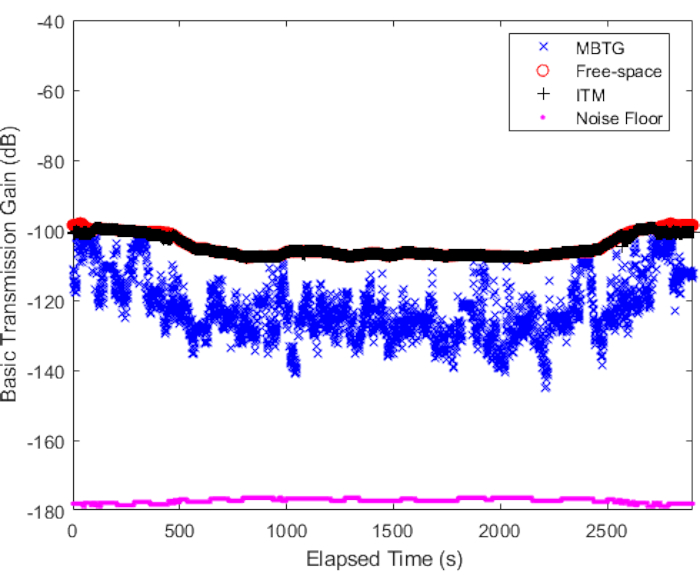
Figure 12: Measured and modelled basic transmission gain. Measured basic transmission gain (blue x's), Irregular-Terrain Model (ITM) basic transmission gain (BTG) (black +'s), free-space transmission gain (red circles), and system noise floor (pink dots) vs. elapsed time along the drive route. Abbreviations: MBTG = Measured basic transmission gain; ITM = Irregular-Terrain Model. Please click here to view a larger version of this figure.
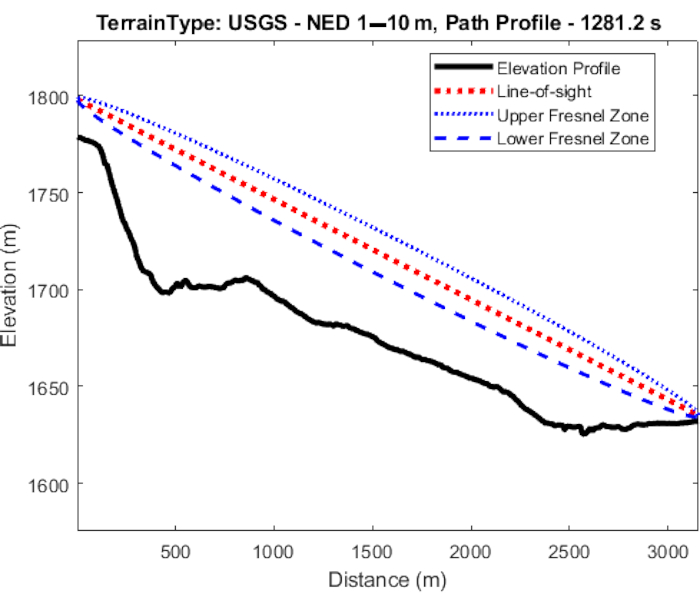
Figure 13: Terrain profile and first Fresnel zone. United States Geological Survey terrain profile (black line) for elapsed time 1636.2 s. The upper (first) Fresnel zone (blue, dotted line) and lower (first) Fresnel zone (blue, dashed line) are also plotted along with the line-of-sight line (red, dashed line) between the transmitting antenna and receiving antenna. Abbreviations: USGS = United States Geological Survey; NED = national elevation database. Please click here to view a larger version of this figure.
Discussion
It is very important to test a system as described in this protocol before attempting to make measurements in an outdoor environment. In this way, any bad components or instabilities can be traced and identified in the measurement system and can be resolved. The critical steps in this protocol are to 1) test the individual components first, and verify that they are operating within their specification, 2) assemble transmitting and receiving sides separately and test the chain of components, 3) assemble the transmitting and receiving side by inserting a stepped attenuator and measuring the signal levels as the attenuation is changed to make sure the received signal levels in the VSA and SA are as calculated. Further troubleshooting can be performed by using a VSG, such as the one shown in the Table of Materials, that has an option to generate fading simulations, which can be used to test the system using simulated waveforms in various fading environments encountered in real-world propagation environments. Once the measurement system is operating correctly, measurements can be made in an outdoor environment with the confidence that measurements will be accurate.
Another important step is to monitor the transmitting power throughout the measurement to verify that the system is operating correctly. The power amplifier is characterized and tested separately to understand its linearity and out-of-band emissions spectra. The power amplifier may be validated on the benchtop with the rest of the setup, but care must be taken to reduce the signal power below the maximum rated power input to the VSA using appropriately rated attenuators. Neither the GPS antenna nor its settings should be used for lab verification and validation. As the VSA's screen is not capable of providing real-time monitoring of the environment, the addition of an SA as a real-time monitor helps determine the current state of the system. There are several types of channel-sounding measurement systems to capture channel characteristics for radio systems: CW, direct pulse, frequency domain using a VNA, correlation-based, swept-time delay cross-correlator.
One limitation of this system is that a CW signal probing the local environment does not contain time-domain information such as time-delay profiles. A time-delay profile gives information about the timing of source reflections of the signal in the local environment. However, an advantage of using a CW signal is that it is easier to obtain permission to transmit on one frequency in various bands using the narrowband CW signal rather than trying to transmit a wide-band signal. CW systems can have a larger dynamic range than other systems, and the signal can usually propagate further in the environment. A CW signal also has audio sampling rates that result in smaller file sizes than other types of channel-sounding systems. With this system, data collections are continuous and can last for several hours. The CW-channel sounder measurement system discussed in this article can be used at different frequencies, depending on the range of the various assembled components. The system can be used in an outdoor propagation environment or an indoor propagation environment15.
Acknowledgements
Thanks to the Defense Spectrum Office (DSO) for funding the work presented in this article.
Materials
| Name | Company | Catalog Number | Comments |
| Cabling | Micro-Coax | Various lengths | |
| Directional Coupler | Anatech Electronics, Inc. | AM1650DC833 | |
| Filter 1 | K&L Microwave, Inc. | 8FV50-1802-T95-O/O | |
| GPS Antenna | Trimble | SMA connection to SA | |
| Instrument Control & Processing Software | MATLAB | Used to store and process measurement data | |
| Power Amplifier | Ophir RF | 5263-003 | |
| Power Divider | Mini-Circuits | ZAPD-20+ | |
| Power Meter and Power Sensor | Keysight | E4417A/E4412A | |
| Receiving Antenna | Cobham | OA2-0.3-10.0V/1505 | |
| Rubidium Frequency Standard | Stanford Research Systems | FS725 | |
| SA | Agilent | N9344C | |
| Transmitting Antenna | COMTELCO | BS1710XL6 | |
| Vector Signal Generator | Rohde & Schwarz | SMIQ | |
| VSA | Keysight Technologies | N9030A |
References
- Commerce Spectrum Management Advisory Commmittee. . 1755-1850 MHz Airborne Operations: Air Combat Training System Sub-Working Group Final Report. , (2014).
- Best practices for radio propagation measurements. NTIA Technical Memo TM-19-535. U.S. Dept. of Commerce Available from: https://www.its.bldrdoc.gov/publications/3211.aspx (2018)
- Hammerschmidt, C. A., Johnk, R. T., Tran, S. Calibration of a Vector Network Analyzer for Measurements in Radio Frequency Propagation Channels. Journal of Visualized Experiments. (160), e60874 (2020).
- Channel sounder measurement verification: conducted tests. NTIA Joint Report JR-20-549. U.S. Department of Commerce Available from: https://www.its.bldrdoc.gov/publications/3241.aspx (2020)
- Molisch, A. . Wireless communications. 2nd edition. , (2010).
- Anderson, C. R. Design and implementation of an ultrabroadband millimeter-wavelength vector sliding correlator channel sounder and in-building multipath measurements at 2.5 & 60 GHz. Virginia Polytechnic Institute and State University. , (2002).
- Johnk, R., Hammerschmidt, C. A., Stange, I. A high-performance CW mobile channel sounder. Proceedings of the 2017 IEEE International Symposium on Electromagnetic Compatibility & Signal/Power Integrity (EMCSI. , (2017).
- Johnk, R., Hammerschmidt, C. A., McFarland, M. A., Lemmon, J. A fast-fading mobile channel measurement system. Proceedings of the 2012 IEEE International Symposium on Electromagnetic Compatibility (EMC). , 584-587 (2012).
- Vector signal analysis basics. Keysight Technologies Available from: https://www.keysight.com/us/en/assets/7018-02891/application-notes/5990-7451.pdf?success=true (2020)
- Johnk, R. T., et al. A mobile propagation measurement system. Proceedings of the 2009 IEEE International Symposium on Electromagnetic Compatibility (EMC. , (2009).
- . 3.5 GHz Exclusion zone analysis and methodology. NTIA Technical Report 15-517 Available from: https://www.its.bldrdoc.gov/publications/2805.aspx (2015)
- The national map. United States Geological Survey Available from: https://viewer.nationalmap.gov/basic (2017)
- Radiocommunication Sector of International Telecommunication Union. Propagation by diffraction. Propagation by diffraction. ITU-R Recommendation. , 526 (2019).
- Yoza, N. P. Narrowband 5 GHz mobile channel characterization. Interdisciplinary Telecommunications Program, University of Colorado at Boulder. , (2015).
Reprints and Permissions
Request permission to reuse the text or figures of this JoVE article
Request PermissionExplore More Articles
This article has been published
Video Coming Soon
Copyright © 2025 MyJoVE Corporation. All rights reserved