Method Article
Measuring the Behavioral Effects of Intraocular Scatter
In This Article
Summary
In this protocol, we outline the conceptual design elements and structural development of a glare acuity apparatus. Additionally, the design of a device for measuring positive dysphotopsia (halos, spokes) and two-point light thresholds is described.
Abstract
Intraocular scatter, with its associated functional manifestations, is a leading cause of automotive accidents and a significant biomarker of covert and overt ocular disease (e.g., diseases of the cornea and lens). Nearly all current methods of measuring the behavioral consequences of light scatter, however, suffer from various limitations mostly reflecting a lack of construct and content validity: to wit, the measures do not adequately reflect real world conditions (e.g., artificial light vs. sunlight) or everyday tasks (e.g., recognition under visually demanding conditions).
This protocol describes two novel, ecologically valid methods of measuring the behavioral effects of intraocular scatter by quantifying scatter geometry and visual recognition under glare conditions. The former was measured by assessing the diameter of halos and spokes that resulted from a bright point source. Light spread (essentially, the point spread function determined using Rayleigh criteria) was quantified by determining the minimum perceivable distance between two small points of broad-band light. The latter was done based on the identification of letters formed using apertures through which bright light was shone.
Introduction
Glare is commonly defined as a degradation of optical clarity resulting from intraocular scatter within the ocular media. This scatter distorts the image's representation on the retina and produces a disrupted depiction of the visual scene. Most major accidents related to glare happen due to daytime intraocular scatter caused by the sun1. This origin means that time of day and season (solar position) are significant variables as well as the age of the driver2,3. Given the importance of glare as an issue of safety, there have been several methodological studies focused on (mostly commercial) devices for testing individual and group differences4. Often, this manifests as bright lights (typically halogens or fluorescents) surrounding an acuity chart or gratings. Depending on the characteristics of the individual (e.g., ocular pigmentation, lens density)5, the abutting lights cause a veiling luminance that degrades performance. At first blush, these tasks would seem to have high face validity. As illustrated in Figure 1A,B, increasing scatter does directly veil objects, and the available tests do capture variance attributable to the intensity of the glare source and personal characteristics. However, the tests have several drawbacks6 and leave many important aspects of scatter unassessed. The first, and most obvious, is simply that the most common glare source in everyday life is the sun.
Scatter within the eye has a complex dependence on wavelength that is compounded by age and ocular pigmentation7. To the degree a test deviates from this natural source, its ability to predict visual function in those circumstances may be limited. Common tests use white light-emitting diodes (LEDs) or side-mounted halogens. In an early study of 2,422 European drivers, van den Berg et al. noted that scattering within the eye and visual acuity were relatively independent predictors of the quality of a subject's vision (scatter and acuity were not correlated)4. In the real world, however, glare often comes directly from the object being viewed. The glare source may come from above (e.g., the sun) or the side (e.g., car headlights), but the veiling luminance is directly in the line of sight. In this study, the researchers attempted to address both these issues by selecting a light source that closely matched noon-day sunlight (Figure 2), and designing a task that was based on recognition (not simply detection) and where task and light stress were, simultaneously, in the direct line of sight of the viewer.
In addition to veiling luminance reducing visual acuity (scatter along the sight line), many conditions influence the actual geometry of scatter within the eye (i.e., not just forward light scatter within the macula) and degrade vision. This is described by the common appearance of halos and spokes (or when sufficiently debilitating, positive dysphotopsia (PDP) (for examples, see Figure 3). PDP is a common side effect in individuals who have had LASIK corrective surgery8 in addition to those with cataracts (often referred to clinically as "intolerable" PDP9-this demographic includes roughly half of the population aged 70 years and over). PDP is often not corrected by cataract surgery as the surgery itself creates inhomogeneities in the cornea, the seating of the implant within the lens capsule is imperfect, and many lens designs, while addressing some issues such as presbyopia, create others such as spoking and halos. For example, Buckhurst et al. showed that intraocular scatter was the same between differing clear intraocular lens (IOL) designs, but that multifocal lenses created significant PDP10.
The first halometer designed to precisely measure visual halos/spokes was described in 1924 by Robert Elliot. The device was essentially a lamp in a box with a small aperture and a slide rule (even earlier versions used drawings of the visual effects from candles). Several variations of that theme followed9 until a device called the Aston Halometer finally reached the market. This device10,11 is based on a bright white LED in the center of a tablet computer (subjects identify letters surrounding the tablet as they move centrifugally in 0.5° steps). As noted earlier, one challenge with this design is that white LEDs are not a great match for the sun. Another is simply that the source (a single LED) is not sufficiently bright to induce significant halos and glare spokes. The researchers imposed Bangeter occlusion foils (essentially a diffuser) to increase light scattering (and decrease specular reflections from the surface of the tablet). However, this risks confounding the source (i.e., much of the scatter then comes from the diffuser and not the inhomogeneities within the eye itself-the very variable that needs to be quantified). The redesign of the halometer has several features meant to address these issues. First, it uses broad-band xenon as a solar simulator12 and uses the original aperture method introduced by Elliot with precision-centered calipers.
The light shield that forms the central aperture has the added advantage that it can be separated into two smaller apertures that can be slowly moved apart to measure light spread (essentially, a behaviorally derived point spread function; see Figure 4). This design has now been used in several recent studies to assess the optical characteristics of photochromic contact lenses13. Taken together, measuring the diameter of halos and spokes, the minimal distance between two point sources of light (light spread), and glare acuity, addresses not only that a patient suffers from glare using real world conditions, but also how. The behavioral effects of light scatter within the eye are not a unitary phenomenon4,14,15. Each of these variables explains a relatively unique aspect of the variance in visual function. Halos, for instance, result from forward light scatter arising primarily from the crystalline lens. Spokes (essentially ciliary corona) stem from diffraction and aberrations that arise from small particle scattering along the optical path14,16.
Protocol
NOTE: The procedures outlined in the following protocol adhere to all institutional guidelines relating to human subject's research. This study was approved by the University of Georgia institutional review board, and the experimental procedures were conducted in accordance with Good Clinical Practice Guidelines and the ethical principles of the Declaration of Helsinki.
1. Constructing the glare acuity apparatus
NOTE: A conceptual drawing of the system is shown in Figure 5.
- Begin with an optical table, and install a 1000 W xenon arc lamp with the associated power supply at the posterior end of the bench (see a of Figure 5).
NOTE: The best choice for an optical table is a breadboard with a grid of mounting holes, commonly, the M6 screw thread on a 25 mm grid. The minimum size necessary is ~91 cm x 122 cm. One limitation with these systems is that, if the light output is not constant (within and across sessions), small variations would be interpreted as variation in behavioral thresholds. Hence, make sure that the power supply is highly regulated with optical feedback sensors to ensure constant light output across experimental sessions and over time. - Install the first lens at a position that collimates the light from the source (see b of Figure 5), and introduce an optical element to remove heat within the optics generated by the intense light source (Figure 5C).
NOTE: All lenses within the system are plano-convex achromats with anti-reflection coating. The effective focal length is ~100 mm, and the diameter is ~5 cm (slightly larger than the exit aperture of the light source). Infrared filters could be used to remove heat, but they often intrude into the visible. A water bath is a nice alternative. In the current system, two optical flats enclosed a tube filled with water. - Introduce the next lens (see d of Figure 5) within the optical system to focus light to a small point on the 100 mm circular neutral density filter (see e of Figure 5), which attenuates light over a linear range of about 2 log units of optical density. Determine the nominal position of the filter using a digital readout coupled to a potentiometer (see j of Figure 5). Use a calibrated radiometer to determine the actual amount of light transmitted that corresponds to the circular filter's position and to periodically confirm that the overall energy within the system remains constant over the course of the experiment.
NOTE: As the filtering is done over a gradient, light needs to be focused to a fairly small area (4-9 mm2) when passing through the circular filter (this position is also good for baffling using a small aperture that only passes the focused light).- Use a mechanical shutter or simply a blocking filter and holder to occlude the stimulus between trials (see f of Figure 5).
- Add the next lens to the system, a collimating lens (see g of Figure 5), placed such that light expands to match the diameter of each letter aperture (10.16 cm), fully illuminating the optotype (7.62 cm).
- Construct the letter apertures or purchase them as metal stencils: P, L, D, U, Z, E, T, and F (see h of Figure 5). Place the letter apertures in a circular rotator (to allow for easy alternation between letters) with spring-loaded tabs and divots to lock each letter in place so there is no movement of the wheel during the experiment.
NOTE: The letter apertures were approximately 15 mm x 6 mm x 25 mm (~0.17°), and were chosen because they are classic Sloan optotypes and approximately the same size. In this system, luminance measured at the letter aperture was 4000 lux; 40 lux when measured at the plane of the eye. - Next, baffle the system such that subjects can only see the back-illuminated letter apertures (e.g., the intense light coming out of an "E"). For instance, place the optics of the system in one room with the subject in an adjoining room. Position a hole within the doorway adjoining the rooms and align it so that subjects cannot see the experimenter or stray light. Should the participant be unable to hear the experimenter's instructions, add an intercom system.
- To ensure that the position of the eye relative to the visual system is fairly precise, create some form of head and chin rest assembly-use a rubber eye cup mounted on a black tube (both mounted on a movable cart). As done in this protocol, add a mount behind the tube to allow for the use of trial lenses to correct for refractive error using standardized lenses (i.e., no tinting).
NOTE: The use of trial lenses will also allow for the use of a glass "blank" to ensure that the optical effects of those who did not require refractive correction match those who required refractive corrective optics (see i of Figure 5).- Additionally, ensure the viewing station is secured so that it does not move between subjects. Use a laser level to ensure alignment of the eye piece with the optics (7 m from the plane of the eye).
2. Measurement of glare recognition acuity
NOTE: At the beginning of an experimental session, it is confirmed that all optical elements within the system are aligned, light intensity (with no attenuation) is correct, and the subject's eye is in the proper position. The task is then explained to the subject (letter identification), and the stimuli are presented in random order at differing levels of intensity. The goal is to find the highest intensity at which a subject can still correctly identify individual letters (with the actual threshold defined probabilistically at 75% correct detection, 6 correct out of 8).
- Use the method of limits (to get close to the threshold) and then constant stimuli to obtain a precise value of the subject's glare recognition acuity threshold.
NOTE: There are more accurate psychophysical methods available (signal detection, forced choice), but this method was used based on the number of measures and time constraints. - Use a random letter generator to organize the letters on the wheel into a unique, random order. Use letters for the apertures that are commonly found in other recognition tasks (e.g., Snellen chart, Sloan letters).
NOTE: The letters used in the present method were P, L, D, U, Z, E, T, and F. - Before beginning the protocol, explain the nature of the experimental task by showing the subject suprathreshold stimuli. Ensure the subject is aware the task is fairly simple: can the letter be seen or not? Run enough trials to generate a psychometric function that allows derivation of an accurate probabilistic threshold.
3. Constructing the halometer device
- Utilize the same steps 1.1-1.2 in setting up the optics table for these measures. Make sure the light from the source illuminates the back of the light shield over a sufficient space (13-14 cm) to allow a separation of the two points.
- Install the light shield, and ensure that it serves as a baffle by blocking most of the light coming from the light source so that the subject just sees the light coming from the aperture and contains a small (~4 mm) aperture for the halo/spoke measures. Affix a digital micrometer to the back of the light shield to be used to measure the physical separation of the two light points.
NOTE: The aperture must be produced by two abutting and movable apertures (2 mm each), and the shield must contain a collapsible baffle such that, as the apertures are moved apart, the baffle occludes light from passing between them. - To maintain consistency with this protocol, ensure that the light output measured at the light shield is 10 cd/m2.
- In accordance with the schematic (Figure 2)13, place the centering calipers in the space between the light shield and the subjects stabilized head position (a simple chin and forehead rest). Make sure the jaws of the caliper are aligned with the 4 mm aperture and ~13-14 cm in height.
NOTE: It is helpful to put some reflective material on the subject side so that they can be clearly seen. The jaws move equally from the center, and their position is indicated by a Vernier scale. - To maintain consistency with the setup used in this protocol, verify the light shield is ~100 cm and the calipers are ~60 cm from the plane of the subject's eye.
- When making the two-point measures, use a long focal length lens. Determine the exact placement of this final lens based on the focal length and the distance from the light shield and the plane of the subject's eye. Remove this lens when doing the halo/spoke measures.
NOTE: A 200 mm achromatic plano-convex lens 18 cm from the plane of the eye was used in this setup (this places the eye in the focusing beam, but not at the focusing plane, the eye is anterior to the final focal point). This is used because individuals with very good acuity and low scatter can often see two abutting small points of light even when very close. The focusing lens will cause the points to overlap and magnify the distance necessary to distinguish two points. - Use a white reflectance standard placed at the eye and a telescoping spectral radiometer to measure spectral light output, both radiometrically and photometrically, to ensure that the visible spectrum has the desired characteristics (in this case, simulated sunlight, Figure 2). To monitor energy output more often and with a highly sensitive detector, use a regular radiometer with a silicon-based photo-head.
NOTE: Such light output measuring devices will yield both the spectral shape of the curve and photometric values (measured in the same position at the eye itself).
4. Glare geometry
NOTE: Prior to testing, subjects were provided examples of the appearance of halos and starbursts in natural scenes (see Figure 3).
- Once the subject is aligned, move the jaws of the caliper until it just surrounds the halo, and then until it is just at the outer circumference of the starbursts or spokes. Obtain the threshold by averaging the spread from both directions (from in to out and out to in).
- When beginning the two-point measures, ensure maximal proximity of the two 2 mm apertures; note that the stimulus will appear as a single, bright point of light. Slowly move the two apertures apart, quantifying the distance by the back-facing digital micrometer, centered on the apertures. From the "zero point," (abutting apertures) ask the subjects to indicate when the spread from each light point does not overlap (usually one direction works well here).
- As some error can be encountered if the subject becomes misaligned with the system, utilize a small-bore camera (with infrared) to ensure the eye always stays in correct position.
Results
For the glare acuity measures, 20 young subjects (average age = 19 years, standard deviation (SD) = 1 year) with good acuity were tested. The results shown in Figure 6 indicate the variation in the number of letters seen at one relatively bright intensity level. Another approach to analyzing the data would be to use the correct identification to generate a psychometric function with threshold defined as 6 identifications out of 8 (the energy at 75% correct identification). As shown in Figure 6, there is wide variation present even when testing healthy young subjects.
Data from the halos and spokes measures are shown in Figure 7A,B and are from a different sample of 23 young subjects (average age = 20 years, SD = 4 years). Both samples were recruited from the student population at the University of Georgia. All these subjects had good acuity (20/20) and/or were corrected with clear contact lenses. The minimum distance (mm) required to resolve two points of light as distinct (the two-point thresholds here) was also measured. These data are shown in Figure 8.
As seen in Figure 6, Figure 7, and Figure 8, despite the sample being so homogeneous (composed of relatively young healthy observers with good vision), there was wide variation in the behavioral measures of scatter. This suggests that standard clinical measures of visual function (e.g., acuity) fail to quantify many visual attributes that likely impact visual performance under real world conditions.
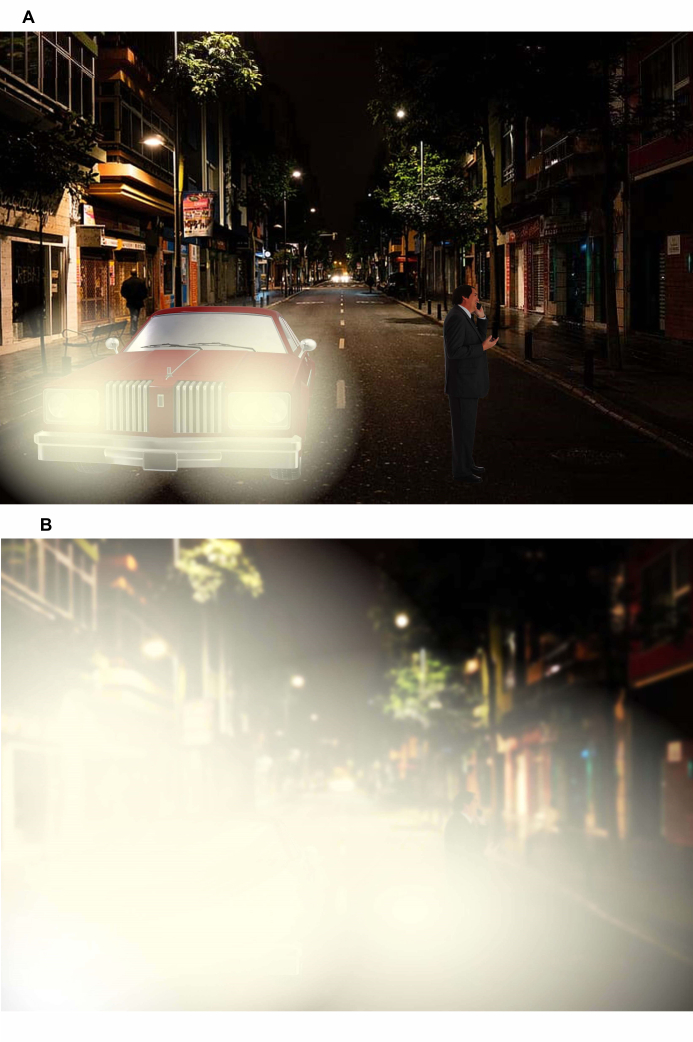
Figure 1: Two nighttime driving scenarios. (A) Minimal intraocular scatter from the car headlights with the pedestrian in the road clearly visible. (B) High intraocular scatter from the car headlights, obscuring the pedestrian in the road. Please click here to view a larger version of this figure.
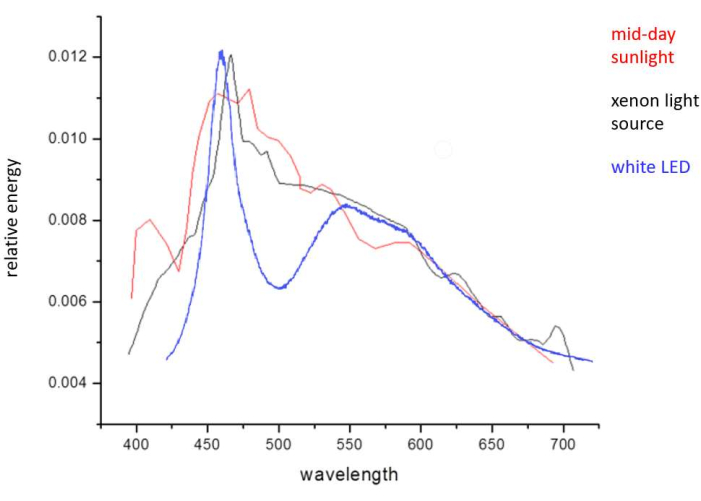
Figure 2: Graph representing the spectral distribution of midday sunlight (red), the xenon arc lamp light source (black), and a high-bright white LED source (blue). Abbreviation: LED = light-emitting diode. Please click here to view a larger version of this figure.

Figure 3: Examples of PDP symptoms: spokes (far left), halos (left), and starbursts (right) and of 2-point light scatter (far right). Please click here to view a larger version of this figure.
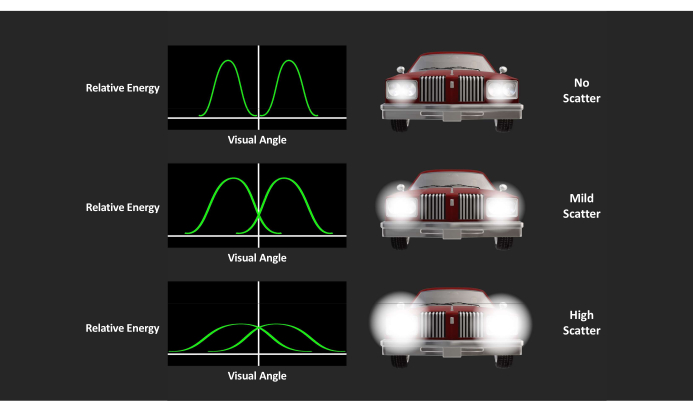
Figure 4: Semantic representation of the point-spread function and visual illustration of car headlights. Relative energy on y-axis and visual angle on x-axis; visual illustration of how the separation between two bright points of light (headlights) is a behavioral measure of its width. Please click here to view a larger version of this figure.
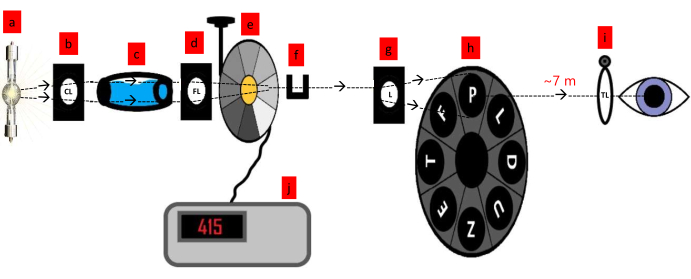
Figure 5: A conceptual drawing of the glare acuity system. The components include (a) a xenon light source, (b) collimating lens, (c) water bath, (d) focusing lens, (e) circular filter (100 mm neutral density filter), (f) filter holder, (g) lens, (h) letter apertures in circular rotating wheel, (i) refraction correction (trial lenses), (j) digital readout of circular filter potentiometer. Abbreviations: CL = collimating lens; FL = focusing lens; L = lens; TL = trial lenses. Please click here to view a larger version of this figure.
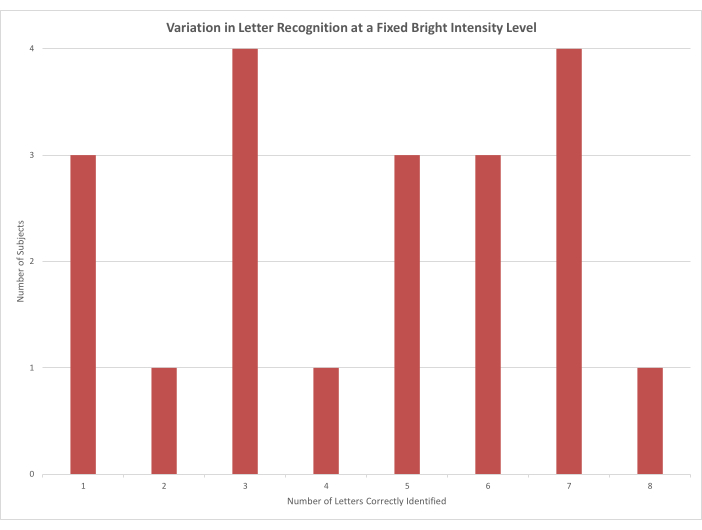
Figure 6: A column chart showing the number of letters each subject was able to identify when the luminance of the stimulus was held at a bright constant (absolute energy, 16,392 cd/m2). Please click here to view a larger version of this figure.
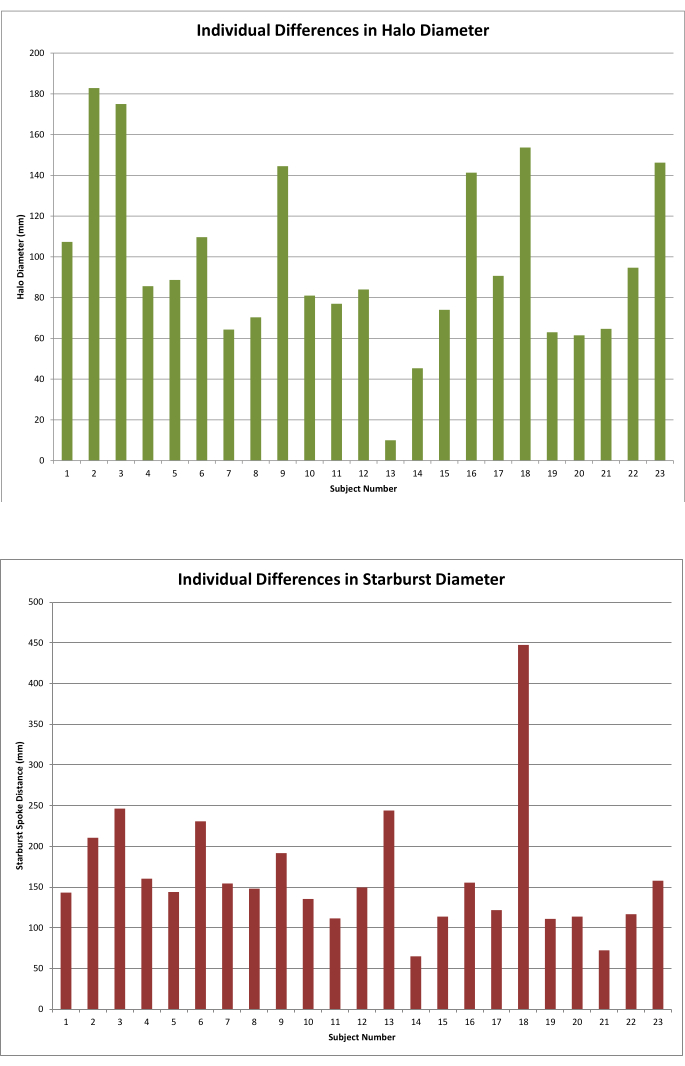
Figure 7: A column chart showing the individual differences in a sample of 23 young, healthy observers. (A) Individual differences in Halo diameter graph. (B) Individual differences in Starburst diamater graph. Please click here to view a larger version of this figure.
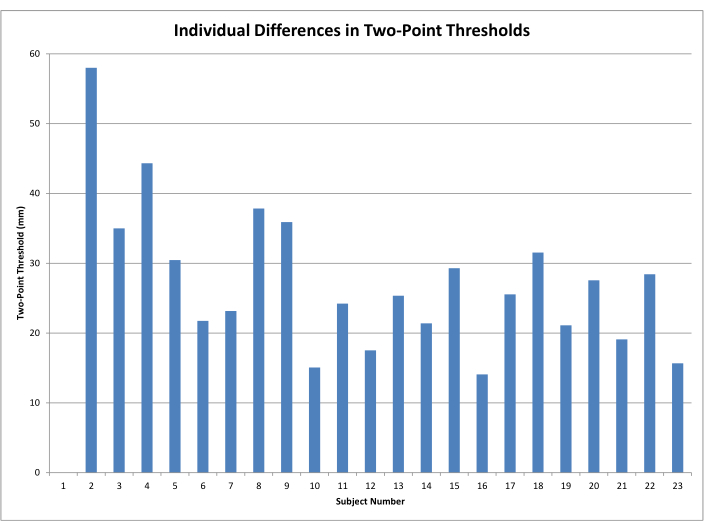
Figure 8: A column chart showing the minimal distance where two small points of light did not overlap (two-point thresholds). Please click here to view a larger version of this figure.
Discussion
The visual consequences of intraocular scattering are often assessed as glare disability and discomfort17,18. These methods focus directly on the dysfunction and slight pain that accompanies intense light, but not on directly how it is disabling vision. The how is also important, however, because intraocular scatter does not only affect vision when it is intense. Even a low-intensity visual image (e.g., low luminance, low contrast targets) can be degraded by light scatter. The underlying optics15 can be described by the Strehl ratio, point spread function, or diffusion index (largely independent of luminance). Another method, effective even at lower luminance (10 cd/m2 in this setup), involves the measurement of the separation of two point sources of light. Individuals with a wider point spread function will require more separation before two small points of light will appear distinct. The Rayleigh criterion method of quantifying the spread of two small point light sources has a long history19. In the present case, this method was adapted to increase its ecological validity (e.g., by using white xenon that simulated noon-day sunlight).
Figure 5 shows a conceptual drawing of the glare acuity system. In essence, it begins with a bright white light source that simulates sunlight (xenon bulbs are typically a good choice, 1000 watts provide sufficient intensity). Light from the source is cooled with a water bath (transparent to visible light) and then manipulated by a series of lenses that carry light in focused and collimated beams. A circular neutral density filter attenuates the light that is then passed through letter-shaped apertures. The subject sits at a fixed distance from the isolated stimulus (~7 m) and views the stimulus with one eye at a time (eye position fixed by an eye cup). What the subject sees is a series of letters that are themselves the glare source. When the light is too intense for a given subject, consistent correct identification is not possible. Glare acuity thresholds can be defined using any number of classic psychophysical techniques.
The basic design of the halometer is similar to the glare acuity device described above and can use the same light source (an intense xenon) and optical table13. The two elements that differ are the introduction of a light shield that contains small movable apertures and centering precision calipers. The aperture in the light shield is 4 mm in diameter and is backlit by the light source. The broad band light passing through this small hole creates a bright point source that spreads (the pattern determined by the optical characteristics of the observer, so for some, it spokes more, others have more diffuse haloing), and the calipers are used to measure this geometry. The 4 mm aperture in the light shield can be broken into two smaller apertures (2 mm each) that can be slowly moved apart until the spread of each is not overlapping. That distance (tracked by a micrometer on the light shield) is used as the behaviorally derived point spread function (two-point thresholds).
The diameters of the halo (diffuse light around the point source) and starburst (concentric rays radiating outward from the point source) were determined by using the method of limits (in ascending and descending modes). The researcher moved the jaws of the caliper (outward from the center) until the subject indicated that the guides just surrounded the halo or the starburst. When making the two-point measures, the two tiny abutting apertures are moved slowly apart (horizontally), and subjects indicate when the spread from each light point does not overlap (e.g., when they first perceive a small black space between the two points). A technical schematic of the system has been described by Hammond et al.13.
Measuring the way that light scatters instructs the nature (and correction) of the problem. Starbursts (peripheral spokes), halos, and glare disability and discomfort all have individual characteristics. When the eye is compromised by aging, disease9, or surgery8, these optic phenomena also change in distinct ways. Halos, for example, are often seen as a relatively homogeneous veil, whereas starbursts tend to not be homogeneous and extend into the periphery. This pattern is demonstrated clearly by Hammond et al.13.
These different patterns imply the need for different types of correction7. For example, macular pigments (yellow pigments concentrated in the macula) have been shown to be useful for correcting central glare (light veiling in the line of sight)20. However, as these pigments are only in and around the retinal fovea, they do not influence light scatter outside that area21. For this purpose, filtering in the more anterior portion of the eye is desirable such as with the use of tinted spectacles22, contact lenses13, or intraocular implants23. All things being equal, individuals with optimal glare acuity can discern letters at much higher intensities than those with poor glare acuity.
Past studies have also shown that measures of light scatter do not correlate well with more commonly measured metrics such as visual acuity4. This motivated the development of a light scatter method that was convolved directly with acuity judgements (analogous to a Snellen Chart). Previous methods were based on detection or resolution (e.g., seeing individual bars within gratings of varying frequency) as opposed to recognition. However, recognition acuity, like other forms, is dependent upon the contrast between two elements within an image. Light scatter can degrade that difference and was the dependent measure in the present glare acuity assessments. As shown by the empirical results of this young, largely homogeneous sample, all things equal, there are large individual differences in how light scatter effects visual function under real world conditions.
Disclosures
The authors have nothing to disclose.
Acknowledgements
The authors would like to acknowledge Dr. Sarah Saint for her assistance in collecting the halometer data.
Materials
| Name | Company | Catalog Number | Comments |
| Glare Recognition Acuity: *Indicates handmade equipment | |||
| 100 mm Circular Neutral Density Filter | Edmund's Optical | Stock #54-082 | |
| 1000W xenon arc lamp Bulb) | Newport | Model 6271 | |
| Breadboard optics table | Newport | Model IG-36-2 | |
| *Chin rest assembly | |||
| *Circular rotator and letter apertures | Letter apertures can be constructed or purchased as metal stencils | ||
| *Digital potentiometer and readout | This simply supplies a nominal readout for the position of the circular wedge (essentially a voltmeter connected to a potentiometer) | ||
| Plano-convex achromatic lenses | Edmund's Optical | Model KPX187-C | 100 mm EFL, anti-reflective coating in the visible, 50.8 mm diameter (mounting is also available from this supplier) |
| Radiometer | Graseby Optronics United Detection Technology (UDT) | Model S370 | |
| Research arc lamp housing and power supply | Newport | Model 66926 | |
| Spectral radiometer | PhotoResearch Inc | PR650 | |
| Trial lenses | Premier Ophthalmic Services | SKU: RE-15015 | |
| *Water bath | Two optical flats enclosing a cylindrical tube filled with water containing a small amount of formalin | ||
| Halometer: *Indicates handmade equipment | |||
| 1000 W xenon arc lamp | Same as above | ||
| Arc lamp power supply | Same as above | ||
| Breadboard optics table | Same as above | ||
| *Calipers | |||
| *Chin and forehead rest | |||
| Digital micrometer | Widely available | ||
| *Light shield | Must be able to serve as a baffle, equipped with a collapsible baffle, equipped with two movable apertures (2 mm each) | ||
| Plano-convex achromatic lens | Edmund's Optical | 200 mm Effective Focal Length |
References
- Sun, D., El-Basyouny, K., Kwon, T. J. Sun glare: network characterization and safety effects. Transportation Research Record. 2672 (16), 79-92 (2018).
- vanden Berg, T. J., et al. Straylight effects with aging and lens extraction. American Journal of Ophthalmology. 144 (3), 358-363 (2007).
- Kimlin, J. A., Black, A. A., Wood, J. M. Older drivers' self-reported vision-related night-driving difficulties and night-driving performance. Acta Ophthalmologica. 98 (4), 513-519 (2020).
- vanden Berg, T. J. The (lack of) relation between straylight and visual acuity. Two domains of the point-spread-function. Ophthalmic and Physiological Optics. 37 (3), 333-341 (2017).
- Vos, J. J. On the cause of disability glare and its dependence on glare angle, age and ocular pigmentation. Clinical and Experimental Optometry. 86 (6), 363-370 (2003).
- Diep, M., Davey, P. G. Glare and ocular diseases. Causes and Coping with Visual Impairment and Blindness. Rumelt, S. , IntechOpen. (2018).
- Coppens, J. E., Franssen, L., vanden Berg, T. J. Wavelength dependence of intraocular straylight. Experimental Eye Research. 82 (4), 688-692 (2006).
- Shah, M., Larson, B. Starburst phenomenon in wavefront-guided LASIK compared with conventional LASIK. Investigative Ophthalmology & Visual Science. 46 (13), 4366(2005).
- Babizhayev, M. A., Minasyan, H., Richer, S. P. Cataract halos: a driving hazard in aging populations. Implication of the Halometer DG test for assessment of intraocular light scatter. Applied Ergonomics. 40 (3), 545-553 (2009).
- Buckhurst, P. J., et al. Tablet app halometer for the assessment of dysphotopsia. Journal of Cataract & Refractive Surgery. 41 (11), 2424-2429 (2015).
- Buckhurst, P. J., et al. Assessment of dysphotopsia in pseudophakic subjects with multifocal intraocular lenses. BMJ Open Ophthalmology. 1 (1), (2017).
- Sayre, R. M., Cole, C., Billhimer, W., Stanfield, J., Ley, R. D. Spectral comparison of solar simulators and sunlight. Photodermatology, Photoimmunology & Photomedicine. 7 (4), 159-165 (1990).
- Hammond, B. R. Jr, et al. The effects of light scatter when using a photochromic vs. non-photochromic contact lens. Journal of Optometry. 13 (4), 227-234 (2020).
- Xu, R., et al. Psychophysical study of the optical origin of starbursts. Journal of the Optical Society of America. A. Optics, Image Science, and Vision. 36 (4), 97-102 (2019).
- Westheimer, G., Liang, J. Influence of ocular light scatter on the eye's optical performance. Journal of the Optical Society of America. A. Optics, Image Science, and Vision. 12 (7), 1417-1424 (1995).
- vanden Berg, T. J., Hagenouw, M. P., Coppens, J. E. The ciliary corona: physical model and simulation of the fine needles radiating from point light sources. Investigative Ophthalmology & Visual Science. 46 (7), 2627-2632 (2005).
- Aslam, T. M., Haider, D., Murray, I. J. Principles of disability glare measurement: an ophthalmological perspective. Acta Ophthalmologica Scandinavica. 85 (4), 354-360 (2007).
- Pierson, C., Wienold, J., Bodart, M. Review of factors influencing discomfort glare perception from daylight. Leukos. 14 (3), 111-148 (2018).
- Grimes, D. N., Thompson, B. J. Two-point resolution with partially coherent light. Journal of the Optical Society of America. 57 (11), 1330-1334 (1967).
- Hammond, B. R., Fletcher, L. M., Elliott, J. G. Glare disability, photostress recovery, and chromatic contrast: relation to macular pigment and serum lutein and zeaxanthin. Investigative Ophthalmology & Visual Science. 54 (1), 476-481 (2013).
- Hammond, B. R., Sreenivasan, V., Suryakumar, R. The effects of blue light-filtering intraocular lenses on the protection and function of the visual system. Clinical Ophthalmology. 13, 2427-2438 (2019).
- Hammond, B. R. Attenuating photostress and glare disability in pseudophakic patients through the addition of a short-wave absorbing filter. Journal of Ophthalmology. 2015, 607635(2015).
- Hammond, B., Renzi, L. M., Sachak, S., Brint, S. Contralateral comparison of blue-filtering and non-blue-filtering intraocular lenses: glare disability, heterochromatic contrast, and photostress recovery. Clinical Ophthalmology. 4, 1465-1473 (2010).
Reprints and Permissions
Request permission to reuse the text or figures of this JoVE article
Request PermissionThis article has been published
Video Coming Soon
Copyright © 2025 MyJoVE Corporation. All rights reserved