Method Article
Conventional and Threshold-Tracking Transcranial Magnetic Stimulation Tests for Single-handed Operation
In This Article
Summary
We present a suite of standardized single- and paired-pulse transcranial magnetic stimulation (TMS) recording protocols, with options for conventional amplitude measurements and threshold-tracking. This program can control three different types of magnetic stimulators and is designed to enable all tests to be performed conveniently by a single operator.
Abstract
Most single-pulse transcranial magnetic stimulation (TMS) parameters (e.g., motor threshold, stimulus-response function, cortical silent period) are used to examine corticospinal excitability. Paired-pulse TMS paradigms (e.g., short- and long-interval intracortical inhibition (SICI/LICI), short-interval intracortical facilitation (SICF), and short- and long-latency afferent inhibition (SAI/LAI)) provide information about intracortical inhibitory and facilitatory networks. This has long been done by the conventional TMS method of measuring changes in the size of the motor-evoked potentials (MEPs) in response to stimuli of constant intensity. An alternative threshold-tracking approach has recently been introduced whereby the stimulus intensity for a target amplitude is tracked. The diagnostic utility of threshold-tracking SICI in amyotrophic lateral sclerosis (ALS) has been shown in previous studies. However, threshold-tracking TMS has only been used in a few centers, in part due to the lack of readily available software but also perhaps due to uncertainty over its relationship to conventional single- and paired-pulse TMS measurements.
A menu-driven suite of semi-automatic programs has been developed to facilitate the broader use of threshold-tracking TMS techniques and to enable direct comparisons with conventional amplitude measurements. These have been designed to control three types of magnetic stimulators and allow recording by a single operator of the common single- and paired-pulse TMS protocols.
This paper shows how to record a number of single- and paired-pulse TMS protocols on healthy subjects and analyze the recordings. These TMS protocols are fast and easy to perform and can provide useful biomarkers in different neurological disorders, particularly neurodegenerative diseases such as ALS.
Introduction
Transcranial magnetic stimulation (TMS) of the motor cortex is a non-invasive method for examining cortical physiology and the pathophysiology of many neurological conditions, including neurodegenerative diseases1. The primary motor cortex is stimulated using suprathreshold TMS pulses to produce a motor response in the target muscle. This response is called the motor-evoked potential (MEP). TMS serves as a useful tool that interrogates cortical and potentially subcortical motor networks2. Single-pulse TMS can assess cortical reactivity, resting motor threshold (RMT), MEP amplitude, and cortical silent period (CSP)2. Cortical inhibition can be probed using paired-pulse TMS at interstimulus intervals (ISIs) of 2-3 ms (SICI) or ~100 ms (LICI)3,4,5.
SICI is mediated by gamma-aminobutyric acid (GABA)A and LICI by GABAB receptors as indicated by their pharmacology4,5. The circuitry underlying SICF is mediated in part by glutamatergic N-methyl-D-aspartic acid (NMDA) receptors6,7. MEP amplitude is reduced if TMS is preceded by electrical stimulation of a peripheral sensory nerve. This effect is called afferent inhibition and is known as SAI when the ISI is ~20-25 ms and LAI at longer ISIs of 200-1000 ms between the electrical stimulation of the peripheral nerve and the single pulse of TMS8,9,10. SAI is modulated by cholinergic activity11; however, LAI is significantly understudied, and the neural circuits underlying this phenomenon are unclear 10.
MEP amplitudes are variable, and endpoint estimates in conventional TMS (cTMS) methods usually use arithmetic averages of 10 to 20 responses evoked with a fixed stimulus intensity. An alternative approach is threshold-tracking TMS, first described over 20 years ago12,13. In this case, the intensity of successive stimuli is varied to achieve a fixed target amplitude response. Both conventional and threshold-tracking techniques can be used with different ISIs. In the first version of this approach applied to SICI, namely 'serial' threshold-tracking (T-SICIs), a similar tracking method was used to the one employed in nerve excitability testing: the 'threshold' was first estimated at one interstimulus interval (ISI) and then tracked serially at successive ISIs. This method has been widely used by one group and advocated as a potential biomarker for ALS because of its high diagnostic utility14,15,16,17. However, their findings have yet to be confirmed by any other research group14,15,16,17.
The serial approach is efficient when reference thresholds are stable, as in peripheral nerves. However, when thresholds fluctuate widely, as is the case for corticospinal excitability, serial tracking has been found to have the disadvantage of seriously distorting the ISI-dependence of SICI18. Therefore, an alternative 'parallel' threshold-tracking paradigm may be more appropriate for SICI (T-SICIp)18,19 and other paired-pulse protocols, in which thresholds are estimated independently, in parallel, for different ISIs.
Despite their promise, existing TMS methods have not yet been accepted in clinics as reliable diagnostic tests or biomarkers in clinical trials. This may be due to several limitations of the existing TMS methods, such as time consumption, demand for manual operation, and poor reproducibility. To help overcome these limitations, this paper describes a suite of recently developed automated, fast, single- and paired-pulse TMS protocols, designed for single-handed operation and to enable comparison between conventional and serial and parallel threshold-tracking approaches.
The equipment used here includes a TMS machine, an isolated linear bipolar constant-current stimulator, a noise eliminator to remove 50-60 Hz electrical interference, an electromyography amplifier, and a data acquisition system. The software is versatile enough to operate with other amplifiers, stimulators, and recording conditions.
Protocol
NOTE: All subjects must give their written consent prior to the examination, and the protocol must be approved by the appropriate local ethical review board(s). All methods described here were approved by the Regional Scientific Ethical Committee and the Danish Data Protection Agency.
The TMS method involves three stages: 1) preparation of the subject, 2) recording the TMS, and 3) analyzing the results.
1. Preparation of the subject
- Assess the subjects' medical history and ask whether the subject has epilepsy, a pacemaker, or any kind of metallic devices/implants in the body, and for the female subjects, whether she is pregnant.
- Instruct the subject in detail about the examinations and invite them to give written consent.
- Inform the subject about the application of magnetic stimulation to the scalp and that each examination takes approximately 10 min.
- Explain that the stimulation will be heard as a click sound and is meant to evoke a muscle twitch and that some stimuli may feel slightly unpleasant.
- Explain that the stimulation can be turned off at any time if signaled by the subject.
- Ask the subject to wear a swimming cap.
- Clean the subject's hand contralateral to the studied hemisphere.
- Place the active recording electrode over the first dorsal interosseous (FDI) muscle and the reference electrode on the 2nd metacarpophalangeal joint.
- Place a ground electrode on the dorsum of the hand.
- Connect the recording and ground electrodes to the amplifier.
- Instruct the subject to remain alert but relaxed during the examination.
2. TMS recording
NOTE: The description below applies to the specific software and instruments used (see the Table of Materials); these will need to be adapted for other hardware.
- Turn on the TMS device.
- Start the semi-automated recording software using the protocol for TMS recordings.
- Select the gain and gating options from the menu (Table 1). Click on OK to continue.
- Select the protocol CSP from the main options.
- Place the coil at approximately 4 cm left in the binauricular line from the vertex, with the handle pointing 45° to the parasagittal plane for posterior-anterior current induction.
- Increase the stimulus intensity manually by clicking on the Insert key until an MEP is obtained.
- Move the position of the coil slightly while monitoring MEPs to find the hotspot.
- Draw the outline of the coil on a swimming cap once the hotspot is located to enable constant coil positioning.
- Click on OK to initiate the automated stimulation protocol.
NOTE: The recording continues automatically, starting with the determination of the RMT at 200 µV. - Instruct the subject to maintain comfortable activation of the FDI muscle to measure the active motor threshold (AMT) for a 200 µV response.
- Click on OK to measure the silent periods with or without a pause between the 3 groups of 10 up and down cycles of stimuli.
NOTE: For each group of 10, the stimulus is increased from 0.8 to 1.6 × RMT200, at intervals of 0.2, and then repeated in the reverse order. - Tell the subject to relax after the last stimulus and click on OK to return to the main menu.
- Select the protocol SICI from the main options.
- Select the planned ISIs to be studied from the menu SICI ISI options and the number of stimuli at each ISI from the menu Number of stimuli per ISI if the defaults are not used.
- Select the ASICI from the menu.
NOTE: The recording continues automatically, starting with the determination of the RMT at 200 µV and then at 1000 µV. SICI recording starts automatically after the determination of the RMT and continues for approximately 10 min. Test stimulus is fixed at RMT1000 and conditioning stimuli at 70% of RMT200. The following ISIs are selected in a pseudorandom order: 1, 1.5, 2, 2.5, 3, 3.5, 4, 5, and 7 ms. Test-alone stimuli are given after each three paired stimuli. Thus, each paired stimulus is delivered 10 times, making a total of 120 stimuli. - Ensure that the coil position is stable by observing the outline on the swimming cap, MEP on the screen, and contractions in the muscle during the recording.
- When the screen returns automatically to the main menu options when the protocol is completed, select the TSICIp from the menu.
NOTE: The recording continues automatically, starting with the determination of the RMT at 200 µV and then SICI recording for approximately 10 min. RMT200 is tracked continuously by decreasing stimulus by 1% maximal stimulator output (MSO) if the response is more than 250 µV and increasing it by 1% if the response is less than 160 µV. The test-alone stimuli alternate with paired stimuli, and the paired stimuli are delivered with pseudorandomized ISIs: 1, 1.5, 2, 2.5, 3, 3.5, 4, 5, and 7 ms. Thus, a total of 120 stimuli are delivered, 10 times for each of the 9 paired stimuli and test-alone stimuli after each three paired stimuli. - After the screen returns automatically to the main menu options when the protocol is completed, click on Finish unless another protocol will be run.
- Finish the recording by clicking on the Close file and save data button.
3. TMS analyses
- Start the analyzing software program to do the analyses offline.
- Select the recording which will be analyzed and click on the OK button.
- Select Create TMS MEM file option from the TMS menu for the analysis.
- Click on OK to save the MEM file.
- Click on Plot TMS MEM/MEF option from the TMS menu for the comparison of the individual subject´s recording with a group of healthy controls.
- Click on the 1st option on the MEF file name menu. Then, click on the MEF file with which the comparison will be made from the list of MEF files.
- Click on the 1st option on the MEM file name menu. Then, click on the MEM file with which the comparison will be made from the list of MEM files.
- Superimpose the MEM and MEF files using different options of 95% confidence intervals, standard deviations, or standard errors.
Results
The following results were obtained in one healthy subject. RMT for a 200 µV (RMT200) or a 1000 µV (RMT1000) peak-to-peak response were detected by a '4→2→1' tracking rule and logarithmic regression as previously described18. The RMT200 was 52.1% MSO, and the RMT1000 was 59.8% MSO.
All paired-pulse TMS options may be determined in amplitude, parallel threshold-tracking, and serial threshold-tracking modes. Here, only the amplitude and parallel threshold-tracking modes will be summarized. Accordingly, the ISIs, the number of stimuli at each ISI, and the level of stimulus intensity for the conditioning stimuli may be selected from the Menu. Here, we only describe the default options for these.
Figure 1 shows the setup, including stimulation with a figure-of-eight coil, recording with surface electrodes, the computer with installed software, the TMS machine, the noise eliminator to remove 50-60 Hz electrical interference, the isolated linear bipolar constant-current stimulator, the electromyography amplifier, and a data acquisition system.
Figure 2 shows SICI as A-SICI (Figure 2A) and T-SICI parallel (Figure 2B) as described in the protocol section. Figure 3 shows LICI as A-LICI (Figure 3A) and T-LICI parallel (Figure 3B). For A-LICI, after finding the hotspot, the program determines RMT1000 and sets both test and conditioning stimuli to this amplitude. Test-alone stimuli are delivered as every 4th stimulus, and conditioning+test stimuli at intervals of 50, 100, 150, 200, 250, and 300 ms are delivered pseudorandomly. Ten stimuli are delivered at each ISI. Similarly, for T-LICI, 10 paired pulses at the same 6 ISIs as for A-LICI from 50 to 300 ms are delivered, and the thresholds for RMT200 are tracked while conditioning stimulus is set to 120% of the tracked RMT200.
Figure 4 shows SICF as A-SICF (Figure 4A) and T-SICF parallel (Figure 4B). For A-SICF, after finding the hotspot, the program determines RMT50 and RMT1000. Test stimuli are then set to RMT1000 and conditioning stimuli to 90% of RMT50. The range of ISIs is from 1 to 4.9 by 0.3 ms. Test-alone stimuli are delivered as every 4th or 5th stimulus, and the 14 conditioning+test stimuli are delivered in pseudorandom order. As for A-SICF, T-SICF is measured at 14 ISIs from 1 to 4.9 ms, and the threshold is tracked with 10 paired pulses at each ISI.
Figure 5 shows SAI as A-SAI (Figure 5A) and T-SAI parallel (Figure 5B). SAI protocols involve stimulating the somatosensory afferents in the nerve and recording the effects on the MEP excited ~20 ms later. This MEP latency ('N20') is important for the timing of the stimuli. The program asks the user to select the latency from a range (16-23 ms) or to specify it if outside this range. To determine the N20 latency, a conventional somatosensory evoked potential may be performed, or age- and height-corrected laboratory controls may be used.
For the A-SAI, the electrical stimulus intensity for a 1-mV compound muscle action potential is first determined (EMT1000). Then, the hotspot is found for magnetic stimulation, and RMT1000 is determined. The program then combines magnetic and electrical stimuli with ISIs from N20-2 to N20+12 ms. Test-alone stimuli are given as every 4th stimulus, while the conditioning+test stimuli are given in pseudorandom order. For T-SAI similar to A-SAI, EMT1000 is first determined. Then, stimulation switches to the magnetic stimulus, and the hotspot is determined in the usual way. The program then determines RMT200 in a manner similar to the other tracking protocols. Further, the program then runs straight into tracking SAI, with the ISI between electrical stimulus and magnetic test stimulus increased in 1 ms steps from N20-2 to N20+12 ms.
Figure 6 shows LAI as A-LAI (Figure 6A) and T-LAI parallel (Figure 6B). The LAI protocols for recording long-interval afferent inhibition are the same as for SAI, except that because the intervals are much longer (200 to 1000 ms, in 100 ms steps), the N20 interval is disregarded and does not have to be entered.
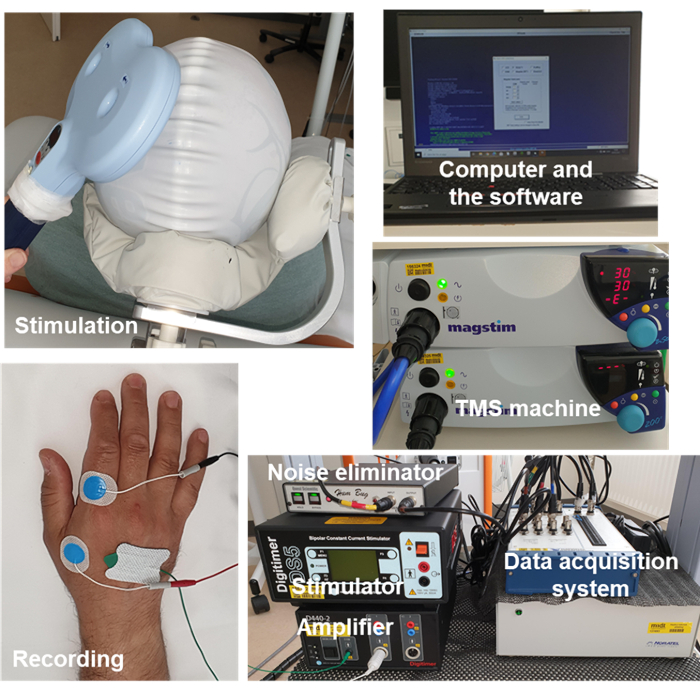
Figure 1: The setup. Setup includes stimulation with a figure-of-eight coil, recording with surface electrodes, the computer with installed software, the TMS machine, the noise eliminator to remove 50-60 Hz electrical interference, the isolated linear bipolar constant-current stimulator, the electromyography amplifier, and a data acquisition system. Abbreviation: TMS = transcranial magnetic stimulation. Please click here to view a larger version of this figure.
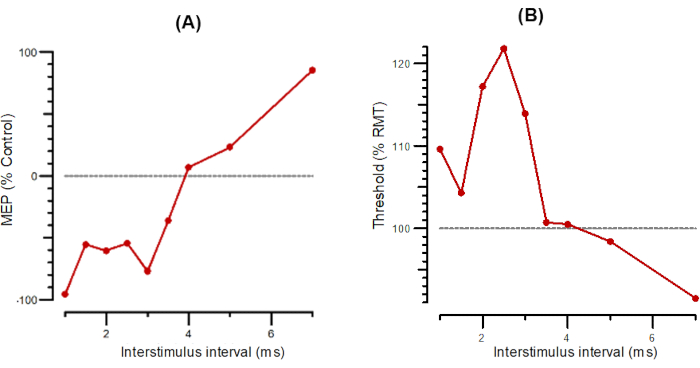
Figure 2: A-SICI and T-SICI plotted as a function of interstimulus intervals from 1 ms to 7 ms. (A) A-SICI plotted as the amplitude of conditioned response as a percentage of control. (B) T-SICI plotted as threshold changes (inhibition as percentage of control). Abbreviations: A-SICI = amplitude of short-interval intracortical inhibition; T-SICI = threshold changes in short-interval intracortical inhibition; MEP = motor-evoked potential; RMT = resting motor threshold. Please click here to view a larger version of this figure.
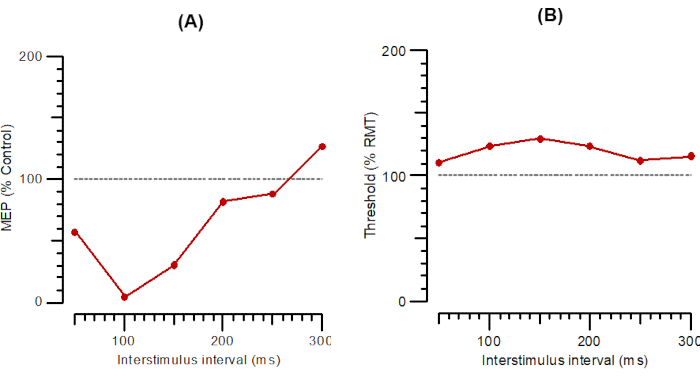
Figure 3: A-LICI and T-LICI plotted as a function of interstimulus intervals from 1 ms to 300 ms. (A) A-LICI plotted as the amplitude of conditioned response as a percentage of control. (B) T-LICI plotted as threshold changes (inhibition as a percentage of control). Abbreviations: A-SICI = amplitude of short-interval intracortical inhibition; T-SICI = threshold changes in short-interval intracortical inhibition; MEP = motor-evoked potential; RMT = resting motor threshold. Please click here to view a larger version of this figure.
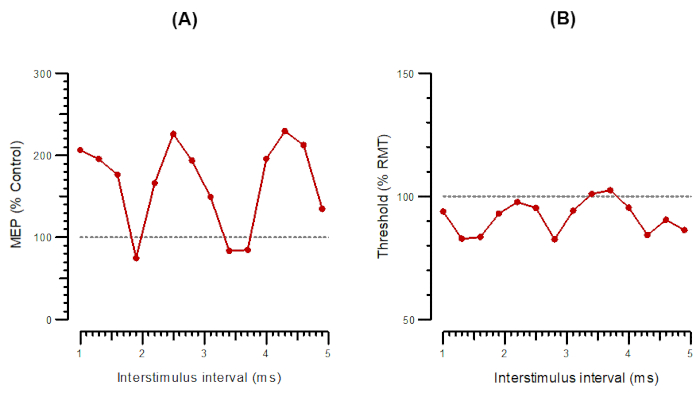
Figure 4: A-SICF and T-SICF plotted as a function of interstimulus intervals from 1 ms to 4.9 ms. (A) A-SICF plotted as the amplitude of conditioned response as a percentage of control. (B) T-SICF plotted as threshold changes (inhibition as a percentage of control). Abbreviations: A-SICF = amplitude of short-interval intracortical facilitation; T-SICF = threshold changes in short-interval intracortical facilitation; MEP = motor-evoked potential; RMT = resting motor threshold. Please click here to view a larger version of this figure.
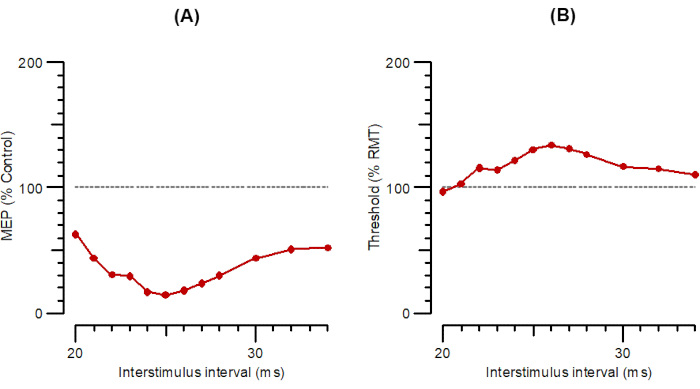
Figure 5: A-SAI and T-SAI plotted as a function of interstimulus intervals from 20 ms to 35 ms. (A) A-SAI plotted as the amplitude of conditioned response as a percentage of control. (B) T-SAI plotted as threshold changes (inhibition as a percentage of control). Abbreviations: A-SAI = amplitude of short-latency afferent inhibition; T-SAI = threshold changes in short-latency afferent inhibition; MEP = motor-evoked potential; RMT = resting motor threshold. Please click here to view a larger version of this figure.
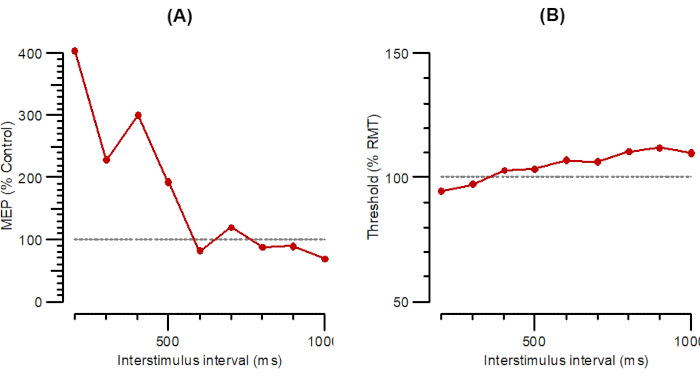
Figure 6: A-LAI and T-LAI plotted as a function of interstimulus intervals from 200 ms to 1000 ms. (A) A-LAI plotted as the amplitude of conditioned response as a percentage of control. (B) T-LAI plotted as threshold changes (inhibition as a percentage of control). Abbreviations: A-LAI = amplitude of long-latency afferent inhibition; T-LAI = threshold changes in long-latency afferent inhibition; MEP = motor-evoked potential; RMT = resting motor threshold. Please click here to view a larger version of this figure.
Table 1: The available TMS protocols in the software. Abbreviations: TMS = transcranial magnetic stimulation; SICI = Short interval intracortical inhibition; SICF = Short interval intracortical facilitation; LICI = Long interval intracortical inhibition; SAI = Short latency afferent inhibition; LAI = Long latency afferent inhibition; µV = microvolt. Please click here to download this Table.
Discussion
TMS measurement, as programmed in the recording software, is a highly automated procedure. However, particular attention is required to obtain reliable results. In the recording stage, it is important to ensure a consistent MEP response over the hotspot and then keep the coil in the same position relative to the skull of the subject throughout the whole recording. As vigilance has a prominent influence on cortical excitability20, special care is needed to keep the subject relaxed but alert.
To keep the subject alert, short questions should be posed regularly. Additionally, the examiner should keep an eye on muscle contractions to ascertain whether the target muscle is being stimulated. Moreover, the examiner should monitor the screen to observe whether the MEP amplitude or the threshold changes are indicating any coil displacement, in addition to checking the outline on the swimming cap. If the coil has been displaced, the user should try to replace it in position using the drawing. If this fails, the recording should be restarted. The influence of coil displacement is minimized in these protocols by the pseudorandom order of the ISIs and by giving a test-alone stimulus after each set of three paired stimuli. Another way to enable the position of a TMS coil to be tracked in real time is by a neuronavigation system. Such systems are commercially available and effective; however, the high cost limits their use. Please note that no data is provided here on patients with ALS or other neurodegenerative disorders. Additional challenges may arise in these patients such as low amplitudes due to peripheral motor neuron loss, spontaneous activity, and inexcitability.
All protocols in this study (single- and paired-pulse) were carried out with a figure-of-eight coil (Magstim, D70 Remote coil) connected to a Bistim2 Module. This was done to maintain a comparable strength of magnetic field between the protocols as the stimulus is attenuated when passing through the Bistim module. The system was set to the Independent Bistim Triggering mode allowing individual external triggering of the two Magstim 2002 units. For single-pulse protocols, the intensity of one of the units was set to 0% MSO. The recordings are made using a recording protocol, which is a part of a software program. For the other types of magnetic stimulators, only one unit is required.
A limitation of the TMS method is the variability. Previous studies showed that the inter-individual variability is higher than intra-day or inter-day variability on the same subject19,21. Attention should be paid to the standardization of the method and to eliminate possible technical mistakes that can affect reliability. TMS cannot be used in certain conditions such as patients with a pacemaker or epilepsy. International rules for safety should be followed22. Additionally, slight discomfort may be expected, particularly if a circular coil23 is used. However, the discomfort is often minimal and need not cause discontinuation of the examination.
The methods described in this manuscript are automated both for recordings and analyses compared to the existing methods. This allows the recordings to be performed by a single operator, and the operator does not need to interfere with anything other than keeping the coil in the same place. Each protocol has been designed to take ~10 min, which makes it possible to run several protocols in an hour, the time that will probably take for one protocol with the existing manual methods. The magnetic stimuli are delivered every 4 s in this study; however, other magnetic devices allow faster stimulation, allowing the recording duration for each protocol to be reduced to less than 5 min. The software described here also allows the selection of different ISIs, numbers of stimuli for each ISI, and conditioning stimulus level. A major advance of the method described here is a gating function, which automatically removes traces when the subject is not relaxed.
In conclusion, the methods described here can provide invaluable information to understand the underlying mechanisms of several brain disorders, particularly neurodegenerative disorders, such as ALS, and may have diagnostic value. Further studies are necessary for different patient populations and larger groups to determine the diagnostic value of conventional and threshold-tracking TMS measures, and whether these measures may indeed be used as biomarkers for neurodegenerative disorders. Studies recording TMS in different muscles and both upper and lower extremities are also warranted.
Disclosures
HB and JH receive royalties from UCL for sales of the Qtrac software used in this study. The other authors have no potential conflicts of interest.
Acknowledgements
This study was financially supported mainly by the two grants from Lundbeck Foundation (Grant number R290-2018-751) and Independent Research Fund Denmark (Grant number: 9039-00272B).
Materials
| Name | Company | Catalog Number | Comments |
| 50 Hz Noise Eliminator | Digitimer Ltd | Humbug | |
| Analogue-to-Digital Converter | National Instruments | NI-6221 | |
| Recording program | Digitimer Ltd (copyright University College London) | QtracS.EXE | |
| TMS recording protocol | Digitimer Ltd (copyright QTMS Science) | QTMSG-12 recording protocol | |
| Disposable surface recording electrodes | AMBU | Ambu® BlueSensor NF | |
| Figure-of-8 coil | Magstim Co. Ltd, Whiteland, Wales, UK | Magstim® D70 Remote Coil | |
| Isolated EMG amplifier | Digitimer Ltd | D440 | |
| Isolated linear bipolar constant-current stimulator | Digitimer Ltd | DS5 | |
| TMS device | Magstim Co. Ltd, Whiteland, Wales, UK | Magstim® 2002 stimulators (2 MagStim units are required ) | |
| Analysis and plotting program | Digitimer Ltd (copyright University College London) | QtracP.EXE |
References
- Rawji, V., Latorre, A., Sharma, N., Rothwell, J. C., Rocch, L. On the use of TMS to investigate the pathophysiology of neurodegenerative diseases. Frontiers in Neurology. 11, 584664 (2020).
- Rossini, P. M., et al. Non-invasive electrical and magnetic stimulation of the brain, spinal cord, roots and peripheral nerves: Basic principles and procedures for routine clinical and research application. An updated report from an I.F.C.N Committee. Clinical Neurophysiology. 126 (6), 1071-1107 (2015).
- Ziemann, U., Rothwell, J. C., Ridding, M. C. Interaction between intracortical inhibition and facilitation in human motor cortex. Journal of Physiology. 496, 873-881 (1996).
- Ziemann, U., Tergau, F., Wischer, S., Hildebrandt, J., Paulus, W. Pharmacological control of facilitatory I-wave interaction in the human motor cortex. A paired transcranial magnetic stimulation study. Electroencephalography and Clinical Neurophysiology. 109 (4), 321-330 (1998).
- Premoli, I., et al. Short-interval and long-interval intracortical inhibition of TMS-evoked EEG potentials. Brain Stimulation. 11 (4), 818-827 (2018).
- Ilic, T. V., et al. Short-interval paired-pulse inhibition and facilitation of human motor cortex: the dimension of stimulus intensity. Journal of Physiology. 545 (1), 153-167 (2002).
- Peurala, S. H., Muller-Dahlhaus, J. F., Arai, N., Ziemann, U. Interference of short-interval intracortical inhibition (SICI) and short-interval intracortical facilitation (SICF). Clinical Neurophysiolology. 119 (10), 2291-2297 (2008).
- Tokimura, H., et al. Short latency inhibition of human hand motor cortex by somatosensory input from the hand. Journal of Physiology. 523, 503-513 (2000).
- Chen, R., Corwell, B., Hallett, M. Modulation of motor cortex excitability by median nerve and digit stimulation. Experimental Brain Research. 129 (1), 77-86 (1999).
- Turco, C. V., et al. long-latency afferent inhibition; uses, mechanisms and influencing factors. Brain Stimululation. 11 (1), 59-74 (2018).
- Di Lazzaro, V., et al. Effects of lorazepam on short latency afferent inhibition and short latency intracortical inhibition in humans. Journal of Physiolology. 564, 661-668 (2005).
- Fisher, R. J., Nakamura, Y., Bestmann, S., Rothwell, J. C., Bostock, H. Two phases of intracortical inhibition revealed by transcranial magnetic threshold tracking. Experimental Brain Research. 143 (2), 240-248 (2002).
- Awiszus, F., Feistner, H., Urbach, D., Bostock, H. Characterisation of paired-pulse transcranial magnetic stimulation conditions yielding intracortical inhibition or I-wave facilitation using a threshold-hunting paradigm. Experimental Brain Research. 129 (2), 317-324 (1999).
- Vucic, S., Kiernan, M. C. Novel threshold tracking techniques suggest that cortical hyperexcitability is an early feature of motor neuron disease. Brain. 129, 2436-2446 (2006).
- Vucic, S., et al. Utility of threshold tracking transcranial magnetic stimulation in ALS. Clinical Neurophysiolology Practice. 3, 164-172 (2018).
- Vucic, S., Kiernan, M. C. Axonal excitability properties in amyotrophic lateral sclerosis. Clinical Neurophysiolology. 117 (7), 1458-1466 (2006).
- Vucic, S., Howells, J., Trevillion, L., Kiernan, M. C. Assessment of cortical excitability using threshold tracking techniques. Muscle Nerve. 33 (4), 477-486 (2006).
- Tankisi, H., et al. Short-interval intracortical inhibition as a function of inter-stimulus interval: Three methods compared. Brain Stimululation. 14 (1), 22-32 (2021).
- Samusyte, G., Bostock, H., Rothwell, J., Koltzenburg, M. Short-interval intracortical inhibition: Comparison between conventional and threshold-tracking techniques. Brain Stimululation. 11 (4), 806-817 (2018).
- Noreika, V., et al. Alertness fluctuations when performing a task modulate cortical evoked responses to transcranial magnetic stimulation. Neuroimage. 223, 117305 (2020).
- Boroojerdi, B., Kopylev, L., Battaglia, F., et al. Reproducibility of intracortical inhibition and facilitation using the paired-pulse paradigm. Nerve. 23 (10), 1594-1597 (2000).
- Rossi, S., et al. Safety and recommendations for TMS use in healthy subjects and patient populations, with updates on training, ethical and regulatory issues: Expert Guidelines. Clinical Neurophysiolology. 132 (1), 269-306 (2021).
- Ørskov, S., et al. Comparison of figure-of-8 and circular coils for threshold tracking transcranial magnetic stimulation measurements. Neurophysiologie Clinique. 51 (2), 153-160 (2021).
Reprints and Permissions
Request permission to reuse the text or figures of this JoVE article
Request PermissionExplore More Articles
This article has been published
Video Coming Soon
Copyright © 2025 MyJoVE Corporation. All rights reserved