Method Article
Non-Invasive Monitoring of Microvascular Oxygenation and Reactive Hyperemia using Hybrid, Near-Infrared Diffuse Optical Spectroscopy for Critical Care
* These authors contributed equally
In This Article
Summary
We describe a protocol to non-invasively and continuously measure absolute microvascular blood flow index and blood oxygen saturation using a multi-modal device based on near-infrared diffuse optics. We then evaluate the metabolic rate of oxygen consumption and reactive hyperemia utilizing a vascular occlusion test.
Abstract
The detection of levels of impairment in microvascular oxygen consumption and reactive hyperemia is vital in critical care. However, there are no practical means for a robust and quantitative evaluation. This paper describes a protocol to evaluate these impairments using a hybrid near-infrared diffuse optical device. The device contains modules for near-infrared time-resolved and diffuse correlation spectroscopies and pulse-oximetry. These modules allow the non-invasive, continuous, and real-time measurement of the absolute, microvascular blood/tissue oxygen saturation (StO2) and the blood flow index (BFI) along with the peripheral arterial oxygen saturation (SpO2). This device uses an integrated, computer-controlled tourniquet system to execute a standardized protocol with optical data acquisition from the brachioradialis muscle. The standardized vascular occlusion test (VOT) takes care of the variations in the occlusion duration and pressure reported in the literature, while the automation minimizes inter-operator differences. The protocol we describe focuses on a 3-min occlusion period but the details described in this paper can readily be adapted to other durations and cuff pressures, as well as other muscles. The inclusion of an extended baseline and post-occlusion recovery period measurement allows the quantification of the baseline values for all the parameters and the blood/tissue deoxygenation rate that corresponds to the metabolic rate of oxygen consumption. Once the cuff is released, we characterize the tissue reoxygenation rate, magnitude, and duration of the hyperemic response in BFI and StO2. These latter parameters correspond to the quantification of the reactive hyperemia, which provides information about the endothelial function. Furthermore, the above-mentioned measurements of the absolute concentration of oxygenated and deoxygenated hemoglobin, BFI, the derived metabolic rate of oxygen consumption, StO2, and SpO2 provide a yet-to-be-explored rich data set that can exhibit disease severity, personalized therapeutics, and management interventions.
Introduction
Critically ill patients, particularly those with sepsis and other similar conditions, often exhibit impaired reactive hyperemia and microvascular oxygenation1,2,3. During the first waves of COVID-19 pandemic, an unforeseen number of patients required intensive care management, during which the impact of the virus on the endothelium became evident but without a clear strategy to assess and manage4,5,6. As a result, there has been a growing recognition of the importance of detecting endothelial dysfunction, which can be indirectly evaluated by reactive hyperemia, in critical care, i.e., the intensive care unit (ICU) populations7. A practical, robust, and widely available assessment of oxygen delivery and consumption to the tissues is expected to be of utmost importance in optimizing resuscitation strategies and directly addressing microcirculatory issues. Studies have consistently demonstrated that persistent microcirculatory alterations and lack of coherence between macrocirculation and microcirculation are, to some extent, predictive of organ failure and unfavorable outcomes in patients affected by septic shock or hemorrhagic shock, among other critical conditions, even when systemic parameters are considered to be normal8,9,10. It has become evident that relying solely on macrocirculatory parameters is inadequate, as microcirculation plays a critical role in tissue oxygenation and organ function11,12,13. This paper describes a protocol that uses a new multi-modal device based on near-infrared diffuse optical technologies that has been developed within an international consortium that focuses on ICU patients. The project, VASCOVID (https://vascovid.eu), was motivated by the COVID-19 pandemic to evaluate microvascular health in peripheral muscles in intensive care. We have designed a protocol using the developed VASCOVID device that aims to enhance our understanding of these parameters and how these parameters can be useful in managing critically ill patients with a much broader scope than COVID-19 patients.
Near infrared spectroscopy (NIRS) has been utilized to assess microcirculation non-invasively for decades in a broad range of clinical applications including, the ICU patients14,15,16,17. It is important to note that the simplest application of NIRS, i.e., continuous wave NIRS (CW-NIRS), is implemented in widely used and clinically approved devices17,18, used for measuring the absolute concentrations of oxy- (HbO) and deoxy-hemoglobin (HbR) to calculate the blood/tissue oxygen saturation (StO2) of the microvasculature. While these devices have found niche uses in clinical management, such as during cardiac surgery, they have clear limitations due to the physics of photon propagation in tissues. This means that their accuracy, precision, and repeatability are questionable, hence, they are often utilized as trend monitors19,20. Furthermore, their results are heavily influenced by superficial tissues such as the overlaying adipose and skin layers.
Time-resolved NIRS (TRS) employs short laser pulses in the picosecond range at multiple wavelengths to assess their delay and broadening after traversing through a tissue21. This allows TRS to separate the effects of absorption from scattering to obtain robust, accurate, and precise estimates, also allowing it to calculate the total hemoglobin concentration (HbT). Since TRS also resolves pathlengths, it can be utilized to better separate superficial signals from the deep signals of interest18,21. This comes at the cost of complexity, price, and bulkiness. However, in recent years, TRS systems have come down in complexity and cost, resulting in more accessible and easier-to-use devices. This manuscript describes a device that uses a compact original equipment manufacturer (OEM) commercial TRS module22,23.
Diffuse correlation spectroscopy (DCS) is another near-infrared technology that utilizes the temporal statistics of diffuse speckles to quantify the movement of light-scattering particles, which are dominated by red blood cells in tissues16,24. This, in turn, is well known to be an indicator of microvascular blood flow, which we refer to as the blood flow index (BFI)25. The simultaneous use of TRS and DCS in a hybrid optical device offers insights into oxygen metabolism by utilizing common models to derive the local oxygen extraction fraction and multiplying by the blood flow15,26,27.
In order to assess the microcirculation at the ICU, NIRS is often utilized with a vascular occlusion test (VOT), which is an ischemic challenge that is performed by blocking the blood supply to the probed peripheral muscle for a certain duration (a few minutes)28,29,30,31,32. Most commonly, it is executed by inflating a tourniquet wrapped around the upper arm above the systolic pressure33. During the VOT, the clinicians assess the response of the microvascular blood oxygenation to changes in blood flow to derive oxygen metabolism at rest and reactive hyperemia34. The assumption is that during the VOT, with the cuff inflated well above the limb occlusion pressure, there is no inflow or outflow of blood. Therefore, the start of VOT shows a downward slope of StO2, i.e., deoxygenation (DeO2), as oxygen is consumed by the tissue, which allows an estimate of the metabolic rate of oxygen consumption. When the VOT ends and the cuff is deflated, blood rushes in to compensate for its depletion, leading to a hyperemic response. This rush generates a sharp upward slope in StO2, i.e., a reoxygenation (ReO2). The hyperemic response, which is an increase beyond the initial baseline with a slow recovery back to the baseline, estimates the reactive hyperemia. The combination of NIRS with a VOT has gained increasing interest in intensive care due to its ease of use and potential for predicting adverse outcomes and even mortality in critical conditions such as sepsis35,36,37.
During the COVID-19 pandemic, our groups have initiated a worldwide consortium and recently completed the so-called HEMOCOVID-19 trial, showing an association between peripheral microcirculatory alterations and severity of acute respiratory distress syndrome in COVID-19 patients6. This was supported by other works as well7,38. All these studies were done with the above-mentioned CW-NIRS systems, hence suffering from their shortcomings. Furthermore, the execution of VOT was not standardized across different studies and is affected by various parameters like occlusion duration, tourniquet pressure, and operator-based variations29,39,40. A literature review clearly shows that for VOT and NIRS to gain traction in the clinics, it is important to measure blood flow, have standardized protocols, and have a robust NIRS system11. Therefore, we have proposed that by utilizing a more advanced form of NIRS (TRS), measuring blood flow, and standardizing the cuff control during VOT, a better discrimination of pathological conditions from healthy ones could be achieved. To that end, we have developed this hybrid diffuse optical device that integrates multiple modules encompassing two near-infrared diffuse optical modules of TRS and DCS, pulse oximetry, and an automated tourniquet. The pulse oximetry module provides the heart rate (HR), perfusion index, and percentage of arterial oxygen saturation (SpO2). A fast tourniquet is used in the device, which is critical for performing VOT. The device comes with an optional accessory box that allows us to acquire additional information during the use for extended and continuous quality control, such as routine and practical measurement of the instrument response function (IRF) for TRS and the measurement on a tissue-mimicking phantom for evaluating longitudinal stability. The device is shown as being utilized in the ICU in Figure 1.
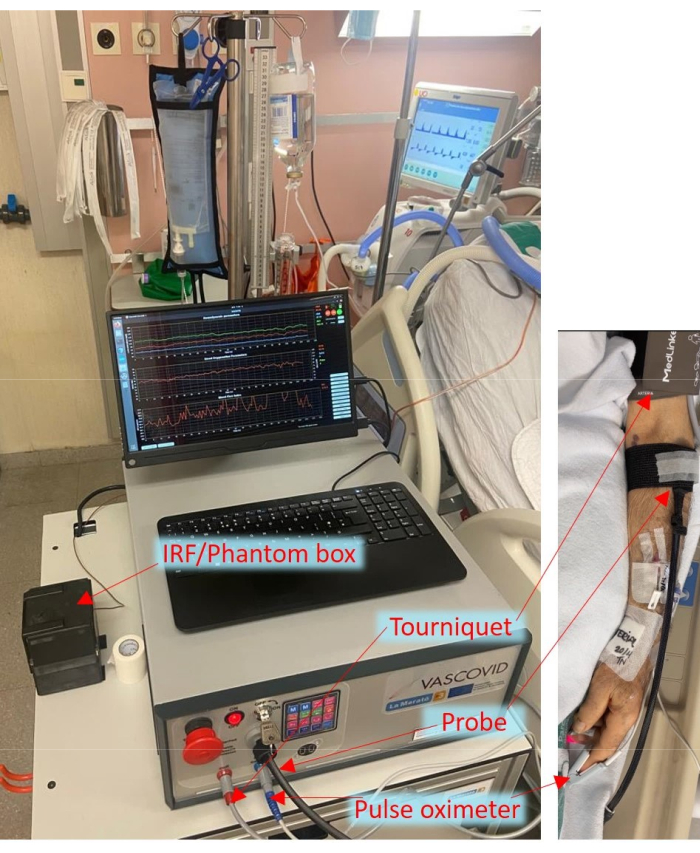
Figure 1: Bedside arrangement of the portable device in the ICU with the probes and cuff attached to the patient. Please click here to view a larger version of this figure.
The multimodal smart probe incorporates source and detector optical fibers for both TRS and DCS with optical filters inside the device that prevent interference between DCS and TRS. The source-detector separation used in this system is 25 mm. Additionally, the probe incorporates a capacitive touch sensor, providing a valuable safety feature to prevent laser hazards according to the laser safety standard (IEC 60601-2-22:2019)41. The laser safety system within the device ensures that the laser emission occurs only when the probe is in contact with the tissue. If detachment of the probe is detected, the lasers are immediately switched off, ensuring the safety of both patients and operators. Moreover, the probe is integrated with an accelerometer, load sensor, and light sensor for additional functionality and data collection purposes.
This paper describes the automated protocol where we probe the brachioradialis muscle simultaneously with a VOT using the developed device. The protocol timeline is shown in Figure 2. The protocol is completely automated, and no operator interventions are needed throughout its execution. By leveraging the capabilities of this novel device, we aim to gain valuable insights that let the physicians understand the physiopathology of peripheral oxygen consumption better and also assess the ratio of oxygen consumption and delivery thereby helping them to improve patient care comprehensively and efficiently.
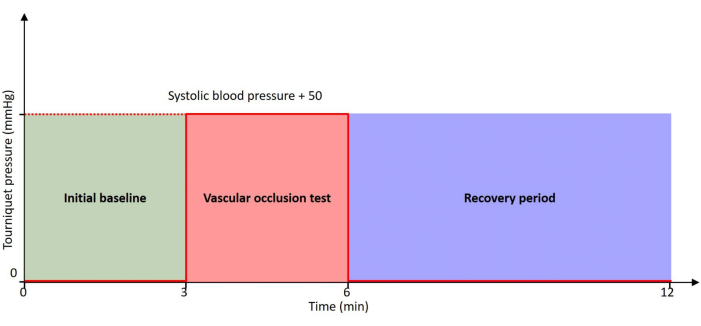
Figure 2: Protocol timeline. The patient is at rest throughout the timeline with 0 mmHg pressure at initial baseline and recovery period. The VOT is performed with a tourniquet inflated to a pressure of 50 mmHg higher than the patient's systolic blood pressure. Please click here to view a larger version of this figure.
Protocol
The study was approved by the local ethics committee at Parc Tauli Hospital Universitari. Informed and signed consent was obtained from the patients or their next of kin. Absolute contraindications for entering the protocol were: clinical suspicion or echographic confirmation of venous thrombosis in the studied arm, other vascular or traumatic injuries in the studied arm, skin loss of integrity or lesions that could hinder the probe placement.
1. Device self-test
- Switch on the device. The device starts with in-house developed software.
- Turn the safety key to ON position, place the probe completely inside the instrument response function (IRF) box, and press the Reset button on the probe if it is glowing.
- Press the OK button on the popup dialog box and wait until the device is ready.
NOTE: The device performs self-tests to ensure stable working. The user is notified by a popup message when the device is ready.
2. Optional IRF and phantom measurement
- Press OK when the device is ready.
- Press Yes when it asks to measure an IRF. The device automatically adjusts the laser intensity to reach the desired count rate of 1 million.
- Press the Stop button when a stable count rate and DTOF are observed. This IRF is saved in files as well as loaded in the software to be utilized for real time calculations.
- Insert the probe in the Phantom box properly so that the probe attached indicator is on.
- Press the Phantom button to start the phantom protocol.
NOTE: The quality control test verifies that a sufficient number of photons are received by the DCS and TRS detectors and also checks if the dark counts are within the desired limits. - Continue recording for at least 30 s after the quality control to have a sufficient amount of data saved for further offline analysis.
3. Bedside measurement preparation
- Attach the tourniquet on the upper arm above the elbow as done during a blood pressure measurement. Do not wrap the cuff loosely or very tightly around the arm.
NOTE: Loosely attaching the tourniquet requires more air to reach the desired pressure. Slow inflation allows the body to readjust its physiology. - Attach the pulse oximeter to the index finger of the same arm. If it is not possible to attach to the index finger, attach it to any other finger.
- Locate the brachioradialis muscle to be probed, which is in the lateral forearm just below the elbow. Ask the patient to open and close a fist to feel the muscle by placing fingers on the forearm. In the case of sedated patients or if they cannot move, trace the muscle by slightly twisting the arm with one hand. Feel the muscle between the thumb and fingers of the other hand.
- Measure the arm circumference around the located muscle using a soft measuring tape, as shown in Figure 3.
- Measure the approximate adipose tissue thickness on the top of the muscle by using a digital body fat caliper, as shown in Figure 4.
- Attach the probe head to the muscle with the optical fibers and cables going toward the hand, as shown in Figure 5.
NOTE: Do not attach the probe tightly; it can affect tissue physiology. Make sure the fibers are not touching moving objects, and it can create artifacts in the data. - Cover the probe with a black cloth to block the external light.
NOTE: If the patient is awake, inform him that the VOT can cause a tingling sensation and he should not move the arm.
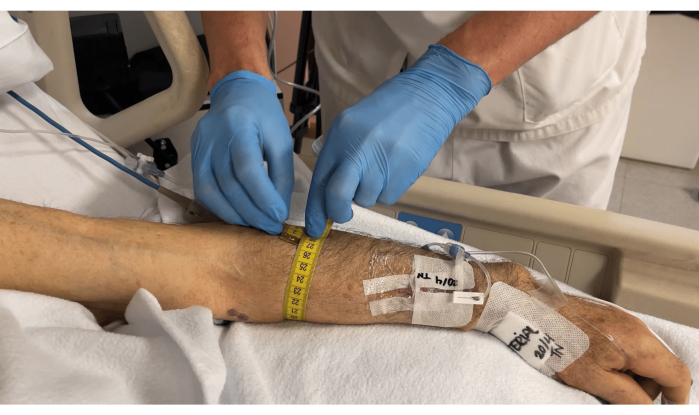
Figure 3: Measuring the arm circumference around the brachioradialis muscle. Please click here to view a larger version of this figure.
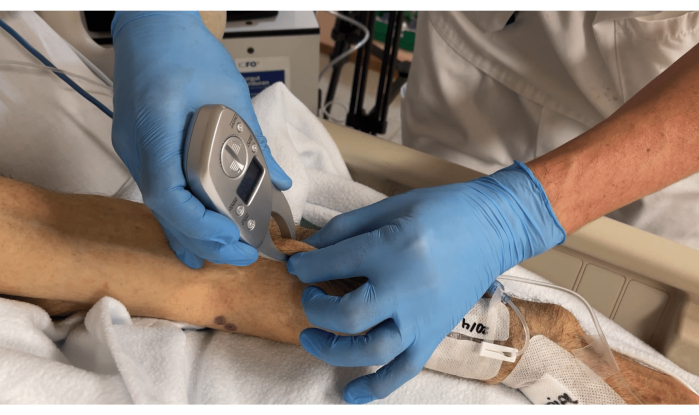
Figure 4: Measuring the adipose tissue thickness on top of the muscle using a body fat caliper. Please click here to view a larger version of this figure.
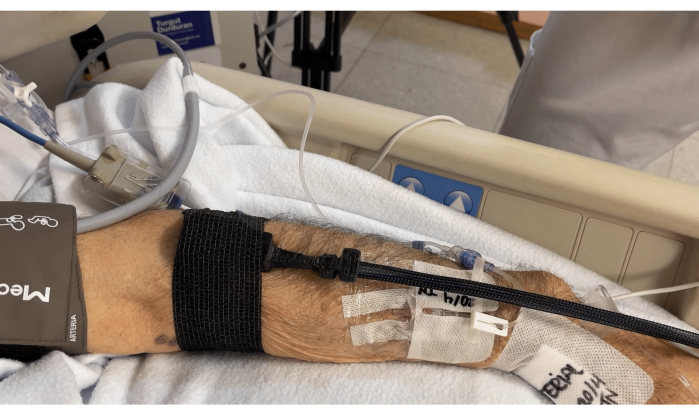
Figure 5: Probe attached to the muscle with fibers and cables going toward the hand. Please click here to view a larger version of this figure.
4. Data acquisition
- Ensure that the probe-attached LED indicator on the device's front panel is shining and the touch icon in the software is green, showing that the probe is attached.
- Press the Protocol timed button. Ensure it opens a new dialogue box, as shown in Figure 6. Enter the subject ID, operator ID, and the target pressure of 50 mmHg higher than the systolic blood pressure.
- Press OK to start the automated protocol. Real-time data is displayed in the graphs. The protocol starts with quality control that automatically adjusts laser power and checks the photon counts and the interference between modalities. The quality check is completed within 2 min. Observe the circular icons labeled TRS and DCS, which must turn green at the end of the data quality check.
NOTE: The green icons show that the photon count rate is within the desired range, there is no external light entering the probe, and there is no crosstalk between modalities. Hence, the measurement can be continued. The graphs are reset at the end of the quality phase, and signals representing patient data are plotted in real time. - Continue from step 2.6 if the TRS and DCS icons do not turn green and remain red at the end of the quality check. Press the Stop button to abort the protocol if the patient is unstable or requires sudden clinical intervention at any instant during the protocol.
- Press the Extend button to add 30 s of pre-occlusion duration if the patient moves the arm and does not have stable baseline signals.
NOTE: The operator can press the Extend button as many times and in any phase as required; each button press will add 30 s. - Ensure that the tourniquet automatically inflates to the desired pressure to start the VOT. Press + or - buttons to increase or decrease the desired occlusion pressure in steps of 5 mmHg if the blood pressure of the patient changes after starting the protocol. The start and stop of the VOT are automatically marked with yellow vertical lines.
NOTE: The software is set to continuously acquire data and to automatically perform 3 min of VOT after 3 min of baseline. The pre-defined standard protocol lasts for six more minutes after the completion of VOT to evaluate the recovery after the patient's hyperemic response is over and a stable condition is obtained. - Press OK when the operator is notified at the completion of the protocol through a popup notification, which marks the successful completion of the protocol.
- Remove the probes and the cuff from the patient and clean them using an alcohol swab or the equivalent.
- Write down the clinical and demographic information (according to the pre-defined study protocols) along with the circumference of the arm at the probe location and the thickness of the overlying adipose tissue in the patient data form manually.
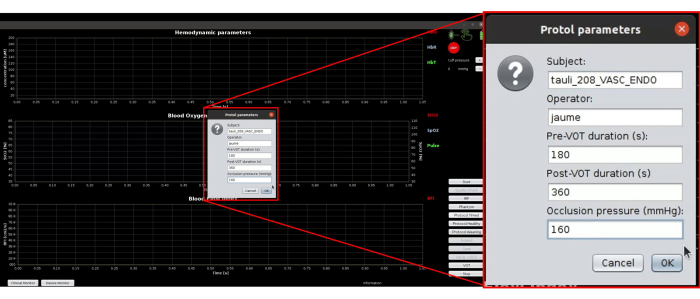
Figure 6: Screenshot of protocol parameters used for automatically executing the whole protocol. Please click here to view a larger version of this figure.
5. Data analysis
- Use a script/program written in one's favorite language (example Python or MATLAB) to open and visualize recorded binary data.
- Calculate the index of oxygen consumption that represents tissue metabolism and is defined as:

where Hb is the hematocrit, which is recorded from clinical charts of the patient in the patient data form. - Compute the rate of DeO2 (slope of StO2 from the onset of VOT to 1 min), amplitude of DeO2 (baseline StO2- minimum StO2), rate of ReO2 (slope of StO2 from completion of VOT to reaching peak value), amplitude of hyperemic peak of StO2 and BFI (peak values), and area under the curve (AUC) of the reactive response after VOT for both StO2 and BFI.
NOTE: The computation of real-time absolute values of HbO, HbR, HbT, and StO2 is achieved by fitting algorithm using the distribution of time of flight (DTOF) curves from TRS of both wavelengths. The theoretical details can be found in Torricelli et al. and Contini et al.18,21. The calculation of BFI in real-time is achieved by the fitting algorithm using the autocorrelation curves from DCS. The theoretical details can be found in Durduran and Yodh16.
Results
The ongoing clinical studies have utilized the device for over 300 h by several trained users to perform measurements in ICU patients and healthy controls, derive clinically relevant results, and characterize the in vivo performance of the system in a real setting. Here, we demonstrate some example time traces of the data from a single subject that are visible to the user. The preliminary results of the protocol are measured and displayed in real-time, such as HbO, HbR, HbT, StO2, SpO2, and BFI. Different derived parameters, such as MRO2, DeO2, ReO2, and AUC, are described.
Figure 7 shows the device monitor during step 3.3, which shows the data quality, where laser powers are adjusted, photon counts, and crosstalk between modalities are tested automatically. The device monitor shows two intensity autocorrelation (g2) curves as the device has two DCS detector fibers coupled to single photon counting modules and the DTOF for both wavelengths of the TRS device. The wavelength of the laser utilized for DCS is 785 nm, while the OEM TRS module shines lasers at 685 nm and 830 nm. The autocorrelation curves in the top graph appear to be noisy at lower lag times. This can be partially due to low light intensity in this specific example. Increased light intensity and independent/parallel detection fibers have been recommended to increase the signal-to-noise ratio for DCS42,43. Therefore, an average of two DCS channels is being planned to reduce the effect of noise and subsequently compute a better BFI.
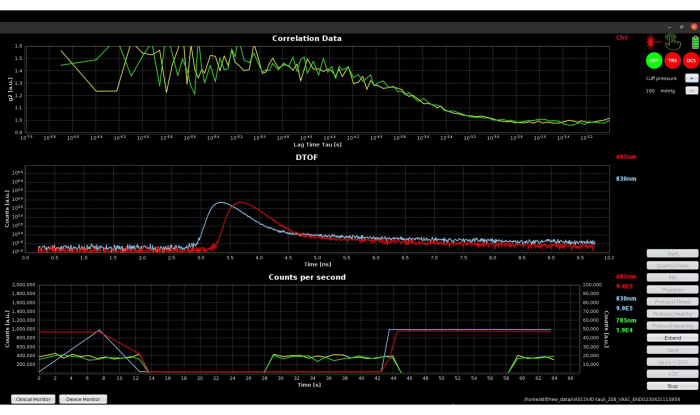
Figure 7: Screenshot of device monitor mode of software during the data quality checking phase. The top plot shows the autocorrelation curves from two channels of DCS. The middle plot shows the DTOF for TRS wavelengths. The bottom plot shows the photon counts for both DCS and TRS. Please click here to view a larger version of this figure.
The initial baseline period with clinical monitor, shown in Figure 8, has green icons for DCS and TRS, indicating the success of quality tests. The displayed signals look very stable, and hence, the Extend feature, described in step 3.5, was not required in this case. If the initial baseline appears as depicted in Figure 9, it is necessary to utilize the Extend feature. This feature extends baseline acquisition to obtain 3 min of stable data, which can be used to calculate the accurate baseline values for all parameters.
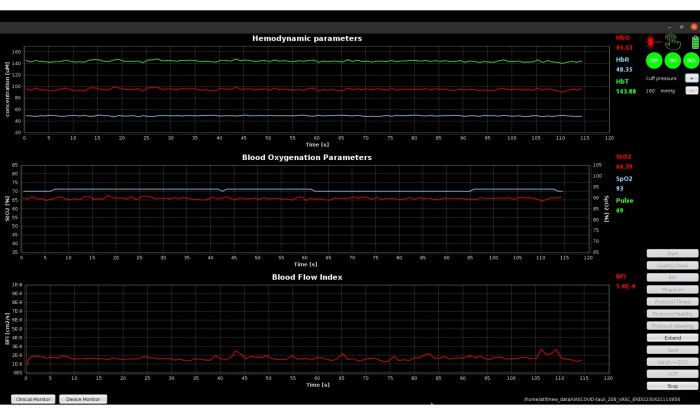
Figure 8: Screenshot of clinical monitor mode of software during the initial baseline phase showing stable baseline signals. The top plot shows the absolute value of hemodynamic parameters measured by TRS, middle plot shows the oxygen saturation signals and pulse value measured by TRS and pulse oximeter, and the bottom plot shows the BFI measured using DCS. Please click here to view a larger version of this figure.
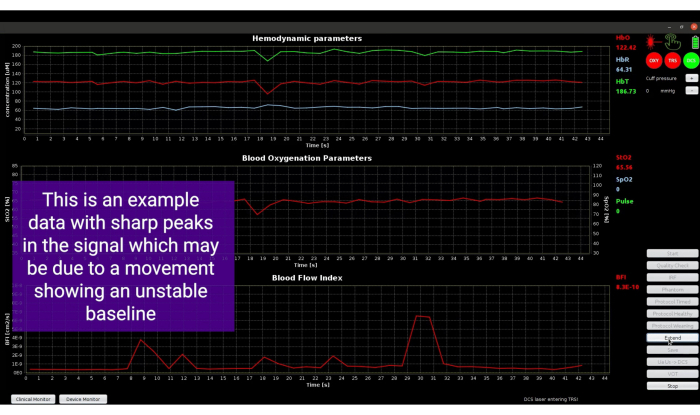
Figure 9: Screenshot showing spikes in the signals due to movement of the probe. Please click here to view a larger version of this figure.
The start and end of the cuff occlusion part are marked with yellow vertical lines, as shown in Figure 10. The pulse shape and the SpO2 values have no clinical/physiological meaning in this phase since the finger from the same arm being occluded is used for pulse oximetry. This is indicated by the red OXY icon expressing unreliable data from the pulse oximeter. To circumvent this situation, we could attach the pulse oximeter to the patient's unaffected hand, which is not subjected to the tourniquet and remains unobstructed. However, we want to obtain the perfusion index of the probed arm using the pulse oximeter for the initial baseline and final recovery phases to analyze the effects of VOT. Therefore, we have opted to use the pulse oximeter on the same arm as the tourniquet.
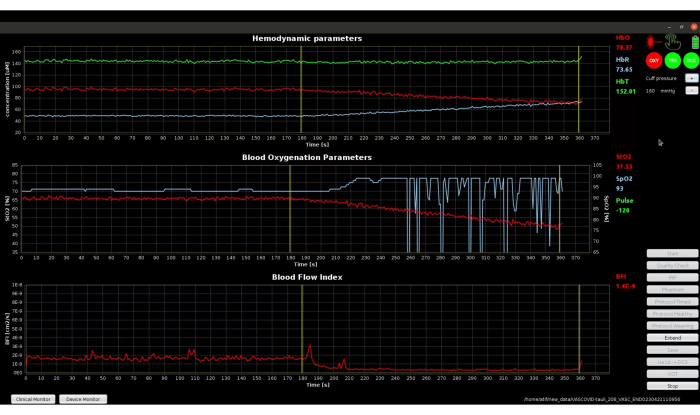
Figure 10: Software screenshot showing yellow vertical lines marking the starting and ending instants of VOT. The SpO2 and pulse values are insignificant as blood flow is restricted. Please click here to view a larger version of this figure.
Figure 11 shows the complete protocol timeline as indicated in step 3.6, including the final recovery phase, illustrating the hyperemic response and the return of clinical parameters to the initial baseline values. The top graph of Figure 11 shows the absolute hemodynamics parameters. The start of VOT marks a declining trend in HbO and a rising trend in HbR as both the inflow and outflow of blood are blocked by the cuff occlusion. The trend reverses at the time of VOT completion, goes beyond the initial baseline values, and returns to the baseline values in the recovery phase. The middle and bottom graphs show that the BFI signal is slightly noisier than StO2. This is inherently due to the fact that the DCS tends to have a higher contrast-to-noise ratio, which is evident from the large hyperemic response in BFI42,44. Using the rich dataset from this novel device, the oscillations in BFI have been used as potential biomarkers to diagnose septic patients45.
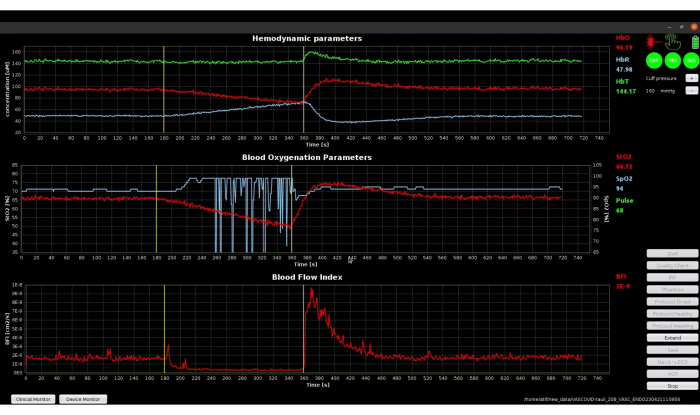
Figure 11: Screenshot of the clinical monitor showing the signals throughout the protocol timeline. Please click here to view a larger version of this figure.
With this protocol, the oxygen being utilized by the muscle can be monitored in isolation during the VOT. The slope of DeO2 during the ischemic challenge indicates how the tissue consumes oxygen. The early decrease of StO2 during the VOT reflects the oxygen consumption rate for the tissue. The hyperemic peak and subsequent decaying trends in the StO2 and BFI are directly associated with hyperemic and microvascular reactivity. Apart from these obvious results, we can use several potential biomarkers to classify a specific group of ICU patients. The existing biomarkers are rate of deoxygenation, minimum value of StO2 during the VOT, rate of reoxygenation, hyperemic peak value, and area under the curve of both StO2 and BFI. These biomarkers can be utilized to identify patient populations and the severity of their diseases. The results obtained from an example data set from a patient are shown in Figure 12. The term "DATA QC" denotes the initial quality check, which does not pertain to patient data. Therefore, it is not displayed in the representation. The average values of StO2, BFI, and MRO2 for the baseline period are computed for comparison with phases of VOT and post-VOT recovery. The results obtained during this protocol can be different from the data from this example. The baseline values of all parameters can be higher or lower, and the rate of DeO2 can be faster or slower. The hyperemic response can have a higher or lower rate of ReO2 and peak values, or there may be an absence of peak. The recovery phase can show a faster or slower normalization of values. These variations are representative of the patient's condition suffering from a specific or set of diseases.
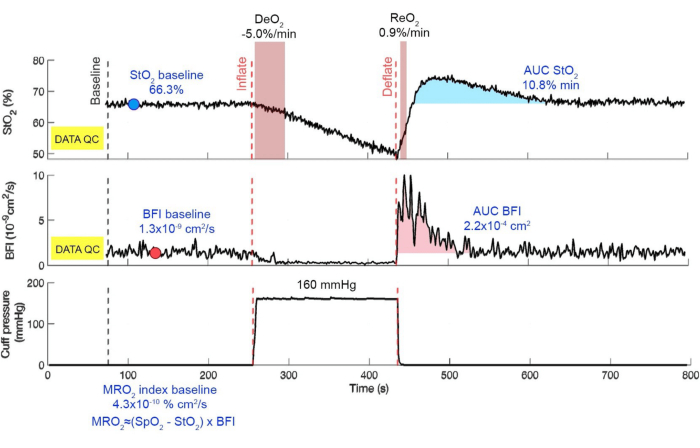
Figure 12: Summary of results compiled offline. The black dashed line marks the start of three minutes of the baseline period, while the red dashed line marks the inflating and deflating events. The top graph shows the StO2 signal with marked regions for calculating DeO2 and ReO2. The middle plot shows the BFI while the bottom plot shows the tourniquet pressure. The baseline values and the AUC are shown in blue in their respective phases. Please click here to view a larger version of this figure.
Discussion
We have demonstrated a fully automated, robust, non-invasive device for the continuous measurement and monitoring of skeletal muscle using hybrid diffuse optics for evaluating microvascular oxygenation, blood perfusion, and reactive hyperemia. Using this protocol with VASCOVID device, we can simultaneously measure absolute hemodynamic parameters of HbO, HbR, and HbT; oxygen saturation from StO2 and SpO2; DeO2 and ReO2; and BFI. The displayed real-time StO2 and BFI are obtained from the raw data of the previous second from the TRS and DCS modules, respectively. The fitting procedure is not time-consuming since modern processors use standard models of a semi-infinite, homogeneous medium. The parameters acquired do not paint the complete picture of endothelial function. However, reactive hyperemia measured has demonstrated prognostic value in several acute conditions where the endothelial impairment plays a major role, such as septic shock or COVID-19.6,28 The protocol also incorporates an automated quality check that records the device parameters, which are useful for a research protocol in case an unexplained anomaly is detected later in any patient's data.
The quantification of the overlaying adipose layer and the arm circumference is important while measuring the brachioradialis muscle in this protocol since the photons pass primarily through the overlaying tissues when injected and when detected. It is well known in diffuse optics that there is an associated partial volume effect. Therefore, the superficial information should be recorded and utilized when analyzing the data in order to account for the effect of variations in adipose tissue46,47. This is further amplified in these patient populations of interest since it is common in ICU patients to develop edema where the limbs are swollen as water is trapped due to immobilization and other reasons48. In such patients, the variation in circumference during ICU stay can provide information about the severity of edema. The pathway of the light source reaching the detectors has to pass through all the superficial layers.
The cuff should be comfortably wrapped around the arm, ensuring a close fit. However, it is important to avoid excessive tightness that could exert excessive pressure on the arm solely through the act of wrapping the cuff49. The goal is to achieve a secure and comfortable fit without causing unnecessary compression, which can alter baseline hemodynamic parameters. If it compresses the arm, the data quality will be compromised for the whole protocol, and the exerted pressure will be effectively added to the target pressure of VOT. In case the cuff is loosely wrapped to the arm, more air will be required to reach the target pressure and hence more time will be taken. This can give time to tissue for adjusting physiology as oxygen supply is being reduced slowly, which should be avoided50.
It is important to attach the smart probe in a manner that maintains proper contact without exerting excessive pressure on the tissue. This allows for reliable measurements while avoiding the risk of local ischemia. Local ischemia occurs when blood flow to the area is restricted leading to compromised circulation and potentially corrupting the measurements51.
The capacitive touch sensor on the probe is used by the laser safety system to ensure that the laser shines only when the probe is attached to the tissue. If the patient has high hair density on the arm, the sensitivity of the touch sensor can be compromised. The application of a thin transparent double tape on the sensor side of the probe can effectively mitigate the touch sensor issue. When the probe is attached to the hairy arm together with this tape, it provides a reliable and stable touch signal. Predefined cuts of this tape are available for the smart probe with separation between light sources and detectors. The separation is essential to prevent the formation of a direct light channel between source and detector windows, which can affect the quality of the measurements. The use of transparent double tape serves as a practical solution to enhance the reliability of touch sensing in these circumstances. If the touch sensing is lost during the protocol, it turns off the lasers and the measurement is lost. The probe also has a load sensor which could, in the future, be utilized as a back-up safety measure.
If the patient moves their arm or a small clinical intervention disrupts the stability of acquired signals during the baseline phase, resulting in sharp peaks, it is advisable to utilize the extend feature. This feature allows for the acquisition of a stable baseline for three minutes, ensuring consistent and reliable signal measurement.
It is important to consider that the patient's blood pressure may undergo significant changes after initiating the protocol, which can impact the ability to reach the target pressure of 50 mmHg higher than the systolic blood pressure for the VOT. These fluctuations in blood pressure may be influenced by various factors, such as the patient's physiological response, medication effects, or other clinical conditions52. Therefore, the target pressure should be adjusted by pressing "+" or "-" buttons if necessary to ensure consistent administration of the VOT.
The typical execution of VOT has limitations due to operator variability, which is addressed in this protocol by having an automatic VOT. We are using the strategy to set the occlusion pressure of 50 mmHg above the systolic blood pressure level. This method stops the blood flow and has been reported in previous studies for performing the VOT53,54. The individualized target pressure for VOT in this protocol helps in avoiding vasoconstriction that can happen by fixing a general target pressure for VOT. Pain caused by an unnecessarily high pressure can affect the measurement causing vasoconstriction, e.g. in a patient with systolic pressure of 120 mmHg and target pressure of 200 mmHg or 250 mmHg29. We note that patients admitted to ICUs face an increased risk of thrombosis, primarily due to factors such as prolonged immobility, and sedation55. This implies that to avoid risks, this protocol cannot be used in patients suffering from thrombosis or thrombophlebitis.
The application of this protocol can be useful in the ICU population where impaired reactive hyperemia is a common feature and can contribute to microvascular abnormalities3,56. The parameters acquired in this protocol, without operator interventions during the measurement, have been previously used in the literature singularly or in a small combination for sepsis, cancer, stroke etc. to distinguish pathological conditions1,11,15,31. Therefore, we believe that the combination of these relevant parameters are beneficial for several clinical applications. The data recorded by this protocol can help to select appropriate therapeutic strategies to improve vascular health57. The valuable insights on tissue oxygenation and blood flow dynamics during occlusion and reperfusion allow us to assess the adequacy of blood supply to vital organs. It can help in identifying tissue hypoxia and guiding interventions to optimize organ perfusion58. By using real-time information on microvascular oxygenation and reactive hyperemia, it assists as an additional tool in guiding hemodynamic management, fluid resuscitation, and vasopressor therapy59,60. This ensures that interventions are tailored to individual patient needs, optimizing tissue oxygenation and perfusion61,62. Furthermore, in mechanically ventilated patients, evolutive changes in microvascular oxygenation and blood flow within a spontaneous breathing trial can be of utmost importance when evaluating the cardiovascular tolerance to meet and overcome the increased metabolic burden derived from the work of breathing without assistance2. On that behalf, a daily critical and challenging decision for the ICU patients on mechanical ventilation is the weaning process, which ends when the patient is considered able to breathe by himself, and the endotracheal tube is removed. The longitudinal application of this protocol can be used to evaluate the effectiveness of interventions, track disease progression, and guide treatment strategies.
Disclosures
The role in the project of all the companies and their employees involved has been defined by the project objectives, tasks, and work packages and has been reviewed by the European Commission. MB, ML, DC, Alberto Tosi, and Alessandro Toricelli are co-founders of PIONIRS s.r.l., spin off company from Politecnico di Milano (Italy). ICFO has equity ownership in the spin-off company HemoPhotonics s.l.. Potential financial conflicts of interest and objectivity of research have been monitored by ICFO's Knowledge & Technology Transfer Department. UMW is the CEO, has equity ownership in HemoPhotonics s.l., and is an employee along with SP in the company.
Acknowledgements
This research was funded by Fundació CELLEX Barcelona, Fundació Mir-Puig, Ajuntament de Barcelona, Agencia Estatal de Investigación (PHOTOMETABO, PID2019-106481RB-C31/10.13039/501100011033), the "Severo Ochoa" Programme for Centres of Excellence in R&D (CEX2019-000910-S), , Generalitat de Catalunya (CERCA, AGAUR-2017-SGR-1380, RIS3CAT-001-P-001682 CECH), FEDER EC, Fundacion Joan Ribas Araquistain, l'FCRI (Convocatòria Joan Oró 2023), European Commission Horizon 2020 (Grants nos. 101016087 (VASCOVID), 101017113(TinyBrains), 871124 (LASERLAB-EUROPE V), 101062306 (Marie Skłodowska-Curie)), the Fundació La Marató de TV3 (2017,2020), and the LUX4MED/MEDLUX special programs.
Materials
| Name | Company | Catalog Number | Comments |
| Alcohol swabs | No specific | N/A | For cleaning the probes and cuff after measurement |
| Black cloth | No specific | N/A | For blocking ambient light |
| Blood pressure monitor | OMRON | N/A | Hopital ICU equipment or off the shelf product |
| Body fat Calliper | Healifty | 3257040-6108-1618385551 | For measuring the fat layer |
| Examination gloves | No specific | N/A | To be used for interacting with patients |
| Kintex tape | No specific | N/A | For attaching the probe on arm |
| Koban wrap | No specific | N/A | For attaching the probe on arm |
| Measuring tape | YDM Industries | 25-SB-30-150V3-19-1 | For measuring the arm circumference |
| Scissors | No specific | N/A | for cutting tapes |
| VASCOVID precommercial prototype | VASCOVID consortium | N/A | Integrated at ICFO |
References
- Mesquida, J., Masip, J., Gili, G., Artigas, A., Baigorri, F. Thenar oxygen saturation measured by near infrared spectroscopy as a noninvasive predictor of low central venous oxygen saturation in septic patients. Intensive Care Medicine. 35, 1106-1109 (2009).
- Mesquida, J., et al. Thenar oxygen saturation (StO2) alterations during a spontaneous breathing trial predict extubation failure. Annals of Intensive Care. 10 (1), 1-7 (2020).
- Mikacenic, C., et al. Biomarkers of endothelial activation are associated with poor outcome in critical illness. PloS One. 10 (10), e0141251 (2015).
- Varga, Z., et al. Endothelial cell infection and endotheliitis in COVID-19. The Lancet. 395 (10234), 1417-1418 (2020).
- Castro, P., et al. Is the endothelium the missing link in the pathophysiology and treatment of COVID-19 complications. Cardiovascular Drugs and Therapy. 36 (3), 547-560 (2022).
- Mesquida, J., et al. Peripheral microcirculatory alterations are associated with the severity of acute respiratory distress syndrome in COVID-19 patients admitted to intermediate respiratory and intensive care units. Critical Care. 25, 1-10 (2021).
- Fernández, S., et al. Distinctive biomarker features in the endotheliopathy of COVID-19 and septic syndromes. Shock (Augusta, Ga). 57 (1), 95 (2022).
- Sakr, Y., Dubois, M. J., De Backer, D., Creteur, J., Vincent, J. L. Persistent microcirculatory alterations are associated with organ failure and death in patients with septic shock). Critical Care Medicine. 32 (9), 1825-1831 (2004).
- Trzeciak, S., et al. Early microcirculatory perfusion derangements in patients with severe sepsis and septic shock: relationship to hemodynamics, oxygen transport, and survival. Annals of Emergency Medicine. 49 (1), 88-98 (2007).
- Tachon, G., et al. Microcirculatory alterations in traumatic hemorrhagic shock. Critical Care Medicine. 42 (6), 1433-1441 (2014).
- Duranteau, J., et al. The future of intensive care: the study of the microcirculation will help to guide our therapies. Critical Care. 27 (1), 1-13 (2023).
- Mason McClatchey, P., et al. Impaired tissue oxygenation in metabolic syndrome requires increased microvascular perfusion heterogeneity. Journal of Cardiovascular Translational Research. 10 (1), 69-81 (2017).
- Gurley, K., Shang, Y., Yu, G. Noninvasive optical quantification of absolute blood flow, blood oxygenation, and oxygen consumption rate in exercising skeletal muscle. Journal of Biomedical Optics. 17 (7), 075010 (2012).
- Lin, P. Y., et al. Non-invasive optical measurement of cerebral metabolism and hemodynamics in infants. Journal of Visualized Experiments. (73), e4379 (2013).
- Cortese, L., et al. The LUCA device: a multi-modal platform combining diffuse optics and ultrasound imaging for thyroid cancer screening. Biomedical Optics Express. 6 (6), 3392-3409 (2021).
- Durduran, T., Yodh, A. G. Diffuse correlation spectroscopy for non-invasive, micro-vascular cerebral blood flow measurement. Neuroimage. 85, 51-63 (2014).
- Hong, K. S., Yaqub, M. A. Application of functional near-infrared spectroscopy in the healthcare industry: A review. Journal of Innovative Optical Health Sciences. 12 (06), 1930012 (2019).
- Torricelli, A., et al. Time domain functional NIRS imaging for human brain mapping. Neuroimage. 85, 28-50 (2014).
- Tremblay, J. C., King, T. J. Near-infrared spectroscopy: can it measure endothelial function. Experimental Physiology. 101 (11), 1443-1444 (2016).
- Cortese, L., et al. Performance assessment of a commercial continuous-wave near-infrared spectroscopy tissue oximeter for suitability for use in an international, multi-center clinical trial. Sensors. 21 (21), 6957 (2021).
- Contini, D., et al. Multi-channel time-resolved system for functional near infrared spectroscopy. Optics Express. 14 (12), 5418-5432 (2006).
- Lacerenza, M., et al. Wearable and wireless time-domain near-infrared spectroscopy system for brain and muscle hemodynamic monitoring. Biomedical Optics Express. 11 (10), 5934-5949 (2020).
- Lacerenza, M., et al. Performance and reproducibility assessment across multiple time-domain near-infrared spectroscopy device replicas. Design and Quality for Biomedical Technologies XV - SPIE. 11951, 43-48 (2022).
- Durduran, T., Choe, R., Baker, W. B., Yodh, A. G. Diffuse optics for tissue monitoring and tomography. Reports on Progress in Physics. 73 (7), 076701 (2010).
- Boas, D. A., Campbell, L. E., Yodh, A. G. Scattering and imaging with diffusing temporal field correlations. Physical Review Letters. 75 (9), 1855 (1995).
- Giovannella, M., et al. BabyLux device: a diffuse optical system integrating diffuse correlation spectroscopy and time-resolved near-infrared spectroscopy for the neuromonitoring of the premature newborn brain. Neurophotonics. 6 (2), 025007-025007 (2019).
- Amendola, C., et al. A compact multi-distance DCS and time domain NIRS hybrid system for hemodynamic and metabolic measurements. Sensors. 21 (3), 870 (2021).
- Mesquida, J., Gruartmoner, G., Espinal, C. Skeletal muscle oxygen saturation (StO2) measured by near-infrared spectroscopy in the critically ill patients. BioMed Research International. (2013), (2013).
- Gerovasili, V., Dimopoulos, S., Tzanis, G., Anastasiou-Nana, M., Nanas, S. Utilizing the vascular occlusion technique with NIRS technology. International Journal of Industrial Ergonomics. 40 (2), 218-222 (2010).
- Siafaka, A., et al. Acute effects of smoking on skeletal muscle microcirculation monitored by near-infrared spectroscopy. Chest. 131 (5), 1479-1485 (2007).
- Donati, A., et al. Near-infrared spectroscopy for assessing tissue oxygenation and microvascular reactivity in critically ill patients: a prospective observational study. Critical Care. 20, 1-10 (2016).
- Iannetta, D., et al. Reliability of microvascular responsiveness measures derived from near-infrared spectroscopy across a variety of ischemic periods in young and older individuals. Microvascular Research. 122, 117-124 (2019).
- Niezen, C. K., Massari, D., Vos, J. J., Scheeren, T. W. L. The use of a vascular occlusion test combined with near-infrared spectroscopy in perioperative care: a systematic review. Journal of Clinical Monitoring and Computing. 36 (4), 933-946 (2022).
- Donati, A., et al. Recombinant activated protein C treatment improves tissue perfusion and oxygenation in septic patients measured by near-infrared spectroscopy. Critical Care. 5 (5), 1-7 (2009).
- Neto, A. S., et al. Association between static and dynamic thenar near-infrared spectroscopy and mortality in patients with sepsis: a systematic review and meta-analysis. Journal of Trauma and Acute Care Surgery. 76 (1), 226-233 (2014).
- Shapiro, N. I., et al. The association of near-infrared spectroscopy-derived tissue oxygenation measurements with sepsis syndromes, organ dysfunction and mortality in emergency department patients with sepsis. Critical Care. 15 (5), 1-10 (2011).
- Orbegozo, D., et al. Peripheral muscle near-infrared spectroscopy variables are altered early in septic shock. Shock. 50 (1), 87-95 (2018).
- Lu, S., et al. Comparison of COVID-19 induced respiratory failure and typical ARDS: similarities and differences. Frontiers in Medicine. 9, 829771 (2022).
- Parežnik, R., Knezevic, R., Voga, G., Podbregar, M. Changes in muscle tissue oxygenation during stagnant ischemia in septic patients. Intensive Care Medicine. 32, 87-92 (2006).
- Nanas, S., et al. Inotropic agents improve the peripheral microcirculation of patients with end-stage chronic heart failure. Journal of Cardiac Failure. 14 (5), 400-406 (2008).
- International electrical equipment - IEC. Medical electrical equipment - Part 2-22: Particular requirements for basic safety and essential performance of surgical, cosmetic, therapeutic and diagnostic laser equipment. International electrical equipment - IEC. , (2019).
- Cortese, L., et al. Recipes for diffuse correlation spectroscopy instrument design using commonly utilized hardware based on targets for signal-to-noise ratio and precision. Biomedical Optics Express. 12 (6), 3265-3281 (2021).
- Zhou, C., et al. Diffuse optical correlation tomography of cerebral blood flow during cortical spreading depression in rat brain. Optics Express. 14 (3), 1125-1144 (2006).
- Selb, J., et al. Sensitivity of near-infrared spectroscopy and diffuse correlation spectroscopy to brain hemodynamics: simulations and experimental findings during hypercapnia. Neurophotonics. 1 (1), 015005-015005 (2014).
- Amendola, C., et al. Assessment of power spectral density of microvascular hemodynamics in skeletal muscles at very low and low-frequency via near-infrared diffuse optical spectroscopies. Biomedical Optics Express. 14 (11), 5994-6015 (2023).
- Craig, J. C., Broxterman, R. M., Wilcox, S. L., Chen, C., Barstow, T. J. Effect of adipose tissue thickness, muscle site, and sex on near-infrared spectroscopy derived total-[hemoglobin+ myoglobin]. Journal of Applied Physiology. 123 (6), 1571-1578 (2017).
- Nasseri, N., Kleiser, S., Ostojic, D., Karen, T., Wolf, M. Quantifying the effect of adipose tissue in muscle oximetry by near infrared spectroscopy. Biomedical Optics Express. 7 (11), 4605-4619 (2016).
- Ahmadinejad, M., Razban, F., Jahani, Y., Heravi, F. Limb edema in critically ill patients: Comparing intermittent compression and elevation. International Wound Journal. 19 (5), 1085-1091 (2022).
- Van Vo, T., Hammer, P. E., Hoimes, M. L., Nadgir, S., Fantini, S. Mathematical model for the hemodynamic response to venous occlusion measured with near-infrared spectroscopy in the human forearm. IEEE Transactions on Biomedical Engineering. 54 (4), 573-584 (2007).
- Junejo, R. T., Ray, C. J., Marshall, J. M. Cuff inflation time significantly affects blood flow recorded with venous occlusion plethysmography. European Journal of Applied Physiology. 119, 665-674 (2019).
- Baker, W. B., et al. Pressure modulation algorithm to separate cerebral hemodynamic signals from extracerebral artifacts. Neurophotonics. 3 (3), 035004-035004 (2015).
- Martirosov, A. L., et al. Improving transitions of care for critically ill adult patients on pulmonary arterial hypertension medications. American Journal of Health-System Pharmacy. 77 (12), 958-965 (2020).
- Bezemer, R., Lima, A., Klijn, E., Bakker, J., Ince, C. Assessment of tissue oxygen saturation during a vascular occlusion test using near-infrared spectroscopy: Role of the probe spacing and measurement site studied in healthy volunteers. Critical Care. (13), 1-2 (2009).
- Futier, E., et al. Use of near-infrared spectroscopy during a vascular occlusion test to assess the microcirculatory response during fluid challenge. Critical Care. (15), 1-10 (2011).
- Attia, J. R., et al. Deep vein thrombosis and its prevention in critically ill adults. Archives of Internal Medicine. 161 (10), 1268-1279 (2001).
- Reinhart, K., Bayer, O., Brunkhorst, F., Meisner, M. Markers of endothelial damage in organ dysfunction and sepsis. Critical Care Medicine. 30 (5), S302-S312 (2002).
- Georger, J. F., et al. Restoring arterial pressure with norepinephrine improves muscle tissue oxygenation assessed by near-infrared spectroscopy in severely hypotensive septic patients. Intensive Care Medicine. 36, 1882-1889 (2010).
- Lipcsey, M., Woinarski, N. C., Bellomo, R. Near infrared spectroscopy (NIRS) of the thenar eminence in anesthesia and intensive care. Annals of Intensive Care. 2 (1), 1-9 (2012).
- Kazune, S., Caica, A., Luksevics, E., Volceka, K., Grabovskis, A. Impact of increased mean arterial pressure on skin microcirculatory oxygenation in vasopressor-requiring septic patients: an interventional study. Annals of Intensive Care. 9 (1), 1-10 (2019).
- Lima, A., van Bommel, J., Jansen, T. C., Ince, C., Bakker, J. Low tissue oxygen saturation at the end of early goal-directed therapy is associated with worse outcome in critically ill patients. Critical Care. 13 (5), 1-7 (2009).
- Rogers, C. A., et al. Randomized trial of near-infrared spectroscopy for personalized optimization of cerebral tissue oxygenation during cardiac surgery. BJA: British Journal of Anaesthesia. 119 (3), 384-393 (2017).
- Jozwiak, M., Chambaz, M., Sentenac, P., Monnet, X., Teboul, J. L. Assessment of tissue oxygenation to personalize mean arterial pressure target in patients with septic shock. Microvascular Research. 132, 104068 (2020).
Reprints and Permissions
Request permission to reuse the text or figures of this JoVE article
Request PermissionExplore More Articles
This article has been published
Video Coming Soon
Copyright © 2025 MyJoVE Corporation. All rights reserved