
Piping Networks and Pressure Losses
Overview
Source: Alexander S Rattner, Department of Mechanical and Nuclear Engineering, The Pennsylvania State University, University Park, PA
This experiment introduces the measurement and modeling of pressure losses in piping networks and internal flow systems. In such systems, frictional flow resistance from channel walls, fittings, and obstructions causes mechanical energy in the form of fluid pressure to be converted to heat. Engineering analyses are needed to size flow hardware to ensure acceptable frictional pressure losses and select pumps that meet pressure drop requirements.
In this experiment, a piping network is constructed with common flow features: straight lengths of tubing, helical tube coils, and elbow fittings (sharp 90° bends). Pressure loss measurements are collected across each set of components using manometers - simple devices that measure fluid pressure by the liquid level in an open vertical column. Resulting pressure loss curves are compared with predictions from internal flow models.
Procedure
1. Fabrication of piping system (see schematic and photograph, Fig. 2)
- Affix (tape or glue) a small plastic water reservoir to the work surface. If it is a covered container, drill holes in the lid for the inlet and outlet water lines and pump power cable.
- Mount the small submersible pump in the reservoir.
- Mount the rotameter (water flow meter) vertically in the work area. It may help to strap the rotameter to a small vertical beam or L-bracket to keep it upright. Connect a flow tube from
Results
Measured friction factor and equivalent length data are presented in Fig. 3a-c. For the straight tube section, a clear PVC tube with D = 6.4 mm and L = 284 mm is used. Measured flow rates (0.75 - 2.10 l min-1) correspond to turbulent conditions (Re = 2600 - 7300). Friction factors match predictions from the analytic model to within experimental uncertainty. Relatively high f uncertainty is found at low flow rates due to the limited accura
Application and Summary
Summary
This experiment demonstrates methods for measuring pressure-drop friction factors and equivalent lengths in internal flow networks. Modeling methods are presented for common flow configurations, including straight tubes, coiled tubes, and pipe fittings. These experimental and analysis techniques are key engineering tools for the design of fluid flow systems.
Applications
Internal flow networks ari
References
- Perry, D.W. Green, J.O. Maloney, Perry's Chemical Engineers' Handbook, 6th Editio, McGraw-Hill, New York, NY, 1984.
 ,
,  is uncertainty in manometer level), and eU is the uncertainty in average channel velocity (from rotameter data sheet, with typical uncertainty of 3 - 5% of range). For water at room temperature (22°C), ρ = 998 kg m-3 and µ = 0.001 kg m-1 s-1.
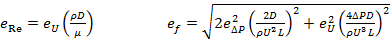 (6)
(6) . Evaluate the equivalent length and uncertainty for each elbow. Here, Ne is the number of pipe elbows.
 (7)
(7)Skip to...
Videos from this collection:

Now Playing
Piping Networks and Pressure Losses
Mechanical Engineering
58.2K Views

Buoyancy and Drag on Immersed Bodies
Mechanical Engineering
30.0K Views

Stability of Floating Vessels
Mechanical Engineering
22.6K Views

Propulsion and Thrust
Mechanical Engineering
21.7K Views

Quenching and Boiling
Mechanical Engineering
7.7K Views

Hydraulic Jumps
Mechanical Engineering
41.0K Views

Heat Exchanger Analysis
Mechanical Engineering
28.0K Views

Introduction to Refrigeration
Mechanical Engineering
24.7K Views

Hot Wire Anemometry
Mechanical Engineering
15.6K Views

Measuring Turbulent Flows
Mechanical Engineering
13.5K Views

Visualization of Flow Past a Bluff Body
Mechanical Engineering
11.9K Views

Jet Impinging on an Inclined Plate
Mechanical Engineering
10.8K Views

Conservation of Energy Approach to System Analysis
Mechanical Engineering
7.4K Views

Mass Conservation and Flow Rate Measurements
Mechanical Engineering
22.7K Views

Determination of Impingement Forces on a Flat Plate with the Control Volume Method
Mechanical Engineering
26.0K Views
Copyright © 2025 MyJoVE Corporation. All rights reserved