
Buoyancy and Drag on Immersed Bodies
Overview
Source: Alexander S Rattner and Sanjay Adhikari; Department of Mechanical and Nuclear Engineering, The Pennsylvania State University, University Park, PA
Objects, vehicles, and organisms immersed in fluid mediums experience forces from the surrounding fluid in the form of buoyancy- a vertical upward force due to fluid weight, drag- a resistive force opposite the direction of motion, and lift- a force perpendicular to the direction of motion. Prediction and characterization of these forces is critical to engineering vehicles and understanding the motion of swimming and flying organisms.
In this experiment, the balance of buoyancy, weight, and drag forces on submerged bodies will be investigated by tracking the rise velocity of air bubbles and oil droplets in a glycerin medium. The resulting drag coefficients at terminal rise velocities will be compared with theoretical values.
Procedure
1. Fabrication of gas injection test section (see schematic and photograph, Fig. 2)
- Drill a hole in the bottom of a tall, flat walled plastic container. Install a through-wall bulkhead fitting through this hole. Install a reducing fitting to a ~3.2 mm tube compression connection in the bulkhead fitting outlet. This will be the bubble/droplet injection port.
- Insert a short length (~1 cm) of 3.2 mm diameter soft rubber cord in the compression connection, and tighten the fitting nut. Using a sewing pin
Results
A series of rising air bubbles and oil droplets of varying diameters are presented in Fig. 3. The small bubbles and droplets rise at lower velocities due to relatively stronger drag forces. At these low velocity and length scales, strong surface tension forces result in nearly spherical bubbles and droplets. The largest bubbles approach Re ~ 2, resulting in somewhat flattened tails in the wake region. The largest oil droplets only approach Re ~ 0.2 due to thei
Application and Summary
This experiment demonstrated the measurement of drag coefficient for rising bubbles and droplets in a fluid medium. Drag coefficients were determined by accounting for weight, buoyancy, and drag forces. Results were compared with a theoretical model for bubble/droplet CD at low Reynolds numbers.These results could be directly applicable to the design of industrial heat and mass exchangers, such as steam generators in power plants. In steam generators, vapor bubbles must be removed from the heated area
References
- J.S. Hadamard, Motion of liquid drops (viscous), Comp. Rend. Acad. Sci. Paris. 154 (1911) 1735-1755.
- W. Rybczynski, On the translatory motion of a fluid sphere in a viscous medium, Bull. Acad. Sci., Cracow, Ser. A. (1911) 40.
Tags
 , where Lm is the physical length of the object in meters and Lpx is the object length in pixels in the image.
 ) and drag coefficients (Eqn. 2). Plot these values and compare with theoretical results from Eqn. 3. Fluid properties at room temperature (22°C) are:
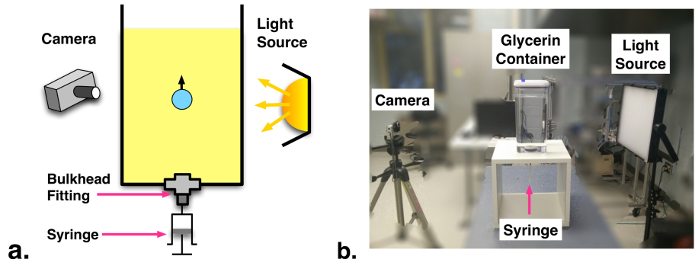
Skip to...
Videos from this collection:

Now Playing
Buoyancy and Drag on Immersed Bodies
Mechanical Engineering
30.0K Views

Stability of Floating Vessels
Mechanical Engineering
22.6K Views

Propulsion and Thrust
Mechanical Engineering
21.7K Views

Piping Networks and Pressure Losses
Mechanical Engineering
58.2K Views

Quenching and Boiling
Mechanical Engineering
7.7K Views

Hydraulic Jumps
Mechanical Engineering
41.0K Views

Heat Exchanger Analysis
Mechanical Engineering
28.0K Views

Introduction to Refrigeration
Mechanical Engineering
24.7K Views

Hot Wire Anemometry
Mechanical Engineering
15.6K Views

Measuring Turbulent Flows
Mechanical Engineering
13.5K Views

Visualization of Flow Past a Bluff Body
Mechanical Engineering
11.9K Views

Jet Impinging on an Inclined Plate
Mechanical Engineering
10.7K Views

Conservation of Energy Approach to System Analysis
Mechanical Engineering
7.4K Views

Mass Conservation and Flow Rate Measurements
Mechanical Engineering
22.7K Views

Determination of Impingement Forces on a Flat Plate with the Control Volume Method
Mechanical Engineering
26.0K Views
Copyright © 2025 MyJoVE Corporation. All rights reserved