
Propulsion and Thrust
Overview
Source: Alexander S Rattner; Department of Mechanical and Nuclear Engineering, The Pennsylvania State University, University Park, PA
Aircraft, rockets, and ships produce propulsion by accelerating surrounding fluid or high temperature combustion products to high velocity. Because of the principle of conservation of momentum, the increased fluid velocity results in an effective thrust force on the vehicle. The thrust capabilities of propulsion systems are often measured with static thrust tests. In these tests, propulsion systems are mounted and operated on fixed, instrumented platforms, and the holding force on the mounts is measured as the thrust
In this experiment, a small-scale static thrust measurement facility will be constructed and modeled. The thrust curves for two model aircraft motors and propeller systems and a computer cooling fan will be measured. Thrust efficiencies will also be evaluated (thrust force / electrical power input). Measured thrust values will be compared with theoretical predictions based on measured air velocities.
Procedure
1. Fabrication of static thrust test system (see schematics and photograph, Fig. 2)
- Form two cylindrical bushings on a lathe with outer diameter 42.16 mm, length ~10 mm, and bore through the center axis of 9.50 mm.
- Press one flanged ball bearing into the bore on each bushing. Insert the bushings flush into the two parallel ports of the 4-way tee fitting, with the bearings on the outside. The bushings should fit snugly in the tee fitting. (See the pivot assembly schematic in Fig. 2b.
- Cut tw
Results
In Fig. 3a, the thrust vs. power curves are presented for the three propulsion devices evaluated in this experiment. The fan achieves the highest thrust, reaching 0.68 ± 0.02 N at 11.83 ± 0.08 W input power. The smaller propeller produces slightly more thrust per input power than the larger propeller, but reaches its maximum operating voltage at 2.66 ± 0.04 W. Fig. 3b presents the thrust efficiency for the three devices. For the small propeller and fan, the efficiency generally decreases with increasing po
Application and Summary
This experiment introduced the basic operating principles of fluid propulsion devices found in aircraft and watercraft. A static thrust test platform was constructed to measure the propulsion capability of model aircraft propellers and a pc cooling fan. The resulting thrusts and propulsion efficiencies (thrust per input power) were measured and compared. Theoretical thrust values were also estimated based on downstream jet velocities. Measurement and rating of propulsion system performance, as demonstrated here at small
 . The uncertainty can be estimated as
 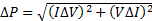 , where ΔI and ΔV are the current and voltage measurement uncertainties (0.005 A and 0.005 V here).
 . The uncertainty for thrust efficiency would be
 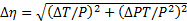 .
. . How do these compare with measured values?
Skip to...
Videos from this collection:

Now Playing
Propulsion and Thrust
Mechanical Engineering
21.7K Views

Buoyancy and Drag on Immersed Bodies
Mechanical Engineering
30.0K Views

Stability of Floating Vessels
Mechanical Engineering
22.6K Views

Piping Networks and Pressure Losses
Mechanical Engineering
58.1K Views

Quenching and Boiling
Mechanical Engineering
7.7K Views

Hydraulic Jumps
Mechanical Engineering
41.0K Views

Heat Exchanger Analysis
Mechanical Engineering
28.0K Views

Introduction to Refrigeration
Mechanical Engineering
24.7K Views

Hot Wire Anemometry
Mechanical Engineering
15.6K Views

Measuring Turbulent Flows
Mechanical Engineering
13.5K Views

Visualization of Flow Past a Bluff Body
Mechanical Engineering
11.9K Views

Jet Impinging on an Inclined Plate
Mechanical Engineering
10.7K Views

Conservation of Energy Approach to System Analysis
Mechanical Engineering
7.4K Views

Mass Conservation and Flow Rate Measurements
Mechanical Engineering
22.6K Views

Determination of Impingement Forces on a Flat Plate with the Control Volume Method
Mechanical Engineering
26.0K Views
Copyright © 2025 MyJoVE Corporation. All rights reserved