
Antibiotic Susceptibility Testing: Epsilometer Tests to Determine MIC Values of Two Antibiotics and Evaluate Antibiotic Synergy
Overview
Source: Anna Bläckberg1, Rolf Lood1
1 Department of Clinical Sciences Lund, Division of Infection Medicine, Biomedical Center, Lund University, 221 00 Lund Sweden
Knowledge of the interactions between antibiotics and bacteria is important in understanding how microbes evolve antibiotic resistance. In 1928, Alexander Fleming discovered penicillin, an antibiotic that exerts its antibacterial function by interfering with cell wall regeneration (1). Other antibiotics with diverse mechanisms of action have subsequently been discovered, including drugs that inhibit DNA replication and protein translation in bacteria; however, no new antibiotics have been developed in recent years. Resistance to current antibiotics has been increasing, resulting in severe infectious diseases that cannot be effectively treated (2). Here, we describe several methods to assess antibiotic resistance in bacterial populations. Each of these methods works, regardless of the mechanism of action of the antibiotics used, because bacterial death is the measured outcome. Antibiotic resistance is not only rapidly disseminated specifically through hospital settings, but also throughout society. In order to investigate such means of resistance, different methods have been developed including the Epsilometer test (E-test) and the broth dilution test (3).
The E-test is a well-established method and is a cost-effective tool that quantifies Minimal Inhibitory Concentration (MIC) data, the lowest concentration of an antimicrobial that inhibits visible growth of a microorganism. Depending on the bacterial strain and antibiotics used, the MIC value can vary between sub μg/mL to >1000 μg/mL (4). The E-test is performed using a plastic strip containing a predefined antibiotic gradient, which is imprinted with the MIC reading scale in μg/mL. This strip is directly transferred on the agar matrix when applied to the inoculated agar plate. After incubation, a symmetrical elliptic inhibition zone is visible along the strip as bacterial growth is prevented. MIC is defined by the area of inhibition, which is the endpoint where the ellipse intersects the strip. Another common method to determine MIC is the microbroth dilution method. Microbroth dilution incorporates different concentrations of the antimicrobial agent added to a broth medium containing inoculated bacteria. After incubation, MIC is defined as the lowest concentration of antibiotic that prevents visible growth (5). It is also a quantitative method and can be applied to several bacteria. Disadvantages of this method include the possibility of errors when preparing the concentrations of the reagents and the large number of reagents required for the experiment. Measuring antibiotic resistance is imperative from both a clinical and research perspective, and these in vitro methods of investigating resistance are discussed and showcased below.
The profile of resistance for a specific bacterium can be applied in order to optimize antibiotic treatment to determine whether a patient would benefit from combination treatment versus single therapy. For the usage of more than one antibiotic at a single time, it is imperative to know their interactions with each other and if they have an additive, synergistic, or antagonistic effect. An additive effect can be seen when the joint effect of the antibiotics equals the potency of the individual antibiotics given at an equal dose. Synergy between antibiotics, on the other hand, is present when the joint effect of the antibiotics is more potent than if the drug would be given alone (6). Applying combinations of antimicrobial treatment is used to avoid the occurrence of antimicrobial resistance thus to enhance the effect of the individual antibiotic treatment (7). Knowledge of antagonism is also as important to prevent unnecessary use of antimicrobial combinations. E-test methodology offers simple and several ways to determine possible synergy and antagonism between different antimicrobial agents. In order to face the proliferation of antibiotic resistant pathogens, knowledge of possible synergistic and antagonistic mechanisms of certain antibiotics is important resulting in clinical efficacy and battling multidrug-resistance.
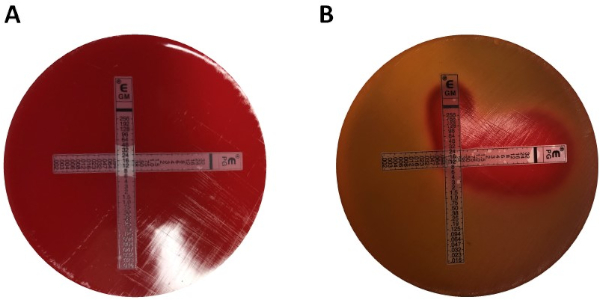
Determination of synergy using E-tests can be divided into two broad approaches: cross and non-cross testing. While both synergy tests rely on the previous knowledge of individual MIC values, the two approaches are slightly different in methodology and conceptual approach. In a non-cross synergy test, the first antibiotic in the pair to be tested is placed on an agar plate inoculated with bacteria. After allowing the antibiotics from the first strip infuse the plate (e.g. after 1 hour), the strip is removed and a new strip containing the second antibiotic is placed on the exact same spot as the first, making sure to place the two individual MIC values on top of each other. The resulting inhibition zone can then be analyzed as described above, and synergy calculated based on the Equation 1.
Equation 1 - Fractional Inhibitory Concentrations (FIC)

Values >0.5 demonstrates synergy.
While rewarding the examiner with easy-to-analyze plates, the method is somewhat laborious and time-consuming due to the change of strips, as well as the need of using two plates per experiment. Instead, a cross test is often employed. Instead of adding the two different E-test strips subsequently on top of each other (after removal of the first), both are placed simultaneously but in the form of a cross ( 90° angle), with the two previously determined MIC values forming the 90° angle. By this approach only one plate is needed per synergy test, as well as less work, making it a preferred choice despite being slightly more difficult to analyze. The new MIC values in the combined antibiotics approach can be visualized as the modified inhibition zones, after which synergy can be determined by Equation 1.
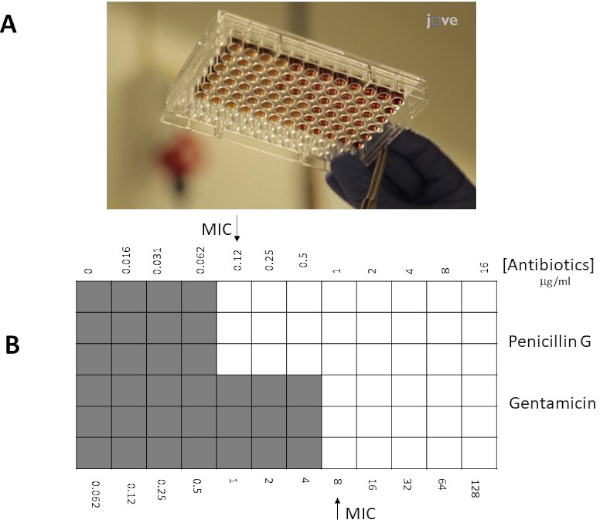
Instead of using an agar plate approach, a microbroth approach can often be preferential due to its higher flexibility (e.g. ability to choose specific concentrations of antibiotics outside the limits of an E-test strip). Further, microbroth tests are suggested to be more sensitive due to their even distribution of antibiotics in a liquid solution, not depending on the dissociation within a solid phase (agar plate). Wells in a 96-well microplate will be inoculated with a set number of bacteria (106 cfu/mL: bacterial concentration can be estimated by OD600 nm measurements, turbidity standards, or by spread plating samples from 10x bacterial serial dilutions), and antibiotics in different dilutions will be added to the wells. Similarly, to the E-test strips MIC is determined as the intersection (well/spot) with the lowest concentration of antibiotics inhibiting visible growth of bacteria.
Experimental Aim
- The project below describes strategies to determine MIC-values of penicillin G and gentamicin of Streptococcus group G by two different methods, E-test and microbroth dilution. For E-test, Mueller-Hinton agar plates inoculated with Streptococcus group G were used in combination with gradient strips of penicillin G and/or gentamicin; while MH-broth with 50% lysed horse blood and 20 mg/mL β-NAD were used with soluble antibiotics together with Streptococcus group G in a microbroth approach.
Materials
- Bacterial colonies on a blood agar plate, stored <7 days in 4°C
- Blood agar plates
- 0.5 McFarland standard
- 1% BaCl2
- 1% H2SO4
- Saline tube (2 mL)
- Cotton tipped applicator
- Mueller-Hinton agar plates (MHA plates)
- MH broth with 50% lysed horse blood and 20 mg/mL β-NAD (MH-F)
- E-test penicillin/gentamicin (or antibiotics of interest) (BioMerieux, Marcy l'Etoile, France, Sweden)
- Antibiotics penicillin/gentamicin (or antibiotics of interest (powder/solution))
Note: The specific media used for bacterial growth may vary for different species.
Procedure
1. Epsilometer tests (E-tests)
- Set-up
- Wear gloves and a lab coat
- Ready the workspace by sterilizing it using 70% ethanol
- Collect Mueller-Hinton agar plates (MHA plates)
- Preparing a McFarland turbidity standard No. 0.5
- Prepare a 1% solution of barium chloride (BaCl2):
Add 1 gram anhydrous barium chloride (BaCl2) in 100 mL distilled water. Vortex well.
- Prepare a 1% solution of barium chloride (BaCl2):
Results
MIC values in E-test
Individual MIC values were identified in Figure 1 as 0.094 μg/mL for penicillin G and 8 μg/mLfor gentamicin. For synergy tests, both demonstrated an MIC value for penicillin G of 0.064 μg/mL (Figures 2, 3), while gentamicin had an MIC 4 μg/mL for cross and non-cross tests. Note a slight discrepancy between the cross and non-cross tests may occur due to the different incubation times of the strips in
Application and Summary
Antibiotic resistance is a worldwide health problem. In order to determine resistance mechanisms of microbes, methods testing for synergy and antagonism with different antibiotics is crucial. The E-test method is rapid, easy to replicate, and can be used to investigate any synergistic potential of combination therapies. The broth dilution method can also be assessed to predict bactericidal activity. In order to investigate the resistance mechanisms of different microbes, knowledge of synergistic and antagonistic antibiot


Skip to...
Videos from this collection:

Now Playing
Antibiotic Susceptibility Testing: Epsilometer Tests to Determine MIC Values of Two Antibiotics and Evaluate Antibiotic Synergy
Microbiology
94.2K Views

Creating a Winogradsky Column: A Method to Enrich the Microbial Species in a Sediment Sample
Microbiology
130.3K Views

Serial Dilutions and Plating: Microbial Enumeration
Microbiology
317.6K Views

Enrichment Cultures: Culturing Aerobic and Anaerobic Microbes on Selective and Differential Medias
Microbiology
132.5K Views

Pure Cultures and Streak Plating: Isolation of Single Bacterial Colonies from a Mixed Sample
Microbiology
166.8K Views

16S rRNA Sequencing: A PCR-based Technique to Identify Bacterial Species
Microbiology
190.1K Views

Growth Curves: Generating Growth Curves Using Colony Forming Units and Optical Density Measurements
Microbiology
298.7K Views

Microscopy and Staining: Gram, Capsule, and Endospore Staining
Microbiology
364.5K Views

Plaque Assay: A Method to Determine Viral Titer as Plaque Forming Units (PFU)
Microbiology
186.9K Views

Transformation of E. coli Cells Using an Adapted Calcium Chloride Procedure
Microbiology
87.2K Views

Conjugation: A Method to Transfer Ampicillin Resistance from Donor to Recipient E. coli
Microbiology
38.5K Views

Phage Transduction: A Method to Transfer Ampicillin Resistance from Donor to Recipient E. coli
Microbiology
29.3K Views
Copyright © 2025 MyJoVE Corporation. All rights reserved