
A subscription to JoVE is required to view this content. Sign in or start your free trial.
Method Article
ספקטרוסקופיית הד ספין נויטרונים כגשוש ייחודי לדינמיקה של קרום השומנים ואינטראקציות בין חלבון ממברנה
In This Article
Erratum Notice
Summary
מאמר זה מתאר את הפרוטוקולים להכנת מדגם, הפחתת נתונים וניתוח נתונים במחקרי הד ספין נויטרונים (NSE) של ממברנות השומנים. תיוג דיטריום נבון של שומנים מאפשר גישה לדינמיקה שונה של ממברנה על קשקשי אורך וזמן מזוסקופיים, שעליהם מתרחשים תהליכים ביולוגיים חיוניים.
Abstract
דו-שכבתיים שומנים מהווים את המטריצה העיקרית של קרום התא והם הפלטפורמה העיקרית לחילופי חומרים מזינים, אינטראקציות בין קרום חלבון וניצנים ויראליים, בין תהליכים תאיים חיוניים אחרים. לפעילות ביולוגית יעילה, קרום התא צריך להיות נוקשה מספיק כדי לשמור על שלמות התא ותאיו עדיין נוזל מספיק כדי לאפשר רכיבי ממברנה, כגון חלבונים ותחומים פונקציונליים, לפזר אינטראקציה. איזון עדין זה של תכונות ממברנה אלסטית וזורמת, והשפעתם על התפקוד הביולוגי, מחייבים הבנה טובה יותר של דינמיקת הממברנה הקולקטיבית על פני סולמות אורך וזמן מסוסקופיים של תהליכים ביולוגיים מרכזיים, למשל, עיוותי ממברנה ואירועי כריכת חלבונים. בין הטכניקות שיכולות לחקור ביעילות טווח דינמי זה הוא ספקטרוסקופיית הד ספין נויטרונים (NSE). בשילוב עם תיוג דיטריום, NSE יכול לשמש כדי לגשת ישירות כיפוף ותנודות עובי, כמו גם דינמיקה מסוסקופית של תכונות ממברנה נבחרות. מאמר זה מספק תיאור קצר של טכניקת NSE ומתאר את ההליכים לביצוע ניסויי NSE על ממברנות liposomal, כולל פרטים של הכנה מדגם תוכניות deuteration, יחד עם הוראות לאיסוף נתונים והפחתת. המאמר מציג גם שיטות ניתוח נתונים המשמשות לחילוץ פרמטרים מרכזיים של ממברנה, כגון מודולוס קשיחות כיפוף, מודולוס דחיסת שטח וצמיגות בתוך המטוס. כדי להמחיש את החשיבות הביולוגית של מחקרי NSE, דוגמאות נבחרות לתופעות ממברנה הנבדקות על ידי NSE נדונות, כלומר, ההשפעה של תוספים על קשיחות כיפוף הממברנה, ההשפעה של היווצרות תחום על תנודות ממברנה, ואת החתימה הדינמית של אינטראקציות חלבון ממברנה.
Introduction
ההבנה של קרום התא ותפקודם התפתחה להפליא בעשורים האחרונים. ההשקפה הקודמת של קרום התא כביבאי שומנים פסיביים המגדירים את גבולות התא וחלבוני קרום הבית1 הפכה בהדרגה למודל דינמי שבו דו-שכבתי השומנים ממלאים תפקיד חשוב בוויסות תהליכים ביולוגיים חיוניים, כולל איתות תאי, החלפה מולקולרית ותפקוד חלבונים - אם להזכיר כמה2,3,4,5,6. הבנה זו כי קרום התא הם דינמיים מאוד, כל הזמן עובר שיפוץ וחלוקה מולקולרית, דחף מחקרים מדעיים מעבר למבני שיווי משקל של ממברנות7,8,9. בהתאם, פותחו גישות מרובות כדי לחקור את המצבים הדינמיים השונים בממברנות שומנים ביולוגיות וביואינספיריות. עד כה, רוב המחקרים התמקדו בעיקר בתנועות מולקולריות מפוזרות10,11,12,13 ותנודות צורה מקרוסקופיות14,15,16, משאיר פער משמעותי בהבנת דינמיקת ממברנה ביניים, כלומר, תנודות קולקטיביות של מכלולי שומנים המורכבים כמה 10-100s של מולקולות השומנים. דינמיקה זו מתרחשת על פני סולמות אורך של כמה עשרות עד כמה 100 Å ועם הזמן סולמות של sub-ns עד כמה מאות ns (ראה איור 1), המכונה כאן קשקשים מסוסקופיים. זה אכן בקנה מידה זה כי פעילות ביולוגית מפתח מתרחשת ברמה הממברנה17. זה כולל ניצנים ויראליים18, ערוץ gating19, ו אינטראקציות חלבון ממברנה20. חשוב גם לציין כי הנוף האנרגטי של חלבוני הממברנה21,22 מראה כי שינויים קונפורמציה בחלבונים - הכרחיים לתפקידם הרגולטורי - מתרחשים לאורך סולמות הזמן ns23 של תנודות ממברנה קולקטיבית, תוך הדגשת החשיבות של דינמיקה מסוסקופית בתפקוד הביולוגי של קרום התא והאנלוגיות הביו-השראה שלהם20. מאמר זה מתמקד בשני המצבים הדינמיים המזוסקופיים העיקריים בממברנות השומנים, כלומר, תנודות כיפוף ותנודות עובי.
האתגר העיקרי בוחן ישיר מצבי תנודות אלה הוא הקושי לגשת בו זמנית לקנה המידה המרחבי והזמן שלהם בשיטות ספקטרוסקופיה סטנדרטיות. האתגר השני הוא שטכניקות מגע ישיר יכולות להשפיע על אותן תנודות שהן אמורות למדוד16. זה מחמיר עוד יותר על ידי המורכבות הרכב ומבנית של ממברנות ביולוגיות24,25, אשר התוצאה היא תכונות ממברנה לא הומוגנית, כולל היווצרות תחום השומנים26,27,28,29,30 ו אסימטריה ממברנה31,32,33- דורש בדיקות סלקטיביות כדי להבין את הדינמיקה של תכונות ממברנה שונות. למרבה המזל, ניתן להתגבר על אתגרים אלה בשיטות ספקטרוסקופיה לא פולשניות של נויטרונים, כגון הד ספין נויטרונים (NSE), אשר מטבען לגשת קשקשי האורך וזמן הנדרשים, ולאפשר עוד יותר מחקרים של תכונות ממברנה סלקטיבית מבלי לשנות את הסביבה הפיזיקוכימית שלהם34. ואכן, במהלך השנים האחרונות ספקטרוסקופיית NSE התפתחה לגשוש ייחודי ורב עוצמה של דינמיקת הממברנה הקולקטיבית35. תוצאות מחקרי NSE על ממברנות השומנים הפיקו תובנות חדשות על מכני36,37 ו צמיג38,39 תכונות של ממברנות השומנים לשפוך אור חדש על תפקידם הפוטנציאלי בתפקוד הביולוגי40,41.
טכניקת הספקטרוסקופיה של NSE מבוססת על עיצוב מכשיר אינטרפרומטרי, שהוצע לראשונה על ידי Mezei42, באמצעות סדרה של ספין סנפירים סלילים מגנטיים כדי לשלוט על הקדירה של ספין הנויטרונים כמו נייטרונים לחצות את המכשיר. העיצוב נשען על שיקוף מגנטי של יסודות השדה המגנטי ביחס למיקום המדגם(איור 1A). משמעות הדבר היא כי בהיעדר חילופי אנרגיה בין הנויטרונים לדגימה, הנויטרונים מבצעים את אותו מספר של נטיות ספין, בכיוונים מנוגדים, במחצית הראשונה והשנייה של המכשיר (שימו לב π-סנפיר בין שני סלילי ההקדמה). כתוצאה מכך, מצב הספין הסופי של הנויטרונים נותר ללא שינוי ביחס למצב ההתחלתי - תופעה המכונה ספין-הד (ראו נויטרונים שקופים באיור 1A). עם זאת, כאשר הנויטרונים מתקשרים במרץ עם המדגם, חילופי האנרגיה משנה את מספר ההטיות בסיבוב במחצית השנייה של המכשיר, מה שמוביל למצב ספין סופי אחר (ראו איור 1A). זה מזוהה באופן ניסיוני כהפסד בקיטוב, כפי שיוצג בהמשך מאמר זה. לקבלת פרטים נוספים על טכניקת NSE, הקורא מופנה מאמרים טכניים ייעודיים42,43,44,45.
כאן, תיאור פשוט מוצג כדי לספק הערכה גסה של סולמות האורך והשעה הנגישים עם NSE. סולמות האורך נקבעים על ידי טווח העברות wavevector בר השגה, Q = 4π sin θ/ λ, שבו2 θ הוא זווית הפיזור ו λ הוא אורך הגל הנויטרונים. ניתן לראות ש-Q מוגדר על ידי טווח אורך הגל והיקף הסיבוב של הזרוע השנייה של הספקטרומטר (ראו איור 1A). טווח Qטיפוסי על ספקטרומטרים NSE הוא ~ 0.02-2 Å-146,47, ועד 0.01-4 Å-1 עם שדרוגים אחרונים48,49, המקביל לקנה מידה מרחבי של ~ 1-600 Å. מצד שני, סולם הזמן הנגיש מחושב מזווית ההקדמה הכוללת (או השלב) שנרכשה על ידי הנויטרונים בתוך סלילי ההקדמה המגנטית, ונמצא50:  . בביטוי זה, t הוא זמן פורייה המוגדר
  כ, איפה
  היחס הגירומגנטי של הנויטרונים,
  הוא אורך סליל,
  והוא כוחו של השדה המגנטי של סליל. ראוי לציין כי זמן פורייה הוא כמות התלויה לחלוטין בגיאומטריית המכשיר, חוזק השדה המגנטי ואורך הגל הנויטרונים. לדוגמה, באמצעות נייטרונים של אורך גל
  = 8 Å והגדרות מכשיר של = 1.2 מ ' ו - 0.4 T, זמן פורייה מחושב להיות t ~ 50 ns. באופן ניסיוני, זמן פורייה מכוון על ידי שינוי הזרם בסלילי הקדם (כלומר, חוזק השדה המגנטי) או באמצעות אורכי גל נויטרונים שונים, וכתוצאה מכך סולמות זמן טיפוסיים של NSE של ~ 1 ps עד 100 ns. עם זאת, שדרוגים אחרונים בספקטרומטר NSE אפשרו גישה לזמנים ארוכים יותר של פורייה, עד כ-400 נ'ב בספקטרומטר J-NSE-Phoenix בספקטרומטר היינץ מאייר-לייבניץ זנטרום51 וספקטרומטר SNS-NSE במעבדה הלאומית אוק רידג'48, ועד ~ 1,000 ns בספקטרומטר IN15 NSE במכון לאו-לנגווין (ILL)49.
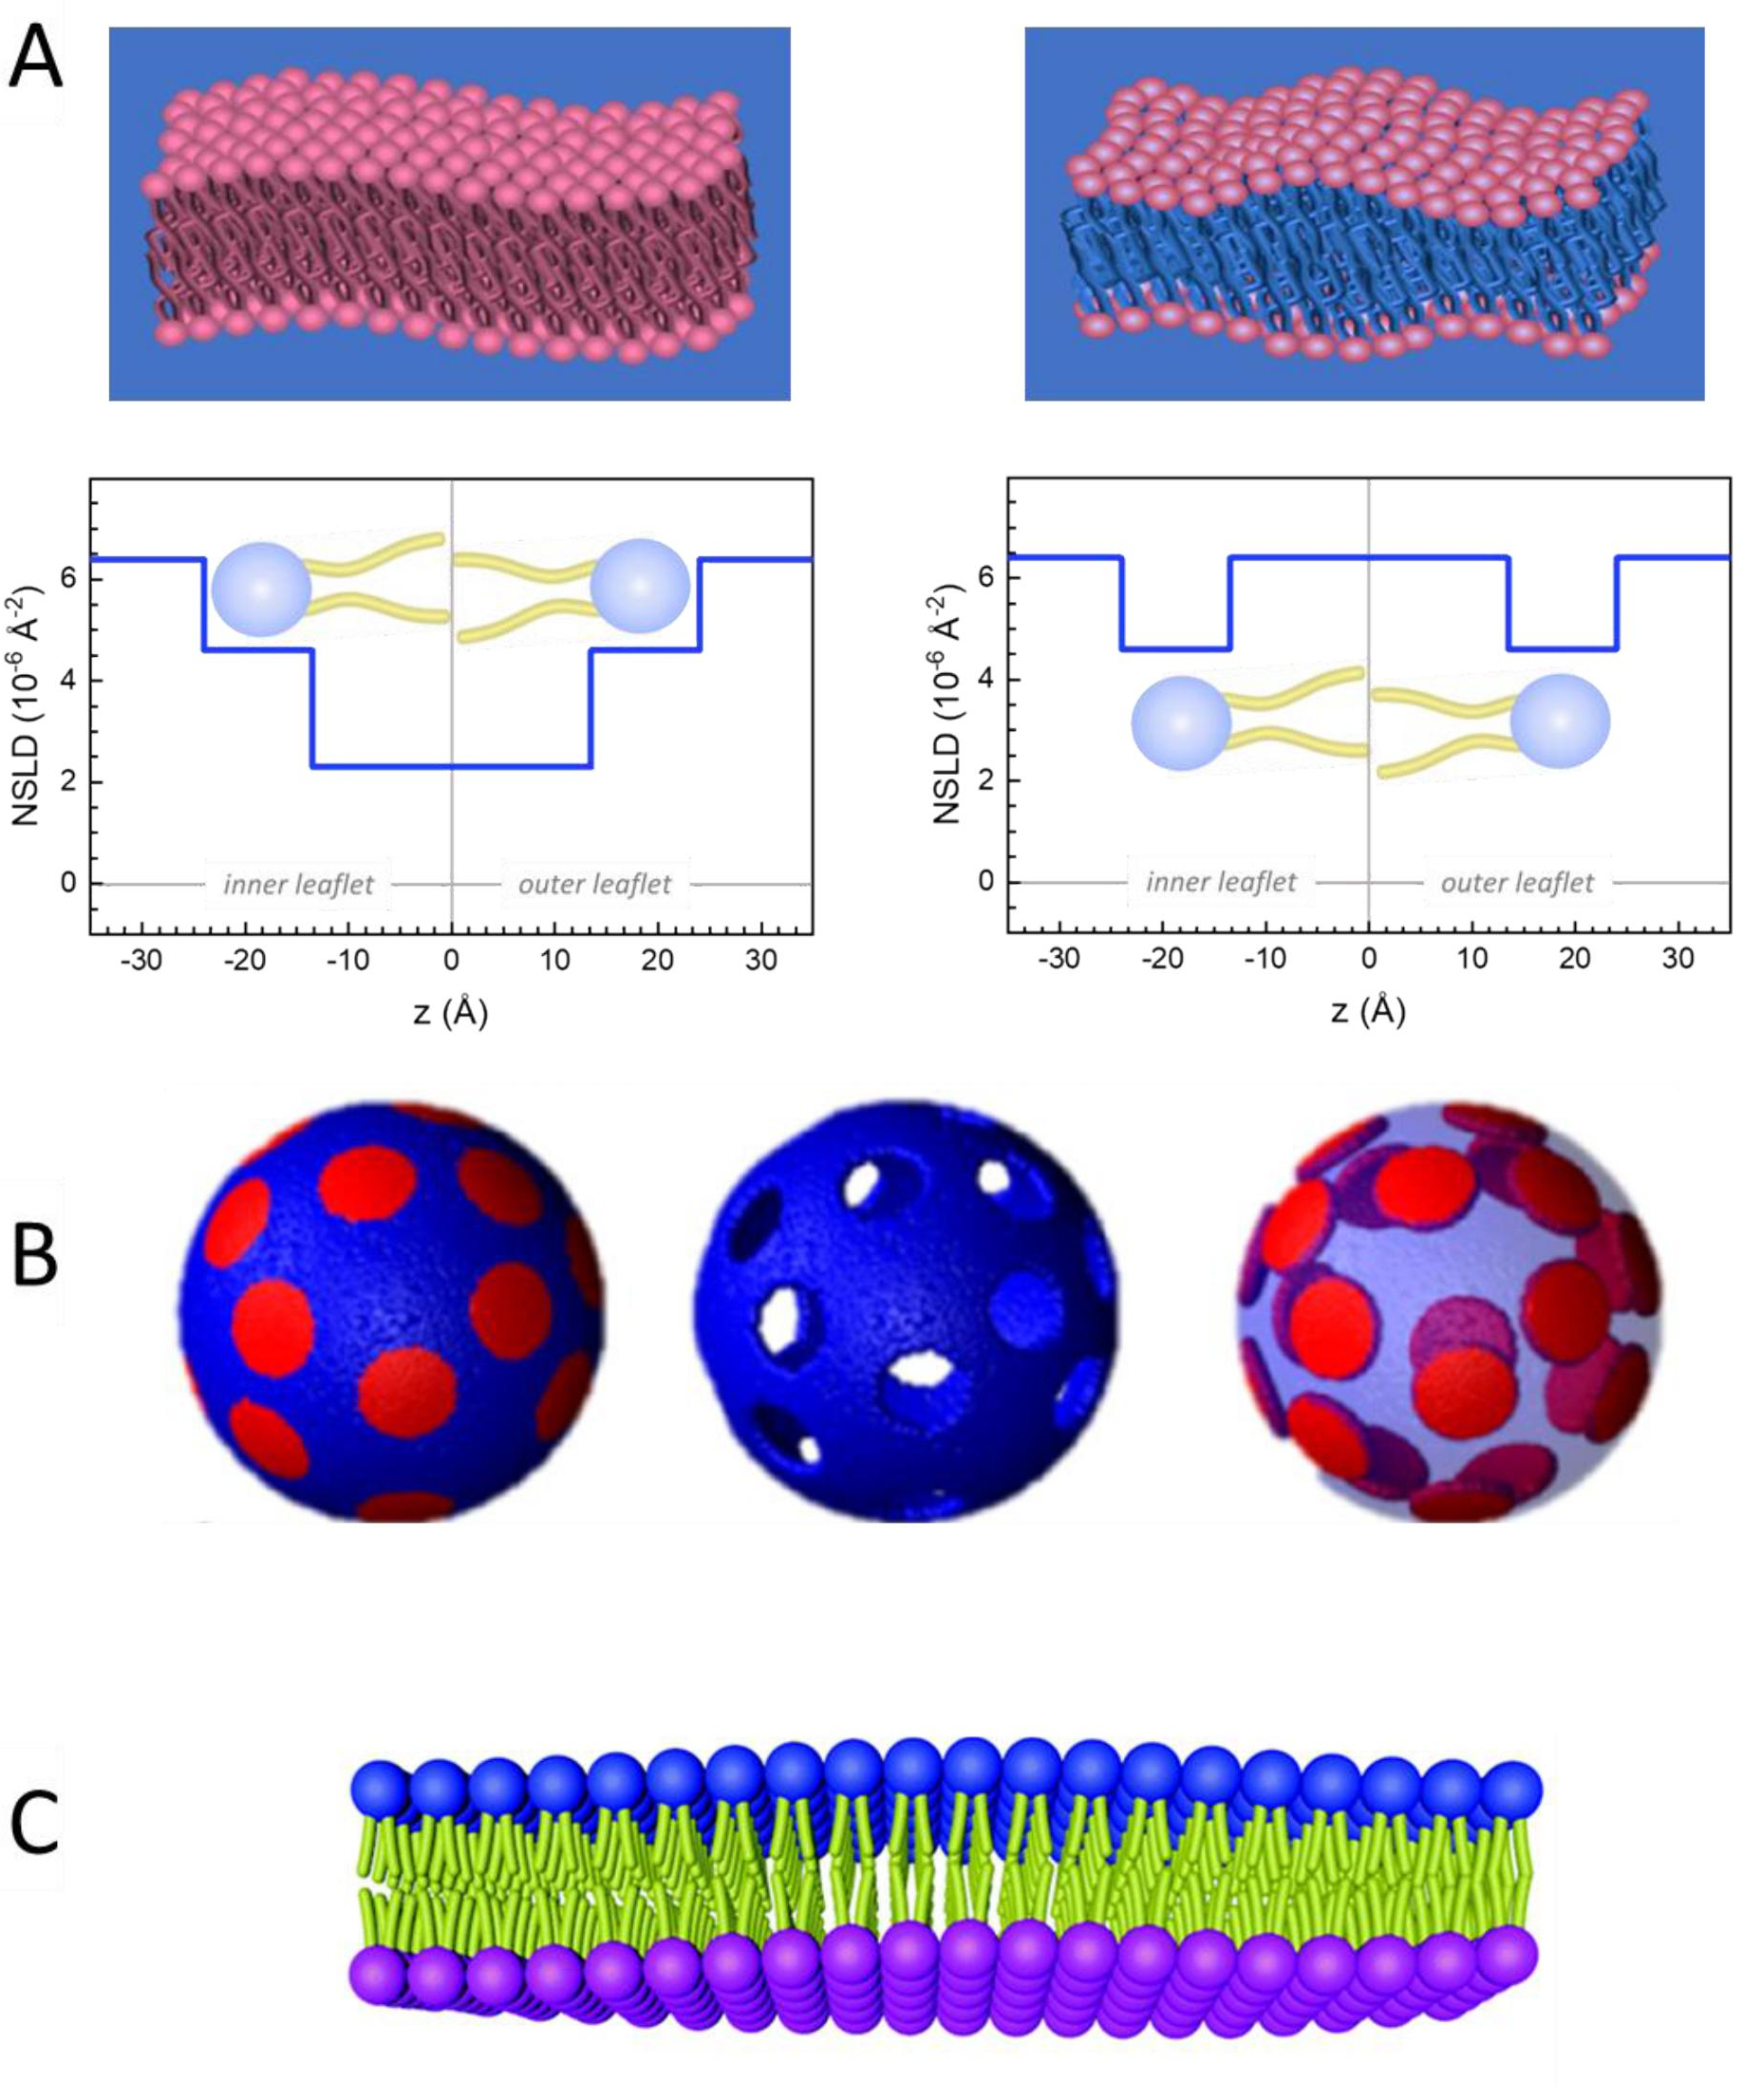
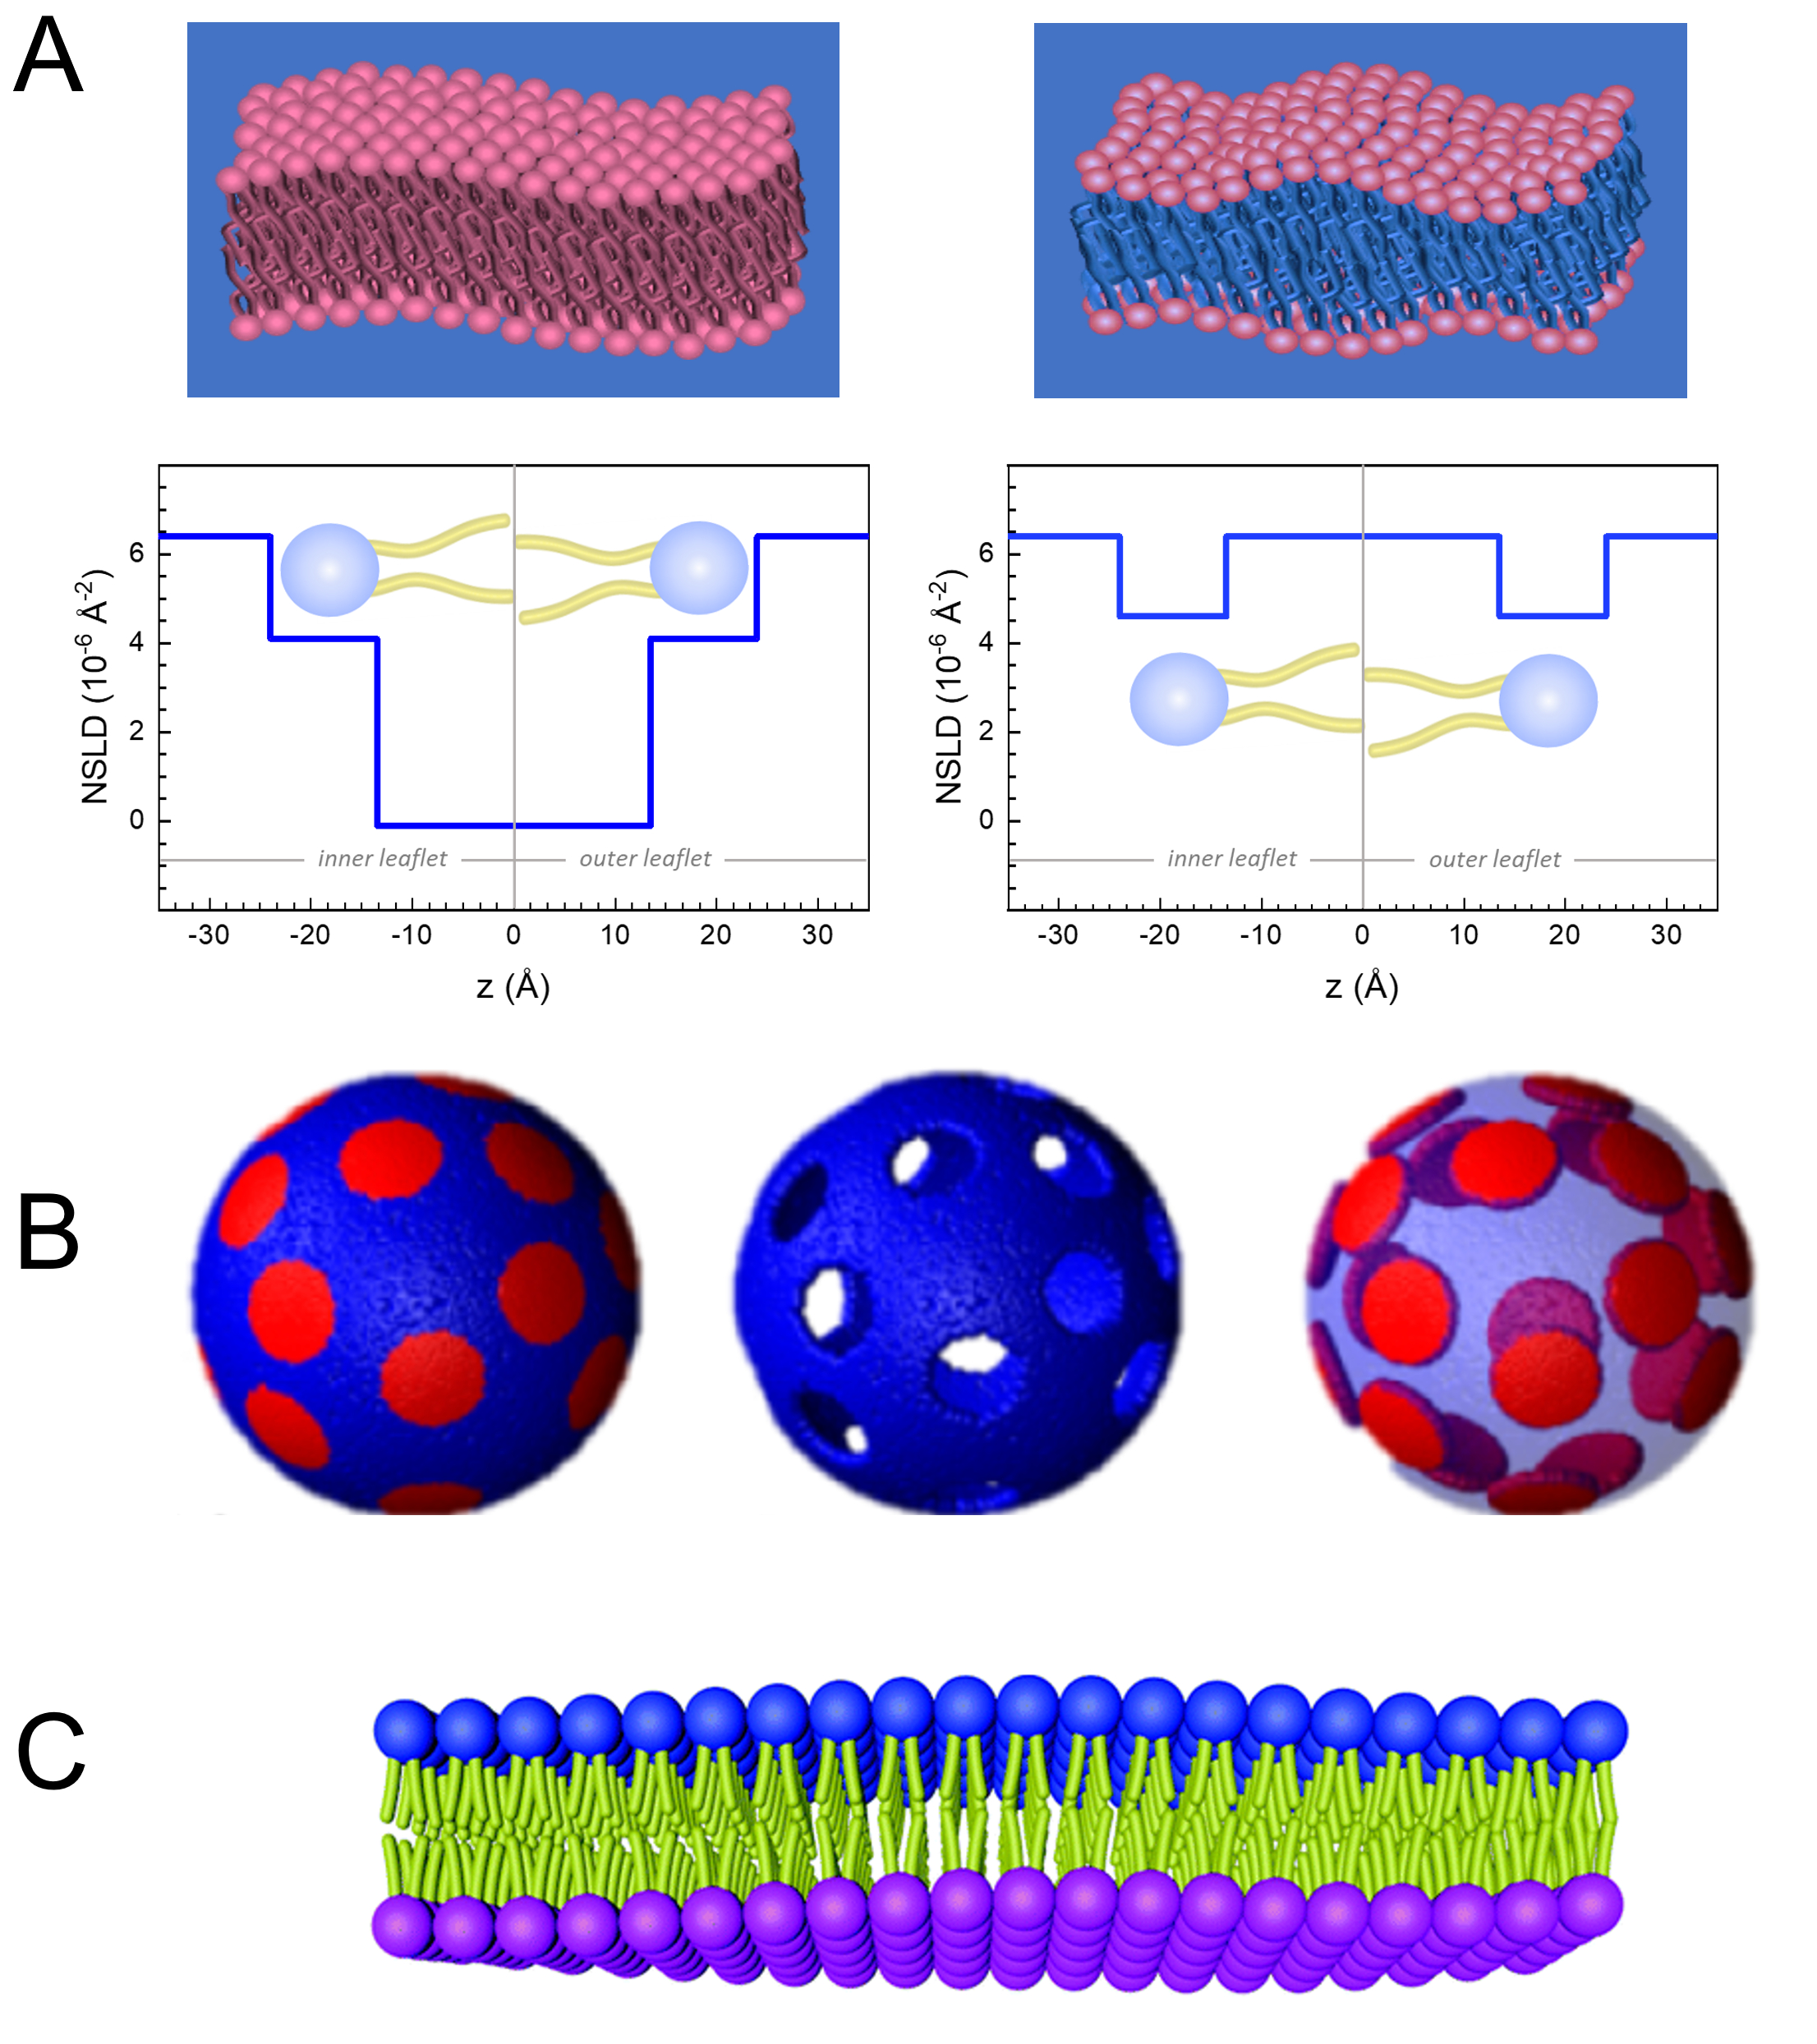
מלבד גישה ישירה לאורך ולקנה המידה של דינמיקת הממברנה, ל- NSE יש את היכולות הטבועות של רגישות איזוטופ נויטרונים52. באופן ספציפי, היכולת של נייטרונים לקיים אינטראקציה שונה עם האיזוטופים של מימן, היסוד הנפוץ ביותר במערכות ביולוגיות, גורמת לצפיפות אורך פיזור נויטרונים שונה,34 או NSLD (המקבילה של האינדקס האופטי של שבירה50), כאשר פרוטיום מוחלף על ידי דיטריום. זה מאפשר גישה המכונה וריאציה ניגודית, אשר משמש בדרך כלל כדי להדגיש תכונות ממברנה ספציפיות או להסתיר אחרים - התרחיש האחרון מכונה התאמת ניגוד. יישום תכוף של וריאציה /התאמה ניגודיות הוא החלפת מים (NSLD = -0.56 × 10⁻⁶ Å-2) על ידי מים כבדים או D2O (NSLD = 6.4 × 10⁻⁶ Å-2) כדי להגביר את אות הנויטרונים מקרום השומנים פרוטיים (NSLD ~ 0 × 10-6 Å-2). גישה זו יעילה מאוד במחקרים של מבנה הממברנה מכיוון שחדירת D2O לאזור קבוצת הראש של הממברנה מאפשרת קביעה מדויקת של עובי הממברנה (ראה איור 2A, פאנל שמאלי) ושל המיקום של קבוצות משנה שומנים שונות כאשר מודלים מתוחכמים יותר מוחלים53,54. מאמר זה מדגיש כמה דוגמאות על השימוש וריאציה ניגודיות למחקרים של דינמיקה קולקטיבית בממברנות biomimetic ותכונות ממברנה לבחור.
כאן, האפקטיביות של NSE במתן תובנות ייחודיות על תכונות ממברנה דינמית ופונקציונלית מודגמת באמצעות דוגמאות מוחשיות של מחקרי NSE על מודל ומערכות קרום שומנים רלוונטיות ביולוגית עם דגש על דינמיקה mesoscale בממברנות עצמאיות, בצורה של מתלים liposomal. עבור מדידות NSE של דינמיקת ממברנה בתוך המטוס, הקורא מתייחס פרסומים ייעודיים על ספקטרוסקופיית ספין-הד-הד של נויטרונים (GINSES)55,56 ומחקרים אחרים של ערימות ממברנה רב-שלמית מיושרות57,58,59,60.
לפשטות, מאמר זה מדגיש שלוש תוכניות שונות של פירוק ממברנה מאויר על דומיין נחקר היטב, או הפרדת פאזה, מערכת bilayer השומנים של 1,2-dimyristoyl-sn-גליצרי-3-פוספוצולין (DMPC) ו 1,2-distearoyl-sn-גלייצרו-3-פוספוצולין (DSPC) תערובות61,62. שני השומנים מאופיינים בחוסר התאמה באורך שרשרת הפחמימנים שלהם (14 פחמנים/זנב ב- DMPC לעומת 18 פחמנים /זנב ב- DSPC) וטמפרטורת המעבר של נוזל הג'ל שלהם (Tm, DMPC = 23 °C לעומת Tm, DSPC = 55 °C (C). התוצאה היא הפרדת פאזה לרוחב ב DMPC: DSPC ממברנות בטמפרטורות בין טמפרטורות המעבר העליונות והתחתונות של התערובת63. תוכניות ההסתה הנחשבות כאן נבחרות כדי להדגים את המצבים הדינמיים השונים הנגישים במדידות NSE על ממברנות ליפוזומליות, כלומר, תנודות כיפוף, תנודות עובי ותנודות כיפוף / עובי סלקטיביות של תחומים לרוחב. כל הרכבי השומנים מדווחים עבור DMPC:DSPC bilayers מוכן בשבר שומה של 70:30, באמצעות גרסאות פרוטציה ו perdeuterated זמין מסחרית של DMPC ו- DSPC. כל שלבי הכנת המדגם מבוססים על 4 מ"ל של השעיה ליפוזומית, ב D2O, עם ריכוז שומנים בדם של 50 מ"ג /מ"ל, עבור מסת שומנים כוללת של Mtot = 200 מ"ג לדגימה.
Protocol
1. ערכת ההסתה הנדרשת לניסוי
- למדידות תנודות כיפוף, הכינו ליפוזומים פרוטיים לחלוטין ב- D2O (D 99.9%) או D2O-buffer (למשל, מאגר פוספט שהוכן עם D2O במקום H2O). השתמש DMPC protiated מלא (C36H72NO8P) ו- DSPC (C44H88NO8P) עם
 133.4 מ"ג, שבו XDMPC ו- XDSPC הם שברי השומה של DMPC ו- DSPC, כאן מוגדרים ל- 0.7 ו- 0.3, בהתאמה, ו- MwDMPC ו- MwDSPC הם המשקלים הטוחנים הניתנים על ידי 677.9 גרם / מול ו 790.1 גרם / מול, בהתאמה. באופן דומה, mDSPC = 66.6 מ"ג. ערכת תיוג זו מגדילה את ניגוד הפיזור בין הממברנה (NSLD ~ 0 × 10-6 Å-2) לבין המאגר המנוטרל (NSLD ~ 6.4 × 10⁻⁶ Å-2) ומגבירה את האות מגלי ממברנה (ראה איור 2A בלוח השמאלי).
 - כדי למדוד את דינמיקת הכיפוף של תכונות ממברנה לרוחב נבחרות, למשל, דינמיקת מטריצה בממברנות DMPC הפרדת פאזה: DSPC, השתמש DMPC פרוטיאט (C36H72NO8P) ו deuterated, DSPC-d83 (C44H5NO8PD83, Mw 873.7 g /mol), כך mDMPC = 128.8 מ"ג ו mDSPC-d83 = 71.2 מ"ג. ערכת תיוג זו ממזערת את הפיזור מהתחומים העשירים ב- DSPC שאינם רצויים, ומאפשרת מדידות סלקטיביות של תנודות כיפוף מהמטריצה העשירה ב- DMPC (ראה איור 2B באמצע).
הערה: כדי למצוא את התיוג השומנים האופטימלי הנדרש עבור ערכת התאמת ניגודיות ספציפית, השתמש במחשבוני צפיפות אורך פיזור מבוססי אינטרנט זמינים (SLD), כגון זה שפותח על ידי מרכז NIST לחקר ניוטרון64. ממשקים מבוססי אינטרנט אלה מצוידים בכלים ידידותיים למשתמש לחישוב קל של SLD של שומנים בדרגות שונות של deuteration, כמו גם של תערובות שומנים. - עבור מדידות NSE של תנודות עובי הממברנה הממוצעת (ללא ניגודיות לרוחב), השתמש בגרסאות מפורקות זנב של שומנים המרכיבים, כלומר, DMPC-d54 (C36H18NO8PD54, 732.3 g/mol) ו- DSPC-d70 (C44H18NO8PD70, 860.1 גרם / מול)35,38, כך mDMPC-d54 = 133.0 מ"ג ו mDSPC-d70 = 67.0 מ"ג. ערכת ניגודיות זו (איור 2A,פאנל ימני) מגבירה את אות הפיזור מקבוצות הראש של השומנים (NSLD ~ 4.5 × 10⁻⁶ Å-2) על-ידי התאמת ניגודיות לקבוצת הזנב (NSLD ~ 6.4 × 10⁻⁶ Å-2) למאגר המנוטרל המאפשר זיהוי תנודות בעובי הממברנה.
- עבור מחקרי תנודות עובי של תאי ממברנה נבחרים, למשל, מטריצה עשירה ב- DMPC, השתמש באותה אסטרטגיה המתוארת בשלב 1.2 על-ידי החלפת שומני DMPC פרוטיים עם האנלוגים המנוטרלים בזנבם, כלומר, DMPC-d54, כך שהאזורים העשירים ב- DSPC מותאמים בניגוד למאגר המנוטרל ואות הפיזור העיקרי הוא מאזור קבוצת הראש של המטריצה העשירה ב- DMPC.
2. הכנת השעיית שומנים לשחצנות
- חשב את המסה של כל מרכיב במדגם, בהתאם להרכב המדגם. ככלל אצבע, עבור דגימות עם רכיבים מולקולריים מרובים, המסה של רכיב ניתנת על ידי המסה הטוחנת שלה, Mwi, משוקלל על ידי שבר השומה שלה, Xi, ונורמל על כל הרכיבים כגון: איפה
 Mtot הוא המסה הכוללת, להגדיר כאן 200 מ"ג. ראה את הדוגמה לעיל עבור DMPC-DSPC שומנים דו-שכבתיים עם תוכניות תיוג שונות.
 - באמצעות מיקרו-איזון דיגיטלי, שקול את המסות המחושבות של שומנים (ומרכיבי מדגם אחרים, למשל, חלבונים, חלקיקים וכו ') ולהוסיף אותם בקבוקון או בקבוקון עגול - זכור לשקול את הבקבוקון או הבקבוקון מראש. הוסף 1 מ"ל של ממס כדי להמיס את הרכיבים שקל על ידי ערבוב ידני בתוך מכסה המנוע. לקבלת דגימות שומנים טהורות, יש להשתמש בכלורופורם או באתנול. עבור דגימות עם רכיבים נוספים, שאינם שומנים בדם (למשל, חלקיקים), בחר ממס משותף המפזר את כל הרכיבים.
- עבור כמויות שומנים קטנות (<10 מ"ג), להכין פתרון מלאי pipette את הנפח הנדרש לתוך התערובת.
הערה: אין להוסיף כמויות מוגזמות של ממס כפי שהוא יאט באופן משמעותי את שלב ייבוש ממס המתואר להלן.
- עבור כמויות שומנים קטנות (<10 מ"ג), להכין פתרון מלאי pipette את הנפח הנדרש לתוך התערובת.
- יבש את תמיסת השומנים, בתוך מכסה המנוע, על ידי הזרמה עדינה של גז אינרטי (למשל, חנקן, ארגון) במכינה תוך סיבוב איטי של הגיוחן בזווית. שמור את הבקבוקונים במצב מוטה כדי ליצור סרט דק של שומנים מיובשים על קירות הבקבוקון, אשר יאפשר אפילו ייבוש. לסירוגין מניחים את הקרבון באמבט מים ב 35 °C (5 °F) כדי לעקוף קירור בתיווך אידוי, אשר יאט את אידוי הממס.
- מניחים את הבקבוקונים לילה בתנור ואקום ב ~ 35 °C (35 °F) כדי להסיר באופן מלא את הממס שיורית. עבור שומנים בלתי רוויים, טיהור ואקום עם גז אינרטי כדי למזער חמצון.
- כדי להבטיח הסרה מלאה ממס, לשקול את המשחקון לאחר ייבוש השומנים ולאשר כי אין מסה עודפת מעבר לכמויות הנמדדות של חומרים. לעשות זאת על ידי הפחתה המסה של המשחקון מן המסה הנמדדת לאחר הייבוש. אם יש מסה עודפת, לייבש את המדגם תחת ואקום עוד 6 שעות. חזור על תהליך זה לפי הצורך.
- לחות את סרט השומנים עם 4 מ"ל של D2O או D2O-buffer כדי להשיג ריכוז שומנים בדם של 50 מ"ג / מ"ל. עבור שומנים עם טמפרטורות מעבר גבוהות, כגון תערובות DMPC-DSPC, לחמם את המאגר מעל טמפרטורת המעבר (60 °C )C) כדי להבטיח אפילו ערבוב.
הערה: מאחר שניסויי NSE דורשים נפחי דגימה גדולים יחסית (~4 מ"ל), שקול להעניק לחות לדגימה באמצעות מחצית מהמאגר הנדרש, כלומר 2 מ"ל, כדי למזער את מספר ההבלטות לדגימה (ראה סעיף 3). במקרה זה, הוסף את החצי הנותר של שחול פוסט המאגר. שים לב כי הקיבולת של מזרקים המשמשים שחול מוגבל 1 מ"ל. לכן, לחות עם 4 מ"ל של חוצץ ידרוש ארבעה סטים של שחול. - מערבבים את תמיסת השומנים הלחות עד שסרט השומנים מומס לחלוטין ואינו נראה עוד על קירות הנקינה. בשלב זה, השומנים הלחות יוצרים שלשולים רב-שלמים וערימות רב-שלמות בגודל מיקרון והמתלים נראים לבנים חלביים.
- כדי להקל על שבירת ערימות השומנים ולהפחית את הרב-לאומיות, בצעו חמישה מחזורי הקפאה/הפשרה על ידי הנחת מחמת התמיסה של השומנים הלחותיים במקפיא באיכות מעבדה (רצוי -80 מעלות צלזיוס מקפיא) עד להקפאה מלאה ולאחר מכן העברת הבקריאל לאמבט מים של 35 מעלות צלזיוס עד לתמיסת השומנים מופשרת במלואה. מערבולת הפתרון המופשר עד הומוגני. חזור על הפעולה ארבע פעמים נוספות.
הערה: לחלופין, אמבט קרח יבש יכול להיות מוכן להקפאה מהירה על ידי שילוב אצטון וקרח יבש.
3. שחול של תמיסת השומנים hydrated
- להרכיב את ההתקנה extruder באמצעות קרום פוליקרבונט בין שתי תומכות ממברנה והוספת שני מסנני נייר בכל צד כדי לספק תמיכה נוספת. השתמש בקרום פוליקרבונט עם גודל נקבובית התואם את גודל ליפוזומלי היעד (גדלי נקבוביות נפוצות לניסויי NSE הם 50 ננומטר ו 100 ננומטר – בדרך כלל, ליפוזומים בקוטר 100 ננומטר מאפשרים תנודות ממברנה מוגבלות פחות, אבל ליפוזומים קטנים יותר 50 ננומטר יכול לשמש למחקרי עקמומיות). ודא כי קרום פוליקרבונט נמתח במלואו לפני השלמת ההרכבה והידוק מארז המהלום החיצוני.
- לחות את קרום פוליקרבונט על ידי העברת ~ 0.3 מ"ל של D2O או D2O-buffer כמה פעמים דרך הרכבת הממברנה באמצעות מזרקי זכוכית אטום. השתמש באותו מאגר המשמש להכנת מדגם. השאירו אותו לפחות 10 דקות, ולאחר מכן למצוץ לחלוטין את המאגר החוצה לפני הצגת המדגם.
- מלא מזרק 1 מ"ל גז הדוק עם פתרון השומנים מוכן ולהכניס לקצה אחד של מנגנון extruder. לאחר מכן, הכנס מזרק ריק לקצה הנגדי. ברגע שהמזרקים מחוברים להרכבה של המהלך, הנח אותו לתוך בלוק המהלל.
- אם יש צורך בטמפרטורות גבוהות לשחול, כמו במקרה של שומנים רוויים עם טמפרטורות מעבר גבוהות (למשל, DSPC, Tm = 55 °C (55 °C), לחמם מראש את בלוק חימום המהלל מעל טמפרטורת המעבר השומנים (למשל, 60 °C ), על ידי הצבת בלוק החימום על צלחת חמה או באמצעות אמבט מחזור כפי שמוצג באיור 3A.
הערה: צעד זה חיוני כדי להבטיח ערבוב הומוגני של שומנים ולהימנע הפעלת לחץ קיצוני במהלך שחול, אשר יכול לקרוע את קרום פוליקרבונט. עבור דגימות שומנים עם טמפרטורות מעבר נמוכות (<25 °C (25 °F), לבצע את שחול בטמפרטורת החדר. - כדי להחציש את תמיסה השומנים, חברו את הסט של המשט למשאבת מזרק ניתנת לתכנות עם מסגרת אלומיניום/פלדה כפי שמוצג באיור 3A. עבור שחול מבוקר טמפרטורה, הוסיפו בסיס אקסטרונדר שנבנה בהתאמה אישית עם ערוץ נוזלים והתחברו לאמבט מים במחזור.
- לתכנת את משאבת המזרק לבצע 15-20 מחזורי שחול בעקבות המדריך של היצרן. כאשר בולט, הצבע של פתרון השומנים משתנה מלבן חלבי לכחול אופל שקוף (איור 3B,C),המציין גודל ליפוזומל סופי הקטן יותר מאורך הגל של האור הנראה, כצפוי. עבור סוג משאבת המזרק המוצג באיור 3A, בצעו את השלבים הבאים.
- התחל על-ידי התאמת הגדרות המשאבה. החזק את לחצן קצב לחוץ והזן את קצב ההבלטה (50.99 מ"ל/שעה), ולאחר מכן לחץ על לחצן קוטר והזן את קוטר המזרק (4.606 מ"מ). השתמש בחצים למעלה מתחת לכל ספרה על המסך כדי לשנות את ערך הספרה.
- מקם את הסט של המהוה עם מזרק הדגימה מימין (ראו איור 3A). לחץ על לחצן משיכה עד שנורת הנסיגה נדלקת. לחץ על התחל והמתן עד שהדגימה תחלק למזרק השמאלי (הריק).
- לחץ על לחצן עצור רגע לפני שהמזרק לדוגמה (מימין) ריק לחלוטין. הקלט את אמצעי האחסון שניתן ולהשתמש בו כדי לתכנת את מחזור ההבלטה. החזק את לחצן 'תעריף' לחוץ עד ששלב 1 (PH:01) יופיע על המסך. לחץ על לחצן עוצמת הקול כדי להזין את אמצעי האחסון שהוקלט קודם לכן. בשלב זה, ודא כי אור לסגת כבוי - זה מחלק את המדגם בכיוון הנכון.
- לחץ שוב על לחצן תדרג והשתמש בחץ הימני ביותר למעלה כדי לגשת לשלב 2 (PH:02). הקש אמצעי אחסון כדי להזין את אותו ערך של אמצעי האחסון שהוקלט קודם לכן. בשלב זה, לחץ על לחצן משיכה עד שהנורית לסגת דולקת – פעולה זו מחלקת את המדגם שמאלה.
- כדי לחזור על מחזור זה, לחץ שוב על לחצן דרג והשתמש בחץ הימני ביותר למעלה כדי לגשת לשלב 3 (PH:03). לחץ על לחצן עוצמת הקול עד ש- LP:SE יופיע על המסך והגדר אותו ל- 20. זהו מספר הלולאות או החזרות שהמשאבה תבצע. לבסוף, לחץ על לחצן קצב, גש לשלב 4 (PH:04) ולחץ על לחצן עוצמת הקול כדי להגיע לפונקציה Stop. המשאבה מוגדרת כעת עבור שחול אוטומטי.
- לחץ על התחל כדי להתחיל את מחזור ההבלטה.
- רוקנו את המזרק המכיל את השעיית השומנים המובלטת בתקנה נקייה והתכוננו לאחסון או למדידות. עבור דגימות שומנים בדם עם טמפרטורת התכה גבוהה, לאחסן את המדגם מעל המעבר שלב הנוזל עד נמדד. אחרת, לשמור על דגימות בטמפרטורת החדר.
- אין להקפיא דגימות מוחצות שכן הקפאה תגרום לשלשלות להתפוצץ (ההשעיה תהפוך שוב ללבנה חלבית).
4. מדידות NSE עבור המדגם והפחתת הנתונים שנאספו
- לפני ניסוי NSE, לאפיין את המדגם liposomal extruded בשלב 3.7 באמצעות שיטות זמינות כדי להבטיח איכות מדגם נאותה. רשימה של שיטות charcaterization פוטנציאליות שניתן להשתמש בהן כדי להעריך את איכות ההשעיות liposomal עבור ניסויי NSE, למשל, התפלגות גודל, multilamellarity, מבנה ממברנה לרוחב, כלול בסעיף הדיון.
- קבע את טווח Q ואת הגדרות המכשיר המתאים הנדרשות עבור הניסוי. עבור כיפוף מדידות קשיחות של bilayers השומנים, להשתמש בטווח Q של ~ (0.04 - 0.2) Å-1. עבור מחקרים של תנודות עובי הממברנה, להשתמש בטווח Q של ~ (0.04 - 0.2) Å-1 המתאים לעובי הממברנה35,66,67.
הערה: שוחחו על ההתקנה הניסיונית עם מדען המכשירים לפני תחילת הניסוי. כפי שהוזכר קודם לכן, מאופיין SANS של המדגם הוא הכרחי, במיוחד אם מידע מוקדם של אות הפיזור אינו זמין, כמו ממברנות מפורקות סלקטיבית. לחלופין, הפעל מדידות סטטיות (הידועות גם בשם עקיפה) על פני טווח Q מוגבל במכשיר NSE, עם האזהרה כי מדידות כאלה לוקחות הרבה יותר זמן בהשוואה SANS. - באמצעות מזרק או פיפטה העברה, לטעון את מתלים liposomal extruded בתאי המדגם המיועדים הזמינים בקווי קרן NSE. שים לב שתאי מדגם NSE סטנדרטיים מגיעים בעוביים של 1, 2, 3 ו- 4 מ"מ. בחר את עובי התא באופן כזה כדי לייעל את אות הפיזור תוך שמירה על אות הרקע הלא ברור בעוצמה סבירה.
הערה: ככלל אצבע, השתמש בתאים לדוגמה עם אורך נתיב של 1 או 2 מ"מ עבור ליפוזומים פרוטיים במאגר מפוקח – תאים עבים יותר עלולים לגרום להשפעות פיזור מרובות שקשה לתקן עבורן. עבור ליפוזומים עם רמות גבוהות יותר של deuterations (למשל, ליפוזומים תואמי זנב או ליפוזומים אסימטריים עם עלונים פרוטיים בודדים), שקול להשתמש בתא מדגם עבה יותר (למשל, 3 או 4 מ"מ אורך נתיב) כדי לשפר את סטטיסטיקת הספירה אם המדגם זמין בכמויות גדולות יותר - לפעמים זה יכול להיות אוסר. - הכן תא מדגם זהה עבור המאגר. השתמש באותו חוצץ כמו במתלה liposomal. מדידות על המאגר נחוצות לנורמליזציה של עוצמה ולתיקון רקע (BKG).
- מקם את התאים לדוגמה במחזיק המדגם של ספקטרומטר NSE, תכנת את הפעלת המדידה ואסוף נתוני הד. התייעץ עם מדען המכשירים לגבי תכנות המדידות אם משתמש NSE בפעם הראשונה.
- בצע שתי קבוצות נוספות של מדידות הדרושות להפחתת הנתונים: מדידות רזולוציה (R) ושידור (T).
- בצע מדידת רזולוציה (R) על הפניית פיזור אלסטית (למשל, פחמן) - שתפעל תחת אותן הגדרות; כלומר, אותו גל-וקטור ו-פורייה כפול מדידות הדגימה והחוצץ.
- בצע מדידות שידור (T) על המדגם והחוצץ כדי לחשב את עוצמת קרן הנויטרונים המשודרת (ראה שלב 4.9 להלן). השידור מחושב כיחס ספירת הנויטרונים מהדגימה או מהחוצץ חלקי ספירת הנויטרונים עבור קרן פתוחה (כלומר, עם מיקום מדגם ריק).
- השתמש בתוכנה הייעודית להפחתת נתונים עבור ספקטרומטר NSE שבו מבוצעות המדידות כדי להפחית את הנתונים שנאספו.
הערה: ספקטרומטרים שונים עשויים להשתמש בתוכנה או בממשקי משתמש שונים. להלן דוגמה להפחתת נתוני NSE באמצעות סביבת ניתוח נתונים ופריטים חזותיים (DAVE)68 תוכנה שנכתבה במיוחד עבור ספקטרומטר NSE במרכז NIST לחקר ניוטרון.- פתח את תוכנת DAVE ובחר הקטן נתוני NSE מתפריט הפחתת הנתונים. יופיעו מספר חלונות מוקפצים.
- העלה את קבצי הנתונים מעל ערכי Q שונים באמצעות פתח קבצי .echo מתפריט הקובץ. קבצים אלה תואמים לקבצי הנתונים הגולמיים עם אותות ההד של הסיבוב ויש להם את הסיומת .echo בשם הקובץ. לאחר השלמת העלאת הקובץ, הקבצים ימוצגו תחת ערכות הנתונים הזמינות.
- לחץ באמצעות לחצן העכבר הימני על הקובץ שנבחר ותייג אותו בהתאם למדידה שהוא מתאים לה; כלומר, דוגמה, תא (עבור תא או מאגר ריקים) או רזולוציה.
- קבץ את פיות הגלאי ב- 2 x 2 כדי לשפר את יחס האות לרעש באמצעות הכרטיסיה ערכת נתונים. החל את אותו binning על כל הקבצים; כלומר, רזולוציה, תא ודוגמה.
- בדוק את הנתונים על כל קבוצות הפיקסלים והסוו את אלה עם אותות גרועים (ראה איור 4B) על-ידי הקשה על מקש m במקלדת. הקש Enter כדי לגשת לחלון מוקפץ כדי להחיל את אותה מסיכה על כל הפעמים של פורייה או על פי ארבע שנים עוקבות. ניתן להחיל זאת גם על פיקסלים בודדים בכל שלב במהלך הפחתת נתונים. פיקסלים עם מסיכה יהפכו לירוקים.
- ודא שהנתונים שנאספו הם בצורת אות הד, כלומר פונקציית קוסינוס במונחים של זרם הפאזה, מעל כל פיקסל גלאי (ראה איור 4A).
הערה: זרם הפאזה פרופורציונלי לזווית ההקדמה של ספין הנויטרונים; לפיכך, מקובל לייצג את זרם הפאזה כזווית פאזה כפי שמוצג באיור 4A. עבור מדידות על מקורות פעמו, זמן נוסף של חישובי טיסה מוחלים על הנתונים כדי לקבל את אותות ההד כפונקציה של אורך גל נויטרונים תקרית בתוך פעימת נויטרונים. - התחל על-ידי התאמת קובץ הרזולוציה. בחר קובץ רזולוציה מרשימת הקבצים שהועלה ולחץ באמצעות לחצן העכבר הימני על הקובץ. בחר התאם פעולות: התאם הדים (רזולוציה) מהתפריט הנפתח.
- ודא כי ההתקפים של אותות ההד מניבים מספר פרמטרים מתאימים, כולל הפרמטר, A, הנדרש בשלב 4.8. ההתקפים מבוצעים באופן אוטומטי באמצעות הביטוי הבא.

כאן, ζ היא התקופה של אות ההד (כלומר, פונקציית קוסינוס באיור 4A), σ הוא רוחב המעטפה הגאוסית שנקבע על ידי אורך הגל הממוצע והתפשטות אורך הגל של קרןהנויטרונים האירוע, Φc הוא זרם הפאזה, ו- Φ0 היא נקודת ההד התלויה בנתיב השדה שחוויםנייטרונים 50. מידע פיזי על המדגם מקודד במשרעת, A, של פונקציית הקוסינוס במשוואה (1).
הערה: רוחב המעטפה הגאוסית מבוסס על ערכים קבועים מראש על ידי מדען המכשיר ואין לשנותם. המשתלבים האחרים הם משתנים המותאמים לאות ההד הספציפי מעל כל פיקסל. - בדוק את תוצאות ההתאמה על-ידי לחיצה על כל פיקסל כדי להציג את הפרמטרים המתאימים המתקבלים, את איכות ההתאמה ואת הסטייה הריבועית הממוצעת של ההתאמה. כדי לבדוק את השגיאה המשויכת לכל פרמטר התאמה מעל הגלאי כולו, בחר אפשרויות תמונה ולאחר מכן בחר את הפרמטר המתאים של עניין. פעולה זו תיצור מפה עם הערך של המסגור המתאים מעל כל פיקסל. לחץ באמצעות לחצן העכבר הימני על תמונת הגלאי. יופיע חלון מוקפץ המציג מפת פס שגיאה של פרמטר ההתאמה שנבחר.
- אם ההתאמה לפיקסל מסוים אינה מספקת (למשל, התאם פרמייזרים לסרגלי שגיאה גדולים), התאם מחדש את האות מעל הפיקסל הספציפי הזה. בחר פיקסלזה , הקש על הכרטיסיה התאמה ולאחר מכן הקש על התאם פיקסל. הזן פרמטרי התחלה חדשים עבור השלב (Φ0) ונקודה (ζ) בכרטיסיה התאמה כדי לקבל התאמה משביעת רצון יותר.
הערה: כדאי להתוות את השלב המותאם כפונקציה של זמן פורייה. כדי לעשות זאת, עבור אל חלון ההתוויה הראשי ובחר התאם שלב נ' זמן פורייה. חלקה זו צריכה להיות חלקה ורציפה. בדוק אי-רציפות בעלילה זו והתאים מחדש את הפיקסלים שהם תואמים להם.
- הקטן את הקובץ מדגם או תא על-ידי בחירת הקובץ המתאים מרשימת הקבצים שהועלה ומתויג בתווית.
- בדוק את כל הפיקסלים והסוות את אלה עם סטטיסטיקה שגויה כמתואר בשלב 4.7.5.
- לחץ באמצעות לחצן העכבר הימני על הקובץ ובחר התאם פעולות: ייבוא שלבים (דוגמה, תא). פעולה זו מייבאת את השלבים ואת המסיכה המוחלת מקובץ הרזולוציה.
- התאם את אותות ההד באמצעות אותו הליך שתואר קודם לכן עבור קובץ הרזולוציה (שלבים 4.7.8-4.7.10). בהתאמת קבצי מדגם ותא, אל תשנה את ערכי התקופה ונקודת שלב ההד המיובאת מהתאמת הרזולוציה מתאימה. פרמטרים אלה תלויים בהגדרות האינסטרומנטליות ואינם אמורים להשתנות עם דוגמאות.
- לפני שתמשיך להפחתת נתונים, הזן את מרכז הקרן עבור כל קבצי הנתונים. בחר את קובץ הנתונים, עבור לכרטיסיה כללי והזן ערכי מרכז קרן X ו- Y. ערכים אלה נרשמים במהלך הניסוי.
- לאחר השלמת ההתאמות לקבצים מדגם, תא ופתרון, חשב את פונקציית פיזור הביניים המנורמלת שתשמש מאוחר יותר בניתוח נתונים ובפרשנות. כדי לעשות זאת, לחץ באמצעות לחצן העכבר הימני על הקובץ לדוגמה שיש להפחית מרשימת הקבצים המותאמים ובחר חשב I(Q) מהתפריט הנפתח. יופיע חלון עם אפשרויות הזנה עבור קבצי הרזולוציה והתא (כלומר, המאגר) ומספר Q-arcs (ראה שלב 4.9). לאחר הזנת כל הלא רשמי הנדרש, לחץ על לחצן אישור. התוצאות יופיעו בחלון חדש.
הערה: הפחתת הנתונים מתבצעת בהתאם למשוואה הבאה כדי להשיג את פונקציית פיזור הבינייםמנורמלת 69.
כאשר t הוא זמן פורייה, Nלמעלה ו- Nלמטה הם ספירת הנויטרונים בתצורות שאינן ספין-להעיף וספין-להעיף (נמדד עם π/2-סנפירים כבויים ואת π-סנפיר לסירוגין, בהתאמה), ואת הכתבים, BKG ו- R, להתאים את מידות הרקע והרזולוציה, בהתאמה, כפי שהוגדרו בשלבים 4.4 ו -4.6. שים לב כי קיטוב הקרן , ובכך משתנה במצב ספין עקב חילופי אנרגיה בין הנויטרונים לבין המדגם מזוהה כירידה בקיטוב (מאחדות).
- לבסוף, קבץ את הפיקסלים של הגלאי לקשתות Qכפי שמוצג באיור 4B כדי להשיג את התלות Q-של פונקציית פיזור הביניים מנורמלת, S(Q,t) / S(Q,0). זה מכונה טכנית binning נתונים ויש לעשות זאת בשיקול דעת, כלומר, תוך התחשבות בסטטיסטיקות הספירה מהמדגם ואת סטיית התקן הצפויה של הנתונים על הפיקסלים המקובצים.
- לפיזור דגימות חזק, חלקו את הגלאי ליותר Q-arcs תוך שמירה על קווי שגיאה סבירים בפונקציית פיזור הביניים שנוצרה, S(Q,t) / S(Q,0). פעולה זו מניבה יותר נקודות נתוני Q וחשובה עבור הליך ניתוח הנתונים המתואר להלן. שים לב כי עבור דגימות פיזור חלש, binning מוגזם תוצאות אותות ריקבון ירודים, כלומר, קווי שגיאה גדולים על S(Q,t) / S( Q,0), אשר עלול לגרום לאי ודאות גדולה.
5. ניתוח נתונים ופרשנות
- התאם את פונקציות פיזור הביניים מנורמל, S(Q,t) / S(Q,0), המתקבל מהפחתת הנתונים לעיל לתפקוד מעריכי מתוח עם מעריכי מתיחה של 2/370.

הערה: דוגמה להתקפים אלה מסופקת באיור 5B. התקפי S(Q,t) / S(Q,0) למשוואה (3) מניבים את שיעורי ההרפיה תלויי Q Γ (Q). - התוויית Γ(Q)כפונקציה של Q ולהתאים למודל מתאים לחילוץ פרמטרים רלוונטיים ממברנה.
תוצאות
מחקרי NSE גישה לתנודות כיפוף מבוצעים בדרך כלל על פני טווח Q של ~ (0.04 - 0.2) Å-1. טווח Q זה מתאים לקשקשי אורך ביניים בין עובי הממברנה לרדיוס הליפוזום, שבו דינמיקת הכיפוף שולטת. מדידה על פני טווח Q מורחב יכולה להעניק גישה למצבים דינמיים נוספים, כולל דיפוזיה ליפוזומלית ודינמיקה תוך-ממדית. לקבלת פ...
Discussion
NSE היא טכניקה רבת עוצמה וייחודית במדידת דינמיקה מסוסקופית של ממברנות שומנים בדם בתנאים שונים. הניצול היעיל של NSE תלוי באיכות המדגם, בניגודיות הנויטרונים ובמגוון הדינמיקה הנגישת שניתן לבדוק עבור מדגם נתון. לכן, נדרשים מספר צעדים קריטיים לביצוע ניסויי NSE מוצלחים ואיסוף נתונים באיכות גבוהה. ?...
Disclosures
המחברים אינם מצהירים על ניגודי עניינים ואין להם מה לחשוף.
Acknowledgements
ר. אשקר תודה מ. נגאו, ל.ר. סטינצ'יו, ו P. Zolnierczuk לדיונים שימושיים רבים ועל עזרתם התכופה בניסויי NSE על קווי הקורה שלהם. המחברים מכירים בשימוש בספקטרומטרי הד ספין נויטרונים ב- NIST ו- ORNL. ספקטרומטר NSE ב- NIST נתמך על ידי המרכז לפיזור ניוטרון ברזולוציה גבוהה, שותפות בין המכון הלאומי לתקנים וטכנולוגיה לבין הקרן הלאומית למדע בהסכם לא. DMR-1508249. ספקטרומטר NSE במקור הנויטרונים של ORNL נתמך על ידי חטיבת מתקני המשתמש המדעי, המשרד למדעי האנרגיה הבסיסית, מחלקת האנרגיה של ארה"ב. המעבדה הלאומית אוק רידג' מנוהלת על ידי UT-Battelle, LLC תחת חוזה DOE בארה"ב לא. DE-AC05-00OR22725.
Materials
| Name | Company | Catalog Number | Comments |
| Chloroform (biotech grade) | Sigma Aldrich | 496189 | Biotech. grade, ≥99.8%, contains 0.5-1.0% ethanol as stabilizer |
| Circulating water bath | Julabo | SE-12 | Heating Circulator with smart pump, programmable temperature settings, and external sensor connection for measurement and control |
| Deuterium Oxide | Cambridge Isotopes Laboratories | DLM-4 | Deuterated water; Heavy water (D2O) (D, 99.9%) |
| Digital Semi-Microbalance | Mettler Toledo | MS105 | Semi-micro balance with 120 g capacity, 0.01 mg readability, high resolution weighing cell, ergonomic doors, and pipette-check application |
| Ethanol (molecular biology grade) | Sigma Aldrich | E7023 | 200 proof ethanol for molecular biology applications |
| Glass Pipets | VWR | 36360-536 | Disposable Soda Lime glass Pasteur pipets |
| Glass Vials | Thermo Scientific | B7990-1 | Borosilicate glass vials with PTFE/Silione septum caps |
| Lab grade freezer | Fisher Scientific | IU2886D | Ultra-low temprature freezer (-86 to -50 C) for long-term storage of lipids and proteins |
| Lipids (protaited or perdeuterated) | Avanti Polar Lipids | varies by lipid | Lipids can be purchased from Avanti in powder form or in a chloroform solution with the required amounts and deuteration schemes. |
| Millipore water purifier | Millipore Sigma | ZRQSVP3US | Direct-Q® 3 UV Water Purification System which deliver both pure and ultrapure water with a built-in UV lamp to reduce the levels of organics for biological applications |
| Mini Extruder Set | Avanti Polar Lipids | 610020 | Mini-extruder set includes mini-extruder, heating block, 2 GasTight Syringes, and 2 O-rings, Polycarbonate Membranes, and Filter Supports |
| Quick Connect Fittings | Grainger | 2YDA1 and 2YDA7 | Push-button tube fittings for QuickConnect water circulation applications, e.g. high temperature vesicle extrusion |
| Syringe Pump | SyringePump.com | New Era-1000 | Fully programmable syringe pump for infusion and withdrawal; programs up to 41 pumping phases with adjustable pumping rates, dispensed volumes, and extrusion cycles |
| Ultrasonic bath | Fisher Scientific | CPX2800 | Temperature controlled ultra sonic bath with programmable functionality for degassing and ultrasonic applications |
| Vacuum Oven | Thermo Scientific | 3608 | 0.7 cu ft vaccum oven with built-in-high-limit thermostat guards against overheating |
| Vortex Mixer | Fisher Scientific | 02-215-414 | Variable speed, analog control that allows low rpm start-up for gentle shaking or high-speed mixing for vigorous vortexing of samples |
References
- Singer, S. J., Nicolson, G. L. The fluid mosaic model of the structure of cell membranes. Science. 175 (4023), 720-731 (1972).
- Andersen, O. S., Koeppe, R. E. Bilayer thickness and membrane protein function: an energetic perspective. Annual Review of Biophysics and Biomolecular Structure. 36, 107-130 (2007).
- Lundbæk, J. A., Collingwood, S. A., Ingólfsson, H. I., Kapoor, R., Andersen, O. S. Lipid bilayer regulation of membrane protein function: gramicidin channels as molecular force probes. Journal of The Royal Society Interface. 7 (44), 373-395 (2010).
- Bradley, R. P., Radhakrishnan, R. Curvature-undulation coupling as a basis for curvature sensing and generation in bilayer membranes. Proceedings of the National Academy of Sciences of the United States of America. 113 (35), 117-124 (2016).
- Perozo, E., Cortes, D. M., Sompornpisut, P., Kloda, A., Martinac, B. Open channel structure of MscL and the gating mechanism of mechanosensitive channels. Nature. 418 (6901), 942-948 (2002).
- Jensen, M. &. #. 2. 1. 6. ;., Mouritsen, O. G. Lipids do influence protein function-the hydrophobic matching hypothesis revisited. Biochimica et Biophysica Acta (BBA) - Biomembranes. 1666 (1-2), 205-226 (2004).
- Rajendran, L., Simons, K. Lipid rafts and membrane dynamics. Journal of Cell Science. 118 (6), 1099-1102 (2005).
- Katchalsky, A., Spangler, R. Dynamics of membrane processes. Quarterly Reviews of Biophysics. 1 (2), 127-175 (1968).
- Rheinstädter, M. C. Collective molecular dynamics in proteins and membranes (Review). Biointerphases. 3 (2), 83-90 (2008).
- Fujiwara, T., Ritchie, K., Murakoshi, H., Jacobson, K., Kusumi, A. Phospholipids undergo hop diffusion in compartmentalized cell membrane. The Journal of Cell Biology. 157 (6), 1071-1082 (2002).
- Hac, A. E., Seeger, H. M., Fidorra, M., Heimburg, T. Diffusion in two-component lipid membranes--a fluorescence correlation spectroscopy and monte carlo simulation study. Biophysical Journal. 88 (1), 317-333 (2005).
- Heinrich, M., Tian, A., Esposito, C., Baumgart, T. Dynamic sorting of lipids and proteins in membrane tubes with a moving phase boundary. Proceedings of the National Academy of Sciences of the United States of America. 107 (16), 7208-7213 (2010).
- Hormel, T. T., Kurihara, S. Q., Brennan, M. K., Wozniak, M. C., Parthasarathy, R. Measuring lipid membrane viscosity using rotational and translational probe diffusion. Physical Review Letters. 112 (18), 188101 (2014).
- Dimova, R. Recent developments in the field of bending rigidity measurements on membranes. Advances in Colloid and Interface Science. 208, 225-234 (2014).
- Bassereau, P., Sorre, B., Lévy, A. Bending lipid membranes: Experiments after W. Helfrich's model. Advances in Colloid and Interface Science. 208, 47-57 (2014).
- Monzel, C., Sengupta, K. Measuring shape fluctuations in biological membranes. Journal of Physics D: Applied Physics. 49 (24), 243002 (2016).
- Deserno, M. Mesoscopic membrane physics: concepts, simulations, and selected applications. Macromolecular Rapid Communications. 30 (9-10), 752-771 (2009).
- Reynwar, B. J., et al. Aggregation and vesiculation of membrane proteins by curvature-mediated interactions. Nature. 447 (7143), 461-464 (2007).
- Haswell, E. S., Phillips, R., Rees, D. C. Mechanosensitive channels: what can they do and how do they do it. Structure. 19 (10), 1356-1369 (2011).
- Phillips, R., Ursell, T., Wiggins, P., Sens, P. Emerging roles for lipids in shaping membrane-protein function. Nature. 459 (7245), 379-385 (2009).
- Dill, K. A., Chan, H. S. From Levinthal to pathways to funnels. Nature Structural Biology. 4 (1), 10-19 (1997).
- Henzler-Wildman, K., Kern, D. Dynamic personalities of proteins. Nature. 450 (7172), 964-972 (2007).
- Grimaldo, M., Roosen-Runge, F., Zhang, F., Schreiber, F., Seydel, T. Dynamics of proteins in solution. Quarterly Reviews of Biophysics. 52, 7 (2019).
- Lyman, E., Hsieh, C. -. L., Eggeling, C. From dynamics to membrane organization: experimental breakthroughs occasion a "modeling manifesto". Biophysical Journal. 115 (4), 595-604 (2018).
- Arriaga, L. R., et al. Dissipative curvature fluctuations in bilayer vesicles: Coexistence of pure-bending and hybrid curvature-compression modes. The European Physical Journal. E, Soft Matter. 31 (1), 105-113 (2010).
- Honerkamp-Smith, A. R., Veatch, S. L., Keller, S. L. An introduction to critical points for biophysicists; observations of compositional heterogeneity in lipid membranes. Biochimica et Biophysica Acta (BBA) - Biomembranes. 1788 (1), 53-63 (2009).
- Veatch, S. L., Keller, S. L. Organization in lipid membranes containing cholesterol. Physical Review Letters. 89 (26), 268101 (2002).
- Heberle, F. A., et al. Bilayer thickness mismatch controls domain size in model membranes. Journal of the American Chemical Society. 135 (18), 6853-6859 (2013).
- Nickels, J. D., et al. The in vivo structure of biological membranes and evidence for lipid domains. PLOS Biology. 15 (5), 2002214 (2017).
- Simons, K., Ikonen, E. Functional rafts in cell membranes. Nature. 387 (6633), 569-572 (1997).
- van Meer, G., Voelker, D. R., Feigenson, G. W. Membrane lipids: where they are and how they behave. Nature Reviews. Molecular Cell Biology. 9 (2), 112-124 (2008).
- Liu, S. -. L., et al. Orthogonal lipid sensors identify transbilayer asymmetry of plasma membrane cholesterol. Nature Chemical Biology. 13, 268 (2016).
- Rothman, J., Lenard, J. Membrane asymmetry. Science. 195 (4280), 743-753 (1977).
- Ashkar, R., et al. Neutron scattering in the biological sciences: progress and prospects. Acta Crystallographica Section D. 74 (12), 1129-1168 (2018).
- Woodka, A. C., Butler, P. D., Porcar, L., Farago, B., Nagao, M. Lipid bilayers and membrane dynamics: insight into thickness fluctuations. Physical Review Letters. 109 (5), 058102 (2012).
- Chakraborty, S., et al. How cholesterol stiffens unsaturated lipid membranes. Proceedings of the National Academy of Sciences of the United States of America. 117 (36), 21896-21905 (2020).
- Arriaga, L. R., et al. Stiffening effect of cholesterol on disordered lipid phases: a combined neutron spin echo + dynamic light scattering analysis of the bending elasticity of large unilamellar vesicles. Biophysical Journal. 96 (9), 3629-3637 (2009).
- Nagao, M., Kelley, E. G., Ashkar, R., Bradbury, R., Butler, P. D. Probing elastic and viscous properties of phospholipid bilayers using neutron spin echo spectroscopy. The Journal of Physical Chemistry Letters. 8 (19), 4679-4684 (2017).
- Kelley, E. G., Butler, P. D., Ashkar, R., Bradbury, R., Nagao, M. Scaling relationships for the elastic moduli and viscosity of mixed lipid membranes. Proceedings of the National Academy of Sciences of the United States of America. 117 (38), 23365-23373 (2020).
- Rickeard, B. W., et al. Transverse lipid organization dictates bending fluctuations in model plasma membranes. Nanoscale. 12 (3), 1438-1447 (2020).
- Nickels, J. D., et al. Mechanical properties of nanoscopic lipid domains. Journal of the American Chemical Society. 137 (50), 15772-15780 (2015).
- Mezei, F. Neutron spin echo: A new concept in polarized thermal neutron techniques. Zeitschrift für Physik A Hadrons and Nuclei. 255 (2), 146-160 (1972).
- Hayter, J. B., Penfold, J. Neutron spin-echo integral transform spectroscopy. Zeitschrift für Physik B Condensed Matter. 35 (2), 199-205 (1979).
- Monkenbusch, M., Richter, D., Imae, T., Kanaya, T., Furusaka, M., Torikai, N. . Neutrons in Soft Matter. , 147-182 (2011).
- Pynn, R., Mezei, F., Pappas, C., Gutberlet, T. . Neutron Spin Echo. , 159-177 (2003).
- Holderer, O., et al. The JCNS neutron spin-echo spectrometer J-NSE at the FRM II. Measurement Science and Technology. 19 (3), 034022 (2008).
- Schleger, P., et al. The long-wavelength neutron spin-echo spectrometer IN15 at the Institut Laue-Langevin. Physica B: Condensed Matter. 241-243, 164-165 (1997).
- Holderer, O., Zolnierczuk, P., Pasini, S., Stingaciu, L., Monkenbusch, M. A better view through new glasses: Developments at the Jülich neutron spin echo spectrometers. Physica B: Condensed Matter. 562, 9-12 (2019).
- Farago, B., et al. The IN15 upgrade. Neutron News. 26 (3), 15-17 (2015).
- Ashkar, R. Selective dynamics in polymeric materials: Insights from quasi-elastic neutron scattering spectroscopy. Journal of Applied Physics. 127 (15), 151101 (2020).
- Pasini, S., Holderer, O., Kozielewski, T., Richter, D., Phoenix Monkenbusch, M. J-NSE- Phoenix, a neutron spin-echo spectrometer with optimized superconducting precession coils at the MLZ in Garching. Review of Scientific Instruments. 90 (4), 043107 (2019).
- Svergun, D. I., Koch, M. H. J., Timmins, P. A., May, R. P. . Small Angle X-Ray and Neutron Scattering from Solutions of Biological Macromolecules. , (2013).
- Eicher, B., et al. Joint small-angle X-ray and neutron scattering data analysis of asymmetric lipid vesicles. Journal of Applied Crystallography. 50 (2), 419-429 (2017).
- Heberle, F. A., et al. Model-based approaches for the determination of lipid bilayer structure from small-angle neutron and X-ray scattering data. European Biophysics Journal. 41 (10), 875-890 (2012).
- Jaksch, S., Koutsioubas, A., Mattauch, S., Holderer, O., Frielinghaus, H. Long-range excitations in phospholipid membranes. Chemistry and Physics of Lipids. 225, 104788 (2019).
- Jaksch, S., et al. Influence of ibuprofen on phospholipid membranes. Physical Review E. 91 (2), 022716 (2015).
- Armstrong, C. L., et al. Effect of cholesterol on the lateral nanoscale dynamics of fluid membranes. European Biophysics Journal. 41 (10), 901-913 (2012).
- Rheinstädter, M. C., Häußler, W., Salditt, T. Dispersion relation of lipid membrane shape fluctuations by neutron spin-echo spectrometry. Physical Review Letters. 97 (4), 048103 (2006).
- Armstrong, C. L., Häußler, W., Seydel, T., Katsaras, J., Rheinstädter, M. C. Nanosecond lipid dynamics in membranes containing cholesterol. Soft Matter. 10 (15), 2600-2611 (2014).
- Nickels, J. D., et al. Lipid rafts: buffers of cell membrane physical properties. The Journal of Physical Chemistry B. 123 (9), 2050-2056 (2019).
- Michonova-Alexova, E. I., Sugár, I. P. Component and state separation in DMPC/DSPC lipid bilayers: a Monte Carlo simulation study. Biophysical Journal. 83 (4), 1820-1833 (2002).
- Sugár, I. P., Thompson, T. E., Biltonen, R. L. Monte Carlo simulation of two-component bilayers: DMPC/DSPC mixtures. Biophysical Journal. 76 (4), 2099-2110 (1999).
- Mabrey, S., Sturtevant, J. M. Investigation of phase transitions of lipids and lipid mixtures by sensitivity differential scanning calorimetry. Proceedings of the National Academy of Sciences. 73 (11), 3862-3866 (1976).
- . Neutron activation and scattering calculator Available from: https://www.ncnr.nist.gov/resources/activation/ (2021)
- Scott, H. L., et al. On the mechanism of bilayer separation by extrusion, or why your LUVs are not really unilamellar. Biophysical Journal. 117 (8), 1381-1386 (2019).
- Ashkar, R., et al. Tuning membrane thickness fluctuations in model lipid bilayers. Biophysical Journal. 109 (1), 106-112 (2015).
- Carrillo, J. -. M. Y., Katsaras, J., Sumpter, B. G., Ashkar, R. A computational approach for modeling neutron scattering data from lipid bilayers. Journal of Chemical Theory and Computation. 13 (2), 916-925 (2017).
- Azuah, R. T. DAVE: a comprehensive software suite for the reduction, visualization, and analysis of low energy neutron spectroscopic data. Journal of Research of the National Institute of Standards and Technology. 114 (6), 341-358 (2009).
- Van Hove, L. Correlations in space and time and born approximation scattering in systems of interacting particles. Physical Review. 95 (1), 249-262 (1954).
- Zilman, A. G., Granek, R. Undulations and dynamic structure factor of membranes. Physical Review Letters. 77 (23), 4788-4791 (1996).
- Kelley, E. G., Butler, P. D., Nagao, M. . Collective dynamics in model biological membranes measured by neutron spin echo spectroscopy. , 131-176 (2019).
- Zheng, Y., Michihiro, N., Dobrin, P. B. Bending elasticity of saturated and monounsaturated phospholipid membranes studied by the neutron spin echo technique. Journal of Physics: Condensed Matter. 21 (15), 155104 (2009).
- Sharma, V. K., Qian, S. Effect of an antimicrobial peptide on lateral segregation of lipids: a structure and dynamics study by neutron scattering. Langmuir. 35 (11), 4152-4160 (2019).
- Boggara, M. B., Faraone, A., Krishnamoorti, R. Effect of pH and Ibuprofen on the Phospholipid Bilayer Bending Modulus. The Journal of Physical Chemistry B. 114 (24), 8061-8066 (2010).
- Lee, J. -. H., et al. Thermal fluctuation and elasticity of lipid vesicles interacting with pore-forming peptides. Physical Review Letters. 105 (3), 038101 (2010).
- Chakraborty, S., Abbasi, A., Bothun, G. D., Nagao, M., Kitchens, C. L. Phospholipid bilayer softening due to hydrophobic gold nanoparticle inclusions. Langmuir. 34 (44), 13416-13425 (2018).
- Hoffmann, I., et al. Softening of phospholipid membranes by the adhesion of silica nanoparticles - as seen by neutron spin-echo (NSE). Nanoscale. 6 (12), 6945-6952 (2014).
- Watson, M. C., Brown, F. L. H. Interpreting membrane scattering experiments at the mesoscale: the contribution of dissipation within the bilayer. Biophysical Journal. 98 (6), 9-11 (2010).
- Seifert, U., Langer, S. A. Viscous modes of fluid bilayer membranes. Europhysics Letters (EPL). 23 (1), 71-76 (1993).
- Bingham, R. J., Smye, S. W., Olmsted, P. D. Dynamics of an asymmetric bilayer lipid membrane in a viscous solvent. EPL (Europhysics Letters). 111 (1), 18004 (2015).
- Rawicz, W., Olbrich, K. C., McIntosh, T., Needham, D., Evans, E. Effect of chain length and unsaturation on elasticity of lipid bilayers. Biophysical Journal. 79 (1), 328-339 (2000).
- Doktorova, M., LeVine, M. V., Khelashvili, G., Weinstein, H. A new computational method for membrane compressibility: bilayer mechanical thickness revisited. Biophysical Journal. 116 (3), 487-502 (2019).
- Evans, E., Needham, D. Physical properties of surfactant bilayer membranes: thermal transitions, elasticity, rigidity, cohesion and colloidal interactions. The Journal of Physical Chemistry. 91 (16), 4219-4228 (1987).
- Lesieur, S., Grabielle-Madelmont, C., Paternostre, M. T., Ollivon, M. Size analysis and stability study of lipid vesicles by high-performance gel exclusion chromatography, turbidity, and dynamic light scattering. Analytical Biochemistry. 192 (2), 334-343 (1991).
- Heberle, F. A., et al. Direct label-free imaging of nanodomains in biomimetic and biological membranes by cryogenic electron microscopy. Proceedings of the National Academy of Sciences of the United States of America. 117 (33), 19943-19952 (2020).
- Cornell, C. E., Mileant, A., Thakkar, N., Lee, K. K., Keller, S. L. Direct imaging of liquid domains in membranes by cryo-electron tomography. Proceedings of the National Academy of Sciences of the United States of America. 117 (33), 19713-19719 (2020).
- Yao, X., Fan, X., Yan, N. Cryo-EM analysis of a membrane protein embedded in the liposome. Proceedings of the National Academy of Sciences of the United States of America. 117 (31), 18497-18503 (2020).
- Kučerka, N., Nieh, M. -. P., Katsaras, J. Fluid phase lipid areas and bilayer thicknesses of commonly used phosphatidylcholines as a function of temperature. Biochimica et Biophysica Acta (BBA) - Biomembranes. 1808 (11), 2761-2771 (2011).
- Nielsen, J. E., Bjørnestad, V. A., Lund, R. Resolving the structural interactions between antimicrobial peptides and lipid membranes using small-angle scattering methods: the case of indolicidin. Soft Matter. 14 (43), 8750-8763 (2018).
- Kučerka, N., et al. Lipid bilayer structure determined by the simultaneous analysis of neutron and X-ray scattering data. Biophysical Journal. 95 (5), 2356-2367 (2008).
- Kelley, E. G., Butler, P. D., Nagao, M. Scaling of lipid membrane rigidity with domain area fraction. Soft Matter. 15 (13), 2762-2767 (2019).
- Brüning, B. -. A., et al. Bilayer undulation dynamics in unilamellar phospholipid vesicles: Effect of temperature, cholesterol and trehalose. Biochimica et Biophysica Acta (BBA) - Biomembranes. 1838 (10), 2412-2419 (2014).
- Kučerka, N., et al. Areas of monounsaturated diacylphosphatidylcholines. Biophysical Journal. 97 (7), 1926-1932 (2009).
- Sharma, V. K., Mamontov, E., Anunciado, D. B., O'Neill, H., Urban, V. S. Effect of antimicrobial peptide on the dynamics of phosphocholine membrane: role of cholesterol and physical state of bilayer. Soft Matter. 11 (34), 6755-6767 (2015).
- Kelley, E. G., Butler, P. D., Nagao, M. Collective dynamics in lipid membranes containing transmembrane peptides. Soft Matter. , (2021).
- Yu, J., et al. Structure and dynamics of lipid membranes interacting with antivirulence end-phosphorylated polyethylene glycol block copolymers. Soft Matter. 16 (4), 983-989 (2020).
- Stingaciu, L. -. R., et al. Revealing the dynamics of thylakoid membranes in living cyanobacterial cells. Scientific Reports. 6 (1), 19627 (2016).
- Stingaciu, L. -. R., O'Neill, H. M., Liberton, M., Pakrasi, H. B., Urban, V. S. Influence of chemically disrupted photosynthesis on cyanobacterial thylakoid dynamics in synechocystis sp. PCC 6803. Scientific Reports. 9 (1), 5711 (2019).
- Miller, I. R. Energetics of fluctuation in lipid bilayer thickness. Biophysical Journal. 45 (3), 643-644 (1984).
- Nagao, M. Observation of local thickness fluctuations in surfactant membranes using neutron spin echo. Physical Review E. 80 (3), 031606 (2009).
Erratum
Formal Correction: Erratum: Neutron Spin Echo Spectroscopy as a Unique Probe for Lipid Membrane Dynamics and Membrane-Protein Interactions
Posted by JoVE Editors on 8/06/2021. Citeable Link.
An erratum was issued for: Neutron Spin Echo Spectroscopy as a Unique Probe for Lipid Membrane Dynamics and Membrane-Protein Interactions. The Introduction, Protocol, and Representative Results sections have been updated.
In the Introduction, the fith pargraph was updated from:
Besides direct access to the length and time scale of membrane dynamics, NSE has the inherent capabilities of neutron isotope sensitivity52. Specifically, the ability of neutrons to interact differently with the isotopes of hydrogen, the most abundant element in biological systems, results in a different neutron scattering length density,34 or NSLD (the equivalent of the optical index of refraction50), when protium is substituted by deuterium. This enables an approach known as contrast variation, which is commonly used to highlight specific membrane features or conceal others — the latter scenario is referred to as contrast matching. A frequent application of contrast variation/matching is the substitution of water (NSLD = -0.56 × 10⁻⁶ Å-2) by heavy water or D2O (NSLD = 6.4 × 10⁻⁶ Å-2) to amplify the neutron signal from protiated lipid membranes (NSLD ~ 2 × 10⁻⁶ Å-2). This approach is highly effective in studies of membrane structure because the penetration of D2O into the headgroup region of the membrane allows accurate determination of the membrane thicknesses (see Figure 2A, left panel) and of the location of different lipid subgroups when more sophisticated models are applied53,54. This paper highlights some examples on the use of contrast variation for studies of collective dynamics in biomimetic membranes and select membrane features.
to:
Besides direct access to the length and time scale of membrane dynamics, NSE has the inherent capabilities of neutron isotope sensitivity52. Specifically, the ability of neutrons to interact differently with the isotopes of hydrogen, the most abundant element in biological systems, results in a different neutron scattering length density,34 or NSLD (the equivalent of the optical index of refraction50), when protium is substituted by deuterium. This enables an approach known as contrast variation, which is commonly used to highlight specific membrane features or conceal others — the latter scenario is referred to as contrast matching. A frequent application of contrast variation/matching is the substitution of water (NSLD = -0.56 × 10⁻⁶ Å-2) by heavy water or D2O (NSLD = 6.4 × 10⁻⁶ Å-2) to amplify the neutron signal from protiated lipid membranes (NSLD ~ 0 × 10-6 Å-2). This approach is highly effective in studies of membrane structure because the penetration of D2O into the headgroup region of the membrane allows accurate determination of the membrane thicknesses (see Figure 2A, left panel) and of the location of different lipid subgroups when more sophisticated models are applied53,54. This paper highlights some examples on the use of contrast variation for studies of collective dynamics in biomimetic membranes and select membrane features.
In the Protocol, step 1.1 was updated from:
For bending fluctuation measurements, make fully protiated liposomes in D2O (D 99.9%) or D2O-buffer (e.g., phosphate buffer prepared with D2O instead of H2O). Use fully protiated DMPC (C36H72NO8P) and DSPC (C44H88NO8P) with 133.4 mg, where XDMPC and XDSPC are the mole fractions of DMPC and DSPC, here set to 0.7 and 0.3, respectively, and MwDMPC and MwDSPC are the molar weights given by 677.9 g/mol and 790.1 g/mol, respectively. Similarly, mDSPC = 66.6 mg. This deuteration scheme increases the scattering contrast between the membrane (NSLD ~ 2 × 10⁻⁶ Å-2) and the deuterated buffer (NSLD ~ 6.4 × 10⁻⁶ Å-2) and amplifies the signal from membrane undulations (see Figure 2A left panel).
to:
For bending fluctuation measurements, make fully protiated liposomes in D2O (D 99.9%) or D2O-buffer (e.g., phosphate buffer prepared with D2O instead of H2O). Use fully protiated DMPC (C36H72NO8P) and DSPC (C44H88NO8P) with 133.4 mg, where XDMPC and XDSPC are the mole fractions of DMPC and DSPC, here set to 0.7 and 0.3, respectively, and MwDMPC and MwDSPC are the molar weights given by 677.9 g/mol and 790.1 g/mol, respectively. Similarly, mDSPC = 66.6 mg. This deuteration scheme increases the scattering contrast between the membrane (NSLD ~ 0 × 10-6 Å-2) and the deuterated buffer (NSLD ~ 6.4 × 10⁻⁶ Å-2) and amplifies the signal from membrane undulations (see Figure 2A left panel).
In the Representative Results, the fist pagargaph was updted from:
NSE studies accessing bending fluctuations are typically performed over a Q-range of ~ (0.04 - 0.2) Å-1. This Q-range corresponds to intermediate length scales between the membrane thickness and the liposomal radius, where bending dynamics dominate. Measurement over an extended Q-range can give access to additional dynamic modes, including liposomal diffusion and intramembrane dynamics. For more details on the cross-over in membrane dynamics accessed by NSE, check these relevant publications25,71. It is important to emphasize that NSE signals are proportional to: 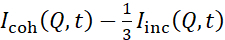 , where Icoh and Iinc are, respectively, the coherent and incoherent scattering intensity from the sample. Therefore, it is advisable to prepare NSE liposomal samples in deuterated buffers (i.e., buffers prepared with D2O instead of H2O) to minimize the incoherent scattering signal, mainly contributed by the hydrogen content of the sample. However, in some cases intermediate deuteration schemes (i.e., using mixtures of D2O and H2O) might be necessary to obtain optimal contrast conditions. Typically, NSE measurements of membrane bending fluctuations are performed on fully protiated liposomes in deuterated buffer, referred to as fully contrasted liposomes in Figure 5. This deuteration scheme results in a large NSLD difference between the membrane core (~2 × 10⁻⁶ Å-2) and its deuterated fluid environment (~6.4 × 10⁻⁶ Å-2), which significantly enhances the scattering signal from the liposomal membranes and improves the measurement statistics of bending dynamics. This contrast scheme (Figure 2A left panel) is frequently utilized in studies of bending rigidity of lipid membranes with single38,72 and multiple39,66 lipid components and in studies of membrane softening/stiffening by biological inclusions (e.g., cholesterol, drug molecules, peptides/proteins)36,37,73,74,75, and synthetic additives (e.g., nanoparticles)76,77.
to:
NSE studies accessing bending fluctuations are typically performed over a Q-range of ~ (0.04 - 0.2) Å-1. This Q-range corresponds to intermediate length scales between the membrane thickness and the liposomal radius, where bending dynamics dominate. Measurement over an extended Q-range can give access to additional dynamic modes, including liposomal diffusion and intramembrane dynamics. For more details on the cross-over in membrane dynamics accessed by NSE, check these relevant publications25,71. It is important to emphasize that NSE signals are proportional to: , where Icoh and Iinc are, respectively, the coherent and incoherent scattering intensity from the sample. Therefore, it is advisable to prepare NSE liposomal samples in deuterated buffers (i.e., buffers prepared with D2O instead of H2O) to minimize the incoherent scattering signal, mainly contributed by the hydrogen content of the sample. However, in some cases intermediate deuteration schemes (i.e., using mixtures of D2O and H2O) might be necessary to obtain optimal contrast conditions. Typically, NSE measurements of membrane bending fluctuations are performed on fully protiated liposomes in deuterated buffer, referred to as fully contrasted liposomes in Figure 5. This deuteration scheme results in a large NSLD difference between the membrane core (~0 × 10-6 Å-2) and its deuterated fluid environment (~6.4 × 10⁻⁶ Å-2), which significantly enhances the scattering signal from the liposomal membranes and improves the measurement statistics of bending dynamics. This contrast scheme (Figure 2A left panel) is frequently utilized in studies of bending rigidity of lipid membranes with single38,72 and multiple39,66 lipid components and in studies of membrane softening/stiffening by biological inclusions (e.g., cholesterol, drug molecules, peptides/proteins)36,37,73,74,75, and synthetic additives (e.g., nanoparticles)76,77.
In the Representative Reults, Figure 2 was updated from:

Figure 2: Examples of possible deuteration schemes in NSE experiments on lipid membranes. (A) Left: Fully contrasted membranes, e.g., protiated membranes in deuterated buffer, showing the NSLD profile along the normal to the membrane surface. The difference in the NSLD between the headgroup (~2 × 10⁻² Å-2) and tail region (~4.5 × 10⁻⁶ Å-2) of the membrane is due to the headgroup hydration with deuterated buffer. Right: Tail-contrast matched membranes such that the hydrocarbon tail region of the membrane has the same NSLD as the buffer, as shown in the corresponding NSLD profile along the membrane normal. (B) Domain-forming membranes with two neutron contrast schemes where the domains (center) or the matrix (left) are contrast-matched to the buffer, enabling selective studies of matrix or domain dynamics, respectively. This figure has been modified from Nickels et al., JACS 201541. (C) Asymmetric membranes prepared by cyclodextrin exchange between protiated and deuterated lipid vesicles, resulting in the deuteration of one membrane leaflet while keeping the other leaflet protiated. This allows studies of the bending dynamics of the protiated leaflet and provides insights into the mechanical coupling between opposing leaflets in asymmetric membranes. This figure has been modified from Rickeard et al., Nanoscale 202040. Please click here to view a larger version of this figure.
to:

Figure 2: Examples of possible deuteration schemes in NSE experiments on lipid membranes. (A) Left: Fully contrasted membranes, e.g., protiated membranes in deuterated buffer, showing the NSLD profile along the normal to the membrane surface. The difference in the NSLD between the tail region (~0 × 10-2 Å-2) and headgroup region (~4.5 × 10⁻⁶ Å-2) of the membrane is due to the headgroup hydration with deuterated buffer. Right: Tail-contrast matched membranes such that the hydrocarbon tail region of the membrane has the same NSLD as the buffer, as shown in the corresponding NSLD profile along the membrane normal. (B) Domain-forming membranes with two neutron contrast schemes where the domains (center) or the matrix (left) are contrast-matched to the buffer, enabling selective studies of matrix or domain dynamics, respectively. This figure has been modified from Nickels et al., JACS 201541. (C) Asymmetric membranes prepared by cyclodextrin exchange between protiated and deuterated lipid vesicles, resulting in the deuteration of one membrane leaflet while keeping the other leaflet protiated. This allows studies of the bending dynamics of the protiated leaflet and provides insights into the mechanical coupling between opposing leaflets in asymmetric membranes. This figure has been modified from Rickeard et al., Nanoscale 202040. Please click here to view a larger version of this figure.
Reprints and Permissions
Request permission to reuse the text or figures of this JoVE article
Request PermissionExplore More Articles
This article has been published
Video Coming Soon
Copyright © 2025 MyJoVE Corporation. All rights reserved