Method Article
ハイスループット免疫磁気ビーズ分離 による バフィーコートからのヒト末梢血単核細胞の単離
要約
このプロトコルは、バイオバンキングやその他の目的でヒト末梢血単核細胞を単離するためのハイスループット自動化互換の方法を詳述しています。
要約
末梢血単核細胞(PBMC)は、単球とリンパ球の不均一な集団です。凍結保存されたPBMCは、長期保存で安定した生存率を示しており、フローサイトメトリー、イムノアッセイ、ゲノムシーケンシングなど、多くのダウンストリーム研究目的に理想的な細胞タイプとなっています。通常、PBMCは密度勾配遠心分離 によって単離されますが、これはロースループットのワークフローであり、スケーリングが困難でコストがかかります。この記事では、マグネティックビーズベースのPBMCアイソレーション法を使用したハイスループットワークフローを紹介します。密度勾配単離を使用して得られたPBMCによる全細胞濃度、生存率、および集団分布を比較し、細胞生存率と細胞タイプの割合は両方の技術で同等でした。単離されたPBMCは、採血後9日まで70%以上の生存率を示しましたが、採血から24時間以内に処理されたPBMCと比較して、5日後に収量は半分に減少しました。要約すると、この記事では、ビーズベースのアプローチを利用してハイスループットワークフローに適応するPBMCプロトコルについて説明し、手動と自動の両方のビーズベースの方法が処理能力を向上させ、さまざまな予算に柔軟に対応できることを実証しています。
概要
末梢血単核細胞(PBMC)単離は、リンパ球と単球を他の全血成分から分離して分離する技術です。PBMCは、免疫療法、ワクチン開発、標的またはバイオマーカーの同定、抗体/低分子医薬品開発1,2など、さまざまなアプリケーションに使用される汎用性の高い細胞タイプです。これらの細胞は、健康な人や病気の人から単離することができ、下流のプロセスですぐに使用したり、将来の研究のために凍結保存したりできます3。場合によっては、ダウンストリームの目的がわかっている場合もあれば、バイオバンキングで一般的なように、PBMCが分離され、将来の不特定のアプリケーションのために保存される場合もあります4。
密度勾配遠心分離は、全血からPBMC5,6,7を単離するための伝統的な技術であり、遠心分離中の細胞密度に基づく構成細胞タイプの差動分離を利用します。この方法には多少のバリエーションがありますが、全血は通常、リン酸緩衝生理食塩水(PBS)で希釈し、特殊または標準的な遠心チューブ内の密度勾配培地に重ね合わせてから、遠心します。その結果、最上層の血漿層には血小板が豊富に、薄いPBMC層は密度勾配培地の上にあり、最後に最下層は赤血球(RBC)と顆粒球で構成されています。この方法は、以前は「ゴールドスタンダード」8と呼ばれていましたが、スケールアップには、処理時間が長い、遠心分離機の容量がある、他の血液製剤(血漿やRBCなど)を分注するのが難しい、自動化に手間がかかるなどの制限があります。この方法9では自動化が可能ですが、液体ハンドラーの包括的なプログラミング(遠心分離モジュールを完全に自動化する)が必要であり、長いプロセスのままです。
以下では、8ホルダー磁石による免疫磁気ビーズ分離による手動処理または完全自動処理のための装置を使用する代替ワークフローを紹介します。この方法では、抗体カクテルを細胞に添加し、不要な細胞集団(この場合は血小板、顆粒球、赤血球)に結合します。これらの不要な集団は、その後、磁気分離によって除去され、単球およびリンパ球の集団が負の画分に残り、下流の処理の準備ができている10。このネガティブセレクション法は、PBMCから抗体および磁気ビーズ複合体を除去するために追加のステップを必要とするポジティブセレクション法よりも迅速である。ネガティブセレクションは、細胞機能を保持する方法として説明されている11,12として、さらに有利である。
プロトコル
品質管理された血液検体と自社生成データ(細胞数、生存率、処理時の検体の年齢など)は、NSW Health Statewide Biobank, Royal Prince Alfred Hospital(HREC承認:2019/ETH06776)の同意された研究から取得されました。処理された(すなわち、血漿が枯渇した)、スクリーニングされていない、および匿名化された成人ヒト血液サンプルをEDTAチューブに収集しました。これらの品質管理血液検体は、採取後72時間未満で処理され、密度勾配とビーズベースの方法を比較するPBMC単離実験に使用されました。代表的な結果で用いられた密度勾配分離法については、 補足ファイル1の手順を参照してください。本試験に使用した試薬および機器の詳細は、 資料表に記載されています。
1.全血の準備
- 10 mLの全血チューブ(エチレンジアミン四酢酸[EDTA]、酸-クエン酸-デキストロース[ACD]、またはヘパリンリチウムでコーティング)を室温で10回静かに反転させます。.
- オプション:全血を保存する場合は、-80°Cで保存するためにクライオチューブに分注します。
- スイングバケットローターを使用して、ブレーキをオンにした状態で22°Cで10分間遠心分離します(加速9回/ 減速9回)。
2.バフィーコートコレクション
- 遠心分離後、サンプルを生物学的安全キャビネットに入れ、3つの異なる層を確認します( 図1を参照)。
注:RBCは、遠心分離管の下部の暗赤色の層にあります。白血球と血小板を含む白色の不透明な層は、バフィーコートとして知られるRBC層の上にあります。一番上の黄色の層にはプラズマが含まれています。 - オプション:プラズマを保存する場合は、プラズマをクライオチューブに分注して-80°Cで保存します。
- 10 mLの血液チューブから1 mLのバフィーコート(出発物質)をピペットで移し、手動および自動の方法についてそれぞれステップ3.1およびステップ4.1で指定およびラベル付けされたチューブに移します。ピペットの先端でバフィーコート(白い不透明層)を渦巻き、吸引してバフィーコートを集めます。
注:吸引中は100μL未満の血漿およびRBCが許容されます。1人の参加者に対して複数の血液チューブを採取する場合は、バフィーコートをプールすることができます。ただし、これは血小板濃度に影響を与える可能性がある13。 - 手動処理の場合は、セクション 3 に進みます。自動処理の場合は、セクション 4 に進みます。
- オプション:赤血球を保存する場合は、赤血球をクライオチューブに分注して-80°Cで保存します。
3. PBMCの浄化 - 手動による方法
注:マグネットホルダー1個につき最大8個のサンプルを1人のオペレーターで処理できます。
- 3 x 5 mLポリスチレンチューブにA-Cの文字でラベルを付けます。
注:1A、1B、1C、2A、2B、2Cなど、複数のサンプルを実行する場合は、連番を使用します。 - ステップ 2.3 で移したバフィーコートを封入したチューブ A に 60 μL の 0.1 M EDTA (最終 EDTA 濃度 6 mM、pH 8.0 の場合、レシピは 補足ファイル 2 を参照) を加えます。
- カクテルミックスチューブ50μL( 材料表を参照)をチューブAに加え、ピペッティングで3回以上上下させて混合し、室温で5分間インキュベートします。
- チューブAに890μLのPBSを加え、ピペッティングで3回以上上下させて混合します。
- 磁気ビーズチューブ(材料の表を参照)を30秒間ボルテックスします。
- チューブAに50μLの磁気ビーズを加え、ピペッティングで3回以上上下させて混合します。
- すぐにチューブAをマグネットスタンドに入れ、室温で5分間インキュベートします。
- 濃縮した細胞懸濁液をチューブBに慎重にピペットで移し、赤血球なし/最小(<100 μL)の赤血球を含む透明な画分を回収して、最適なPBMC回収を実現します。
注意: 磁石に結合されたビーズを邪魔しないでください。トランスファーピペットをお勧めします。 - チューブAをマグネットスタンドから取り外して廃棄します。
- チューブBの細胞懸濁液に50μLの磁気ビーズを加え、ピペッティングで3回以上上下させて混合します。
- すぐにチューブBをマグネットスタンドに入れ、室温で5分間インキュベートします。
- 濃縮された細胞懸濁液をチューブCに慎重にピペットで移し、透明な画分のみを回収します。
注意: 磁石に結合されたビーズを邪魔しないでください。トランスファーピペットをお勧めします。 - チューブBをマグネットスタンドから取り外して廃棄します。
- すぐにチューブCをマグネットスタンドに入れ、室温で5分間インキュベートします。
- 濃縮した細胞懸濁液を標識された遠心チューブに慎重にピペットで移し、PBSを最大2 mLまで補充します。
- 細胞懸濁液50μLを全自動セルカウンターのサンプルカップに移します。1:10の希釈細胞数を得るには、450 μLのPBSを添加します。セルカウントステップのセクション5に進みます。
4. PBMC精製 - 自動メソッド
注: 1台の自動PBMC装置で最大4つのサンプルを処理できます。1人のオペレーターが複数の機器を並行して実行できます。
- 14 mLチューブ2本にAおよびBの文字を、50 mL遠心チューブ1本(Cの文字)を、50 mL遠心チューブ1本に「廃棄物」のラベルを貼ります。
注:自動PBMC装置での実行ごとに必要な廃棄物容器は1つだけです。1A、1B、1C、2A、2B、2Cなど、複数のサンプルを実行する場合は、連番を使用します。 - ステップ2.3で移したバフィーコートを含むチューブAに、0.1 M EDTA(最終EDTA濃度6 mMの場合)60 μLを加えます。
- 磁気ビーズチューブをボルテックスします(材料の表を参照) 30秒間。
- 自動PBMC装置の前面で電源を入れて、自動PBMC装置の電源を入れます。
- 自動PBMC装置のホーム画面で、 プロファイル を選択し、目的のプロトコルを選択します。
注: EasySep Direct Human PBMC isolation 19654 - buffy coat は、このPBMC分離のために選択されたプロトコルプロファイルでした。このプロファイルに関する製造元の標準手順については、プロトコルレポート14を参照してください。 - 開始容量(チューブAに吸引されるバフィーコートの量)を入力し、サンプルごとに繰り返します。
- 同じ試薬キットを使用するすべての象限を選択します。
注:同じプロトコルが複数の象限に使用される場合、自動化されたPBMC装置は、すべての象限14に同じ試薬キットを使用することを提案します。 - 装置のカルーセルに、ラベル付きの消耗品、フィルターチップ、バッファー容器をセットします。磁気ビーズチューブとカクテルミックスチューブを含む試薬キットは、象限1にロードします。
注:装置は、ユーザーがすべての象限に1つの試薬キットを使用することを希望するかどうかを尋ねます。「はい」を選択し、試薬キットを使用してすべての象限を強調表示します。 - ローディングが完了したら、消耗品と試薬から蓋を取り外し、装置画面で[実行]を選択します。
- 実行が完了したら、アン ロード を選択し、サンプル(チューブCにラベル付けされたPBMC懸濁液を含む)を装置のカルーセルから取り出します。磁気ビーズチューブ、カクテルミックスチューブ、およびバッファー容器は4°Cで保管します。 A、B、および廃棄物(手順4.1を参照)とフィルターチップのラベルが付いたチューブを廃棄します。
注:PBMC懸濁液は最終容量7 mLを生成するため、自動分析法ではPBSを補充する必要はありません。 - 500 μLの細胞をサンプルカップに移し、希釈なしの細胞数にします。セルカウントのセクション5に進みます。
5. 細胞計数
- 製造元の指示に従って、トリパンブルー色素排除法を使用して細胞のカウントと生存率を実行します15。
注:著者の内部プロセスについては、PBMCを取得するために、以下の設定で自動セルカウンターを使用して細胞解析を行います。
希釈係数 = 10 (手動プロトコルの場合、細胞懸濁液が少量の場合) または 1 (自動プロトコルの場合)
細胞タイプ:PBMC
濃度範囲 = 5 x 10⁴ から 1 x 10⁷ 細胞/mL
サイズ範囲(直径)= 8μm〜50μm
画像の数 = 50
6. 凍結保存の準備
- ブレーキをONにした状態で、サンプルチューブを300 x g で22°Cで8分間遠心分離(スイングバケットローターを使用)します(加速9回/ 減速9回)。
- 遠心分離後、サンプルを生物学的安全キャビネットに戻します。
- ピペットを使用して、上清を慎重に取り除きます。PBMCペレットに少量の上清を残して、邪魔されないようにすることができます。
- ペレットを3 mLの冷冷凍結保存培地に再懸濁します。懸濁液をゆっくりと穏やかに上下に混合し、均一になるまで混ぜます。
注:cyropreservation mediumの容積は望ましい最終的なPBMCの集中に基づいて調節することができる。 - 再懸濁したPBMC1 mLをあらかじめ割り当てられたクライオチューブに分注し、制御速度凍結容器内に-80°Cで最低4時間置きます。
注:各クライオチューブに分注されるPBMCの量は、研究者の好みに基づいて調整できます。 - クライオチューブを-80°Cで最低4時間保存した後、クライオチューブを液体窒素気相タンクに移して長期保存します。
7. 統計データ解析
- 代表的な結果データは、 補足ファイル3に規定されている統計およびグラフ作成ソフトウェアを使用して分析されました。
結果
リンパ球、単球、好中球、好酸球、および好塩基球の割合を、PBMC前(すなわち、全血中)およびPBMC後の単離で、ビーズベースまたは密度勾配分離法を使用してPBMCを単離したときに測定しました。リンパ球と単球の割合は、両方の方法によって有意に濃縮されました(図2A、B)。さらに、ビーズベースの方法で単離されたPBMCでは、好中球、好酸球、および好塩基球(顆粒球)の割合が有意に減少しました(図2C-F)。密度勾配法とビーズ法の間で、リンパ球、単球、好中球、好酸球、好塩基球、および顆粒球の割合に有意差はありませんでした(図2)。上記の細胞タイプについて、回収率を追加で計算しました(補足図1を参照)。平均細胞生存率は両分析法で95%を超え、有意差はありませんでした(図3A)。PBMCも8 μmから50 μmのサイズ範囲(直径)を使用してカウントしましたが、密度勾配分離法では約2倍の総細胞数が得られました(図3B)。
次に、自動ビーズベースの方法と手動の方法を比較しました。手動または自動の方法を使用した場合、細胞生存率(図4A)または総細胞数(図4B)に有意差は認められませんでした。これらの 8 つのサンプルを処理する時間を比較しました。これには、人間の介入を必要としないハンズオフ時間も含まれます。8サンプルの合計処理時間は43分 対でした。マニュアルと57分 vs.自動化された方法。自動化された方法には、35 分間のハンズオフ処理が含まれていました(図 4C)。
PBMC単離のビーズベースのワークフロー(全血と血漿分注を含む)は9か月にわたって試験的に実施され、最初の820人の参加者に対して手動プラットフォームを使用して、次の590人の参加者に対して自動化された方法を使用して、スクリーニングされていないヒト血液から1410のPBMCサンプルが分離されました。処理は、研究の受け入れ基準に従って、収集日当日または収集後最大10日以内に行われましたが、主にサンプルの通過時間により処理が遅れました。手動分析法または自動分析法のいずれにおいても、採取から 24 時間以内に処理された PBMC の生存率と回収率が最も高いことがわかりました(図 5)。平均細胞生存率は、5日以内に処理されたPBMCで>90%、10日以内に処理されたPBMCで>70%でした(図5A)。PBMCの平均収量は、24時間以内に処理された検体と比較して、5日後に50%減少しました(図5B)。
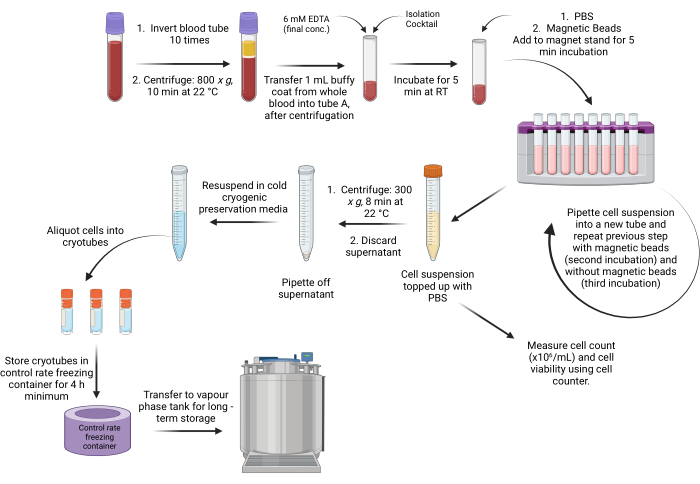
図1:Buffy CoatからのビーズベースのPBMC分離プロトコルの概略ワークフロー。この図の拡大版を表示するには、ここをクリックしてください。
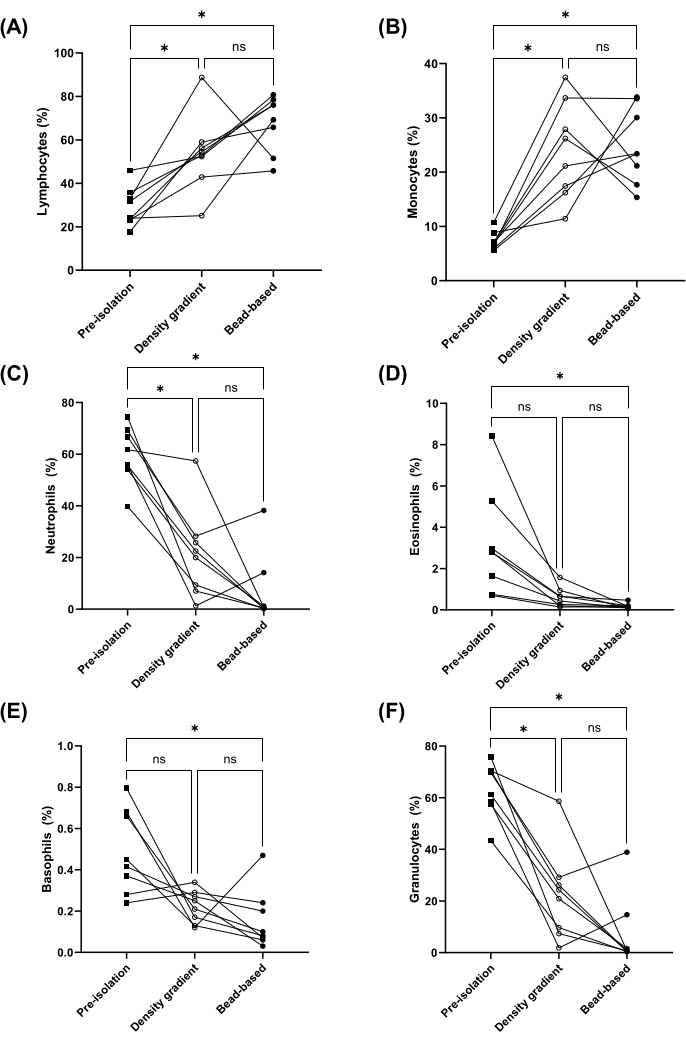
図2:密度勾配およびビーズベースの方法によるPBMC単離前後の全血中のリンパ球、単球、好中球、好酸球、好塩基球、および顆粒球の割合。一致した全血の PBMC 前単離 (正方形) と密度勾配 (白円) またはビーズベース (閉じ円) 法 (n = 8) による単離後の PBMC のリンパ球 (A)、単球 (B)、好中球 (C)、好酸球 (D)、好塩基球 (E)、および顆粒球 (F) の割合。ns = 有意ではなく<、一元配置分散分析 (A および B) またはフリードマン検定 (C-F)。この図の拡大版を表示するには、ここをクリックしてください。
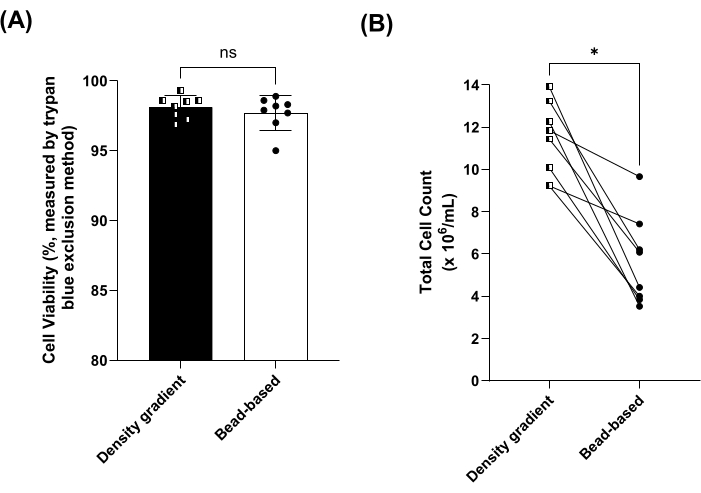
図3:密度勾配およびビーズベースの方法によって単離されたPBMCの生存率と総細胞数。 (A)密度勾配(四角、暗いバー)を使用して処理されたサンプルの平均(± SD)細胞生存率 vs.8つのペアのサンプルに対するビーズベース(円、オープンバー)メソッド。ns = 対応のある t 検定では有意ではありません。(B)密度勾配(正方形、暗いバー)を使用して処理されたサンプルの合計細胞数 と8つのペアのサンプルに対するビーズベース(円、オープンバー)メソッド。*p < 0.05 対応のある t 検定を使用して決定しました。 この図の拡大版を表示するには、ここをクリックしてください。
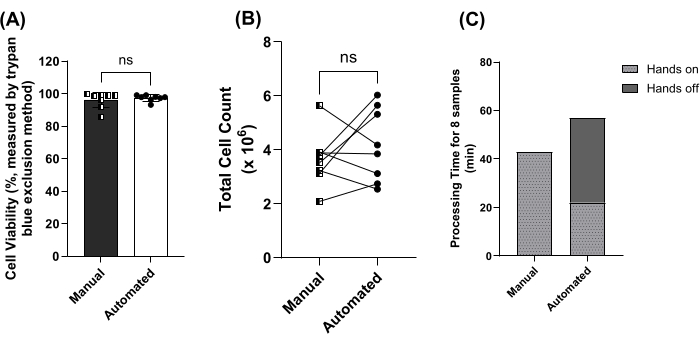
図4:手動および自動ビーズベースの分析法の比較(A)手動(四角、暗いバー)を使用して処理したサンプルの平均(± SD)細胞生存率 vs8つのペアのサンプルに対する自動化された(サークル、オープンバー)ビーズベースの方法。ns = Mann-Whitney 検定では有意ではありません。(B)手動(正方形)を使用して処理されたサンプルの合計細胞数 vs.8つのペアサンプルのための自動化された(円)ビーズベースの方法。ns = 対応のある t 検定では有意ではありません。(C)手動を使用して処理された8つのサンプルの処理時間 vs.ハンズオン(ライトバー)とハンズオフ期間(ダークバー)などの自動化された方法。この図の拡大版を表示するには、ここをクリックしてください。
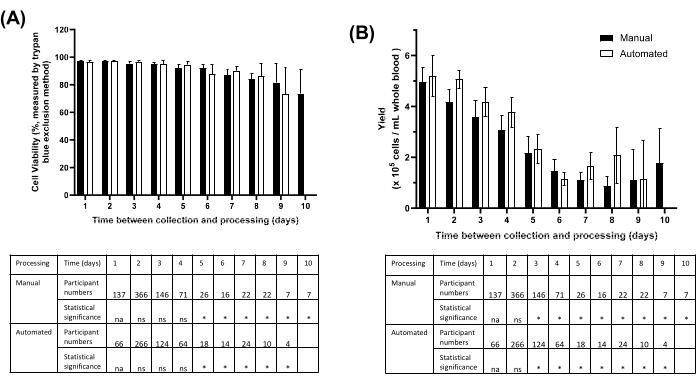
図5:ビーズベースの方法から分離されたPBMCの生存率と収量は、サンプル収集とPBMC保存の間の時間に応じて手動または自動化を使用して行われます。 (A)手動(ダークバー)を使用して処理された参加者サンプルの平均(±95%CI)細胞生存率 vs自動化された(オープンバー)ビーズベースの方法。参加者番号の詳細を示す表。ns = 重要ではありません。NA = 該当しません。*p < Tukeyの多重比較の検定で0.05。(B)手動(暗いバー)を使用して処理された参加者サンプルの合計細胞数 vs.自動化された(オープンバー)ビーズベースの方法。参加者番号の詳細を示す表。ns = 重要ではありません。NA = 該当しません。*p < Tukeyの多重比較の検定で0.05。Automated Day 10 の値は、レプリケート数が 3 より小さいため、値がありません。 この図の拡大版を表示するには、ここをクリックしてください。
補足図1: 密度勾配とビーズベースの方法による細胞回収率の差の図。 この割合は、全血中の単離前の絶対細胞数と、密度勾配法(四角、暗いバー)およびビーズベースの方法(円、白棒)(n = 8)を使用した単離後の細胞懸濁液を使用して計算しました。ns = 有意ではなく、*p < 対応のない t 検定によって決定される 0.05 です。 このファイルをダウンロードするには、ここをクリックしてください。
補足ファイル1:密度勾配プロトコル。このファイルをダウンロードするには、ここをクリックしてください。
補足ファイル2:0.1 M EDTA、pH 8.0のPBS溶液の調製。このファイルをダウンロードするには、ここをクリックしてください。
補足ファイル3:代表データを生成するために行われた詳細な手順。このファイルをダウンロードするには、ここをクリックしてください。
ディスカッション
ヒトPBMCは、数多くのアッセイに使用される汎用性の高い細胞タイプです。ただし、分離スループットは、Biobanks16を含む多くのラボで制限となることがよくあります。以前は、NSW Health Statewide Biobankは密度勾配法を使用してPBMCを単離していました。処理能力を高めるために密度勾配分離法の自動化が検討されましたが、(i)遠心分離ユニットを備えたリキッドハンドラーのコストを完全に自動化すること、無菌製品を製造するためのHEPAユニットの追加要件、(ii)プログラミングのための訓練を受けた人員、(iii)プロトコルテストに必要な時間など、実装の障壁が特定されました。したがって、この研究では、代替方法を検討し、手動および自動処理に使用できる市販のヒトPBMCキットを特定しました。処理に必要な機器は、標準(長さ1.2m)の生物学的安全キャビネットに収まるため、無菌性が保証されます。このホワイトペーパーでは、品質を犠牲にすることなく効率を高め、試薬コストを削減するために、メーカーが推奨するプロトコル14に加えられた変更について詳しく説明します。さらに、メーカーのプロトコルは、全血(ステップ1.2)、血漿(ステップ2.2)、元の血液チューブからのRBC(ステップ2.5)の分注、細胞計数と凍結保存など、将来の研究のためのバイオバンク検体への詳細なステップに拡張されました。
この研究では、密度勾配分離、手動、および自動ビーズベースの分離の3つのPBMC単離プロトコルを比較しました。PBMC単離前のバフィーコート希釈液の除去、遠心分離のためのブレークオフ要件の排除など、メーカーのマニュアルビーズベースのプロトコールに修正が加えられ、研究者は適応性があり、費用対効果が高く、ハイスループットのPBMC単離プロトコールに従うことができました。まず、8つの一致した全血サンプルを使用してPBMCを分離し、密度勾配分離と手動ビーズベースの手法を比較しました。重要なことに、PBMCの細胞集団分布、細胞生存率、および回収率は、図2A-F、図3A、および補足図1にそれぞれ示されるように、比較した2つの方法間で有意差がありませんでした。代表的なデータでは、トリパンブルー排除法を用いた密度勾配分離法では細胞数が多くなりましたが、ヘマトロジー細胞分析装置を使用した場合はそうではありませんでした。セルカウンター上のPBMC細胞タイプ設定は、8〜50μmの細胞直径範囲を採用しているため、トリパンブルー排除法17を使用する場合、PBMCおよび顆粒球(直径約12〜15μm)がカウントされます。血液学的細胞カウンターはトリパンブルー排除法よりも高い特異性を示しましたが、一部の回収率計算は 100% を超えており、機器の誤差範囲を反映していました(補足図1を参照)。したがって、ほとんどの技術では特異的で高感度の分画的細胞カウントが得られないため、研究者はPBMC単離プロトコルからの収量を比較する際に、細胞カウント技術の組み合わせを適用することをお勧めします。さらに、どちらの技術から得られたPBMCの機能活性も比較するためのアッセイは行われなかったため、これが私たちの分析の限界です。
次に、手動および自動ビーズベースの分析法を比較したところ、8 つの一致したサンプルから PBMC の収量または生存率の間に有意差は認められませんでした(図 4A、B)。細胞集団は個別に比較せず、両方の方法で同じ抗体分離カクテルを使用しました。重要なことに、自動化されたプロトコルを使用して、8 つのサンプルを処理するハンズオン時間が 43 分から 22 分に短縮されました(図 4C)。自動化により、スループット、技術者の燃え尽き症候群の防止、検体処理の一貫性が確保されますが、試薬と消耗品のコストは、手動のビーズベースの方法よりも3〜4倍と大幅に高くなります。これは、推奨範囲である2〜5 mL(全血量10 mL以上)ではなく、1 mLのバフィーコート(全血量10 mLから)を使用するように製造プロトコルを変更した後です。.予算が限られている場合は、手動法を選択することで、試薬と消耗品のコストは密度分離法と同等に維持しながら、処理時間を~25%短縮できます。5分間のインキュベーション期間内(ステップ3.7、3.11、および3.14)にサンプルを適切にずらす(~30 s/サンプル)を確保するために、技術者1人あたり一度に8個以下のサンプルを処理することをお勧めします。
手動と自動のビーズベースのどちらの方法でも、バフィーコートの除去は、最適なPBMC分離を確保するための重要なステップです。このプロトコルでは、試薬の量が出発物質の量10に基づいているため、全血ではなくバフィーコートが使用されていることに注意することが重要です。バフィーコートの全容積を効果的に除去することは、技術的に困難な場合があります。当初、この方法では 0.5 mL のバフィーコートを詳細に除去していましたが、回復を改善するために 1 mL に増やしました。バフィーコートの適切で一貫した回収を確実にするためには、このプロセスを詳細に説明することが、プロトコールの文書化とトレーニングで重要です。バフィーコートを吸引しながらピペットチップを回転させながら、下の層からRBCをあまり吸引しないように注意することをお勧めします(ステップ2.3)。望ましくない細胞(すなわち、顆粒球および赤血球)に結合する抗体カクテルを飽和させないことが重要です。これは、収量と純度に影響を与える可能性があります10。バフィーコートの抽出中に収集される赤血球を最小限に抑えるには、ピペットの先端をプラズマとバフィーコート層の間に配置する必要があります。バフィーコートの容量は1mLから増やすことができます。しかし、収集された量の10%を超えないように注意を払わなければならない。あるいは、自動化されたリキッドハンドラーを使用して、バフィーコートを一貫して収集することができる18。しかし、リキッドハンドリング機器のプロトコルの校正とトラブルシューティングに必要な時間は、特に費用を考慮すると、ほとんどのラボでは実現できないかもしれません。
NSW Health Statewide Biobankが今後3年間で23,000のPBMCを処理するという目標を掲げていることを考えると、自動化ビーズベースのプロトコルの移行と適用は不可欠でした。ここでは、PBMCは、収集から最大9日間でACDチューブから分離でき、平均生存率は>70%であることが実証されました。採取後24時間で収量は最適でしたが、サンプルの輸送が必要になる可能性があるため、この時間枠内での処理が常に可能であるとは限りません。手動または自動ビーズベースの方法で単離されたPBMCは、収集から4日以内に単離した場合の全血>3 x 10⁵細胞/mL、収集から10日以内に単離された場合の全血>1 x 105細胞/mLの収量を示す可能性があることが示されました。5 日間を超えるサンプルの数が少ないことは、この分析の制限として指摘されています。さらに、参加者は年齢、性別、および病歴に基づいてデータを分離していなかったため、この情報は利用できませんでした。両分析法の処理時間の遅延の影響を調べるためには比較分析が必要であるが、密度勾配法を用いたPBMC単離の遅延は細胞品質を低下させ、RBC汚染を著しく増加させることが以前に報告されている19,20。さらに、処理が遅れると顆粒球の割合が増加するため、同様の「年代」の標本は下流の分析のためにグループ化されるべきである20,21,22。注目すべきは、この実験は、酸性クエン酸デキストロース(すなわち、クエン酸三ナトリウム、クエン酸、およびデキストロース)で抗凝固された血液を使用して行われたことです。しかし、他の抗凝固剤が使用されている場合、細胞型の収量および/または割合は異なる可能性がある23;したがって、研究者は、意図されたダウンストリームPBMC分析に基づいて適切な抗凝固剤を選択することをお勧めします。
要約すると、ハイスループットワークフローに適応可能な磁気ビーズを使用したPBMC単離のプロトコルは、細胞生存率を損なうことなくスケーリングの要件を満たすために詳細に説明されています。手動分析法と自動分析法はどちらも、開始量と再懸濁量を変更することで特定の細胞濃度を生成するように最適化できます。NSW Health Statewide Biobankは、従来の密度勾配分離技術を使用した月間~60のPBMCの抽出から、この自動化に対応したビーズベースの方法を使用した月間~300のPBMCへの移行を行いました。著者らの次の目標は、自動化されたプラットフォームを使用して月に最大1200のPBMCを処理し、磁気ビーズベース(手動および自動)と密度勾配技術の両方で分離されたPBMCをさらに比較して、この技術をバイオバンクに特に焦点を当てた他の研究室に実装するように導くことです。
開示事項
著者は、利益相反を宣言しません。
謝辞
NSW州保健州全体のバイオバンクは、NSW州保健病理学局、NSW州保健医療研究局、シドニー地方保健地区からの支援に感謝の意を表します。さらに、著者らは、OmicoおよびNSW Health Statewide Biobankが支援するその他の調査研究に対し、社内で生成されたデータを公開し、未使用の標本を研究目的で使用する許可を与えてくれたことに感謝します。著者らは、ジェニファー・ブライン教授(シドニー大学ニューサウスウェールズ州健康病理学)に対し、重要なリーダーシップと議論に感謝します。 図 1 は BioRender.com を使用して作成されました。
資料
| Name | Company | Catalog Number | Comments |
| Cell cryopreservation media CS10, 100 mL (CRYOSTOR) | StemCellTM Technologies | 07930 | |
| Class II Biological Safety Cabinet | Thermo ScientififcTM | 51033311 | |
| CoolCell 1 mL FX | BioTools | BCS-407P | This is the control rate freezing container used. |
| Distilled Water | Bacto Laboratories | 561832 | |
| DxH 500 Hematology Analyzer | Beckman Coulter Life Sciences | B40601 | Referred to as external automated cell counter. |
| EasyEightsTM EasySepTM Magnet | StemCellTM Technologies | 18103 | |
| EasySepTM Direct Human PBMC Isolation Kit | StemCellTM Technologies | 19654 | Kit includes the magnetic bead tube and the cocktail mix tube |
| Ethylenediaminetetraacetic acid | Sigma-Aldrich Pty Ltd | E6758-500G | Instructions to make 0.1M EDTA solution from EDTA salt is located in supplemental file 2. |
| LymphoprepTM Density Gradient Medium | StemCellTM Technologies | 7851 | |
| Megafuge ST4 Plus Centrifuge | Thermo ScientififcTM | THR75009903 | |
| Orion Star A211 pH meter electrode | Thermo ScientififcTM | STARA2110 | |
| Orion™ ROSS Ultra™ Glass Triode™ pH/ATC Combination Electrodes | Thermo ScientififcTM | 8302BNURCA | |
| Phosphate buffered saline (PBS), solution, 1X, 500ml | Life Technologies Australia Pty Ltd | 10010023 | |
| Prism | GraphPad | ||
| RoboSepTM Buffer 1X | StemCellTM Technologies | 20104 | Software used for statistical analysis. |
| RoboSepTM-S | StemCellTM Technologies | 21000 | Fully automated cell separator instrument. |
| RoboSep™ Filter Tips | StemCellTM Technologies | 20125 | |
| SepMateTM-50 (IVD) tubes | StemCellTM Technologies | 85460 | IVD - In vitro diagnostics. Also known as SepMateTM-50 tubes |
| Vi-CELL XR Cell Anlayzer | Beckman Coulter Life Sciences | Internal automated cell counter. Instrument obsolete and no longer available for purchase (as of December 31, 2022). Alternative instrument is the ViCell BLU Cell Viability Analyzer (Product no. C19196). | |
| Vi-CELL XR Quad Pack Reagent Kit | Beckman Coulter Life Sciences | 383722 |
参考文献
- Alexovic, M., et al. Human peripheral blood mononuclear cells: A review of recent proteomic applications. Proteomics. 22 (15-16), e2200026 (2022).
- Zhang, M., Huang, B. The multi-differentiation potential of peripheral blood mononuclear cells. Stem Cell Res Ther. 3 (6), 48 (2012).
- Arimilli, S., Damratoski, B. E., Chen, P., Jones, B. A., Prasad, G. L. Rapid isolation of leukocyte subsets from fresh and cryopreserved peripheral blood mononuclear cells in clinical research. Cryo Lett. 33 (5), 376-384 (2012).
- Kleeberger, C. A., et al. Viability and recovery of peripheral blood mononuclear cells cryopreserved for up to 12 years in a multicenter study. Clin Diagn Lab Immunol. 6 (1), 14-19 (1999).
- Ulmer, A. J., Scholz, W., Ernst, M., Brandt, E., Flad, H. D. Isolation and subfractionation of human peripheral blood mononuclear cells (PBMC) by density gradient centrifugation on percoll. Immunobiology. 166 (3), 238-250 (1984).
- Fuss, I. J., Kanof, M. E., Smith, P. D., Zola, H. Isolation of whole mononuclear cells from peripheral blood and cord blood. Curr Protoc Immunol. 7, 711-718 (2009).
- Gautam, A., et al. Investigating gene expression profiles of whole blood and peripheral blood mononuclear cells using multiple collection and processing methods. PLoS One. 14 (12), e0225137 (2019).
- Hamot, G., Ammerlaan, W., Mathay, C., Kofanova, O., Betsou, F. Method validation for automated isolation of viable peripheral blood mononuclear cells. Biopreserv Biobank. 13 (3), 152-163 (2015).
- Coppola, L., et al. Purification of viable peripheral blood mononuclear cells for biobanking using a robotized liquid handling workstation. J Transl Med. 17 (1), 371 (2019).
- Stemcell Technologies. Vol. 27156. STEMCELL TECHNOLOGIES. , 1-4 (2020).
- Hornschuh, M., et al. Negative magnetic sorting preserves the functionality of ex vivo cultivated non-adherent human monocytes. Biology (Basel). 11 (11), 1583 (2022).
- Bhattacharjee, J., Das, B., Mishra, A., Sahay, P., Upadhyay, P. Monocytes isolated by positive and negative magnetic sorting techniques show different molecular characteristics and immunophenotypic behaviour. F1000Res. 6, 2045 (2017).
- Ohlsson, S., Diedrich, B., Uhlin, M., Sandgren, P. Optimized processing for pathogen inactivation of double-dose buffy-coat platelet concentrates: Maintained in vitro quality over 7-day storage. Vox Sang. 113 (7), 611-621 (2018).
- Easysep direct human PBMC isolation kit for processing 100 mL buffy coat. Stemcell Technologies Available from: https://www.stemcell.com/products/brands/easysep-cell-separation.html (2022)
- Vi-cell XR cell viability analyzer instructions for use. Beckman Coulter Available from: https://mbcbiolabs.com/wp-content/uploads/2022/08/Beckman-Coulter-ViCell-Manual.pdf (2017)
- Fuchs, Y. F., et al. Next-generation biobanking: Employing a robotic system for automated mononuclear cell isolation. Biopreserv Biobank. 21 (1), 106-110 (2023).
- Tigner, A., Ibrahim, S. A., Murray, I. V. Histology, white blood cell. StatPearls Publishing. , (2024).
- Mathay, C., Ammerlaan, W., Betsou, F. Automatic buffy coat extract on: Methodology, feasibility, optimization, and validation study. Biopreserv Biobank. 10 (6), 543-547 (2012).
- Golke, T., et al. Delays during PBMC isolation have a moderate effect on yield, but severly compromise cell viability. Clin Chem Lab Med. 60 (5), 701-706 (2022).
- Yi, P. C., et al. Impact of delayed PBMC processing on functional and genomic assays. J Immunol Methods. 519, 113514 (2023).
- Mckenna, K. C., Beatty, K. M., Vicetti Miguel, R., Bilonick, R. A. Delayed processing of blood increases the frequency of activated CD11b+ CD15+ granulocytes which inhibit t-cell function. J Immunol Methods. 341 (1-2), 68-75 (2009).
- Mallone, R., et al. Isolation and preservation of peripheral blood mononuclear cells for analysis of islet antigen-reactive t-cell responses: Position statement of the t-cell workshop committee of the immunology of diabetes society. Clin Exp Immunol. 163 (1), 33-49 (2011).
- Betsou, F., Gaignaux, A., Ammerlaan, W., Norris, P. J., Stone, M. Biospecimen science of blood for peripheral blood mononuclear cell (PBMC) functional applications. Curr Pathobiol Rep. 7 (2), 17-27 (2019).
転載および許可
このJoVE論文のテキスト又は図を再利用するための許可を申請します
許可を申請さらに記事を探す
This article has been published
Video Coming Soon
Copyright © 2023 MyJoVE Corporation. All rights reserved