Aby wyświetlić tę treść, wymagana jest subskrypcja JoVE. Zaloguj się lub rozpocznij bezpłatny okres próbny.
Method Article
Application of Stopped-flow Kinetics Methods to Investigate the Mechanism of Action of a DNA Repair Protein
W tym Artykule
Podsumowanie
Msh2-Msh6 is responsible for initiating repair of replication errors in DNA. Here we present a transient kinetics approach towards understanding how this critical protein works. The report illustrates stopped-flow experiments for measuring the coupled DNA binding and ATPase kinetics underlying Msh2-Msh6 mechanism of action in DNA repair.
Streszczenie
Transient kinetic analysis is indispensable for understanding the workings of biological macromolecules, since this approach yields mechanistic information including active site concentrations and intrinsic rate constants that govern macromolecular function. In case of enzymes, for example, transient or pre-steady state measurements identify and characterize individual events in the reaction pathway, whereas steady state measurements only yield overall catalytic efficiency and specificity. Individual events such as protein-protein or protein-ligand interactions and rate-limiting conformational changes often occur in the millisecond timescale, and can be measured directly by stopped-flow and chemical-quench flow methods. Given an optical signal such as fluorescence, stopped-flow serves as a powerful and accessible tool for monitoring reaction progress from substrate binding to product release and catalytic turnover1,2.
Here, we report application of stopped-flow kinetics to probe the mechanism of action of Msh2-Msh6, a eukaryotic DNA repair protein that recognizes base-pair mismatches and insertion/deletion loops in DNA and signals mismatch repair (MMR)3-5. In doing so, Msh2-Msh6 increases the accuracy of DNA replication by three orders of magnitude (error frequency decreases from ~10-6 to10-9 bases), and thus helps preserve genomic integrity. Not surprisingly, defective human Msh2-Msh6 function is associated with hereditary non-polyposis colon cancer and other sporadic cancers6-8. In order to understand the mechanism of action of this critical DNA metabolic protein, we are probing the dynamics of Msh2-Msh6 interaction with mismatched DNA as well as the ATPase activity that fuels its actions in MMR. DNA binding is measured by rapidly mixing Msh2-Msh6 with DNA containing a 2-aminopurine (2-Ap) fluorophore adjacent to a G:T mismatch and monitoring the resulting increase in 2-aminopurine fluorescence in real time. DNA dissociation is measured by mixing pre-formed Msh2-Msh6 G:T(2-Ap) mismatch complex with unlabeled trap DNA and monitoring decrease in fluorescence over time9. Pre-steady state ATPase kinetics are measured by the change in fluorescence of 7-diethylamino-3-((((2-maleimidyl)ethyl)amino)carbonyl) coumarin)-labeled Phosphate Binding Protein (MDCC-PBP) on binding phosphate (Pi) released by Msh2-Msh6 following ATP hydrolysis9,10.
The data reveal rapid binding of Msh2-Msh6 to a G:T mismatch and formation of a long-lived Msh2-Msh6 G:T complex, which in turn results in suppression of ATP hydrolysis and stabilization of the protein in an ATP-bound form. The reaction kinetics provide clear support for the hypothesis that ATP-bound Msh2-Msh6 signals DNA repair on binding a mismatched base pair in the double helix.
F. Noah Biro and Jie Zhai contributed to this paper equally.
Protokół
A. Measurement of Msh2-Msh6 DNA Binding Kinetics
1. Sample preparation for the Msh2-Msh6 DNA binding kinetics experiment
Preparation of reagents for a fluorescence-based kinetic DNA binding experiment on a stopped-flow is similar to that for an equilibrium experiment on a fluorometer. Indeed equilibrium binding analysis should be performed first to estimate the dissociation constant (KD) for the interaction in order to optimize reaction conditions for kinetic analysis. Stopped-flow experiments require larger quantities of biological materials compared with equilibrium or steady-state experiments; therefore, the approach is most feasible when low milligram amounts of protein are available 11,12 and similar amounts of ligands can be prepared or purchased.
- We over-express S. cerevisiae Msh2-Msh6 in E. coli and purify milligram quantities of the protein by ion-exchange chromatography (Fig. 1) 11.
- DNA reagents with or without the 2-Aminopurine fluorophore can be chemically synthesized. We purchase 37 nucleotide length single-stranded DNAs modified with 2-Aminopurine and anneal two complementary strands to prepare duplex DNA with 2-Aminopurine adjacent to a G:T mismatch (Fig. 2). DNA can be purified by the manufacturer or in the laboratory by denaturing polyacrylamide gel electrophoresis; the latter generally gives higher yields.
- For DNA binding kinetics, prepare separate G:T(2-Ap) DNA and Msh2-Msh6 protein samples in DNA binding buffer (20 mM Tris-HCl, pH 8.0, 5 mM MgCl2, 100 mM NaCl). Msh2-Msh6 and DNA concentrations are 0.8 μM and 0.12 μM respectively, which yields 0.4 μM and 0.06 μM final concentrations in a single mixing experiment with 1:1 mixing ratio. For DNA dissociation kinetics, prepare one sample containing 0.8 μM Msh2-Msh6 and 0.12 μM G:T(2-Ap) DNA, and another sample with 8 μM unlabeled G:T DNA as a trap for free Msh2-Msh6. Prepare and store the samples on ice. In these reactions, protein concentration is well above the 10 nM KD for Msh2-Msh6-DNA interaction and DNA concentration is sufficient for a robust fluorescence signal (determined empirically). A volume of 400 μl per sample is sufficient to obtain about 10 kinetic traces (Table 1).
- Use high quality chemicals that are free of fluorescent impurities in the protein, DNA, and buffer preparations. Filter all buffers through a 0.2 μm membrane to avoid clogging the stopped-flow with particulates.
- If the fluorophore absorbs visible light, the preparation and experiment must be performed under low light conditions.
2. Instrument preparation for the Msh2-Msh6 DNA-binding kinetics
A stopped-flow instrument is quite simple in principle. It uses a drive motor to rapidly push two solutions in drive syringes into a mixing device, the mixed solution then flows into an observation cell for data collection (Fig. 3). We use the KinTek stopped-flow, which requires low sample volume, allows single or sequential mixing of reactants, detection of a variety of optical signals, and is very easy to use. Stopped-flow instruments are available from several other manufacturers as well.
- In order to prepare the stopped-flow instrument for experiments, make sure the computer and controller are turned off. Turn on the circulating water bath set to ambient temperature (25 deg;C) to cool the lamp. Ignite the lamp. Set the monochromator to the desired excitation wavelength (315 nm in case of 2-Aminopurine). Turn the slit wheel to the desired slit width (empirically balance high fluorophore excitation with low photobleaching). Turn on the controller and the computer. Turn on the circulating water bath to fill the water jacket that maintains the reactants at a desired temperature during the experiment (30°C in case of S. cerevisiae Msh2-Msh6).
- Next, execute the stopped-flow program. Turn on the detector of choice, which in this case is a photomultiplier tube (PMT) with an interference filter appropriate for the fluorophore (350 nm cut-off filter in case of 2-Aminopurine). Apply voltage to the PMT. Measure the dark current to correct for any background electrical noise.
- The stopped-flow drive syringes and observation cell must be washed prior to loading the samples. Set the Sample Loading Valve to the LOAD position. Fill a 1ml syringe with deionized, filtered water, attach it to the loading port located beneath the drive syringe, and manually push water between the two syringes a few times. Repeat the process twice for each drive syringe to be used in the experiment. Next, fill the drive syringes with water to wash the observation cell. Switch the Sample Loading Valve to the FIRE position. Use the Adjust Syringe Drive command, which controls the drive motor, and lower the drive plate to push water through the observation cell and into the exit line. Take care not to push the plunger to the very end of the drive syringe. Raise the drive plate. Switch the valve to the LOAD position. Manually wash the syringes with the reaction buffer and leave empty. The instrument is now ready for use.
3. Msh2-Msh6 DNA binding experiment and data analysis
- Transfer each sample from the tube to a fresh 1 ml syringe. Attach each sample syringe to a loading port and push the solution into the drive syringe. Take care to remove all air bubbles by manually pushing the solution between the two syringes a few times with intermittent pauses. Lower the drive plate until it contacts the top of the drive syringes. Let the reactants equilibrate to ambient temperature for a few minutes.
- For data collection, open the Set Time/Channels window, select the data collection channel (PMT), mode of data analysis (Fluorescence), and the number of traces (Shots) to be collected. Enter the data collection time during which 1000 data points will be collected. An unknown reaction should be monitored over several seconds in order to detect any slow phases. Empirically estimate the time required to reach equilibrium or steady state and set data collection time to ≥ 6 half lives. In the case of Msh2-Msh6 the optimal time frame is 2 seconds for G:T mismatch binding kinetics and 60 seconds for G:T dissociation kinetics. Now set the valve to the FIRE position and click the Collect Data button. This action initiates mixing of Msh2-Msh6 and DNA, entry of the reaction into the observation cell, excitation of the 2-Aminopurine fluorophore and collection of the fluorescence signal over time. Collect at least 5 kinetic traces to obtain high quality data and save the file.
- When the experiment is complete, turn of the lamp. Wash the syringes and observation cell with water as described previously. Then, turn off the rest of the equipment, except for the circulating water bath. The water is circulated for an additional 15 minutes to cool the lamp.
- Math operations and data fitting can be performed with the KinTek software itself, in order to get a sense of the reaction kinetics during the experiment. Further analysis can also be performed by averaging multiple kinetic traces and saving and exporting the averaged file to other data analysis/graphing software.
4. Representative results for Msh2-Msh6 DNA binding kinetics
Kinetic data for Msh2-Msh6 interactions with G:T mismatch DNA, can be fit to a single exponential function and yield a fast binding rate constant kON close to 3 x 10⁷ M-1second-1 (Fig. 4A) and a slow dissociation constant kOFF of 0.012 second-1 (Fig. 4B), which reveals that the Msh2-Msh6 binds a G:T mismatch rapidly and forms a very stable complex with a half life close to 60 seconds 13.
B. Measurement of Msh2-Msh6 ATPase Kinetics
1. Sample preparation for the Msh2-Msh6 ATPase kinetics experiment
- Prepare Msh2-Msh6 and DNA reagents as described earlier, using unlabeled DNA. In addition, purify Phosphate Binding Protein (PBP) from E. coli and label it with the MDCC fluorophore (Fig. 5) 14,15. MDCC-PBP binds free phosphate rapidly (kON equals 1 x 10⁸ M-1second-1) and with high affinity (KD = 100 nM), resulting in a dramatic increase in MDCC fluorescence (Fig. 6). MDCC-PBP is therefore a robust reporter of pre-steady state ATP hydrolysis and phosphate release kinetics 14,15. Note that it is essential to minimize background phosphate levels for this assay; therefore, the use of glass should be strictly avoided at ALL stages of reagent preparation.
- Prepare a sample with 4 μM Msh2-Msh6 protein with or without 6 μM G:T DNA, which yields 2 μM and 3 μM final concentrations in a single mixing experiment with 1:1 mixing ratio. Note that pre-steady state experiments require high enzyme concentrations since the signal of interest is from a single turnover or the first few catalytic turnovers. Prepare another sample containing 1 mM freshly dissolved ATP and 20 μM MDCC-PBP reporter. Add 0.10 Units/ml of purine nucleoside phosphorylase and 200 μM 7-methylguanosine to the samples, which serves to mop up any contaminating phosphate. Incubate the samples on ice for at least 20 minutes (Table 2).
2. Instrument preparation for the Msh2-Msh6 ATPase kinetics
- Prepare the stopped-flow instrument for experiments as described earlier. In addition, mop up phosphate contaminant from the drive syringes with 0.5 Units/ml purine nucleoside phosphorylase and 200 μM 7-methylguanosine for 20 minutes. Set the excitation wavelength to 425 nm and use a 450 nm cut-off filter with the PMT for detection of MDCC-PBP fluorescence.
3. Msh2-Msh6 ATPase experiment and data analysis
- Load the drive syringes with the samples as described earlier. Click on Collect Data to mix Msh2-Msh6 with ATP and MDCC-PBP and monitor phosphate release by Msh2-Msh6 and the coupled increase in MDCC-PBP fluorescence over time. Collect at least 5 kinetic traces to obtain a high quality data set and save the file. Average multiple kinetic traces and export the data file for analysis.
- Prepare a calibration curve to determine the linear relationship between phosphate concentration and MDCC-PBP fluorescence. In order to do so, mix MDCC-PBP with different phosphate concentrations under the same experimental conditions in the stopped-flow, and measure maximum MDCC-PBP fluorescence at each phosphate concentration.
- Plot the maximum MDCC-PBP fluorescence versus each phosphate concentration for the calibration curve (Fig. 7) and use the slope to obtain phosphate concentration in the Msh2-Msh6 reactions. Plot phosphate concentration versus time and fit the data to an exponential and linear function. This function describes a burst of pre-steady state ATP hydrolysis and phosphate release followed by the linear steady state phase of the reaction.
4. Representative results for Msh2-Msh6 ATPase kinetics
The kinetic data show that Msh2-Msh6 hydrolyzes ATP and releases phosphate rapidly at 1.4 second-1 in the first catalytic turnover. This phase is followed by a slow step in the reaction that limits subsequent turnovers to a 7-fold slower steady state kcat of 0.2 second-1 (Fig. 8A). However, when Msh2-Msh6 is bound to mismatched DNA, the burst of ATP hydrolysis and phosphate release is suppressed, and Msh2-Msh6 remains in an ATP-bound state for a longer time.

Figure 1. Purification of S. cerevisiae Msh2-Msh6 from E. coli. Msh2 and Msh6 genes were cloned into pET11a vector and over-expressed in E. coli BL21 (DE3) cells. The protein complex was purified by column chromatography over SP-sepharose, heparin, and Q-sepharose resins. SDS-PAGE analysis shown here contains protein fractions from a Q-sepharose column.
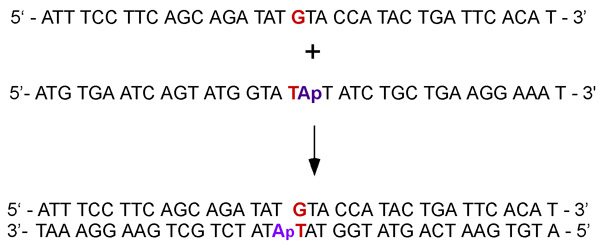
Figure 2. Complementary single-stranded DNAs are annealed to form a duplex containing G:T mismatch with an adjacent Adenosine (for ATPase experiments) or 2-Aminopurine fluorescent base analog of Adenosine (for DNA binding experiments).
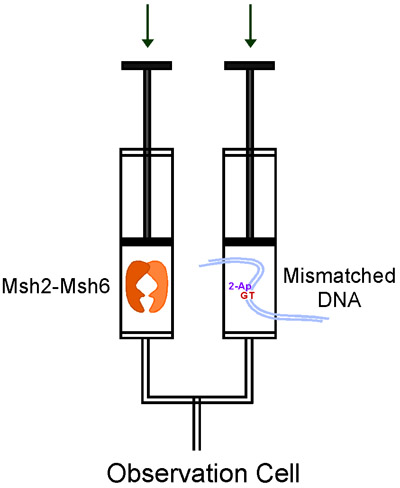
Figure 3. Flow of reactants in the KinTek stopped-flow during a single mixing experiment.

Figure 4a. Kinetics of Msh2-Msh6 interaction with a G:T mismatch. Mixing of duplex DNA (0.12 μM) containing a G:T adjacent to 2-Aminopurine with Msh2-Msh6 (0.8 μM) leads to increase in fluorescence over time, and yields a bimolecular rate constant kON = 2.4 107 M-1s-1 for the interaction.
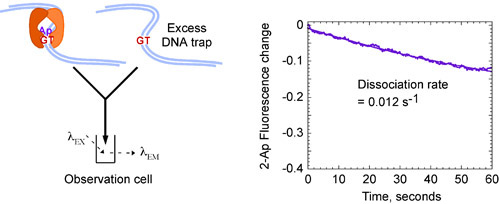
Figure 4b. Kinetics of Msh2-Msh6 interaction with a G:T mismatch. Mixing pre-formed Msh2-Msh6 G:T(2-Ap) complex with excess unlabeled G:T DNA (8 μM) that traps any free Msh2-Msh6 leads to decrease in fluorescence over time, and yields a slow dissociation rate constant, kOFF = 0.012 s-1, indicating a stable complex with a long half life of ~ 60 seconds. Final concentrations: 0.4 μM Msh2-Msh6, 0.06 μM labeled DNA, 4 μM unlabeled G:T DNA trap.
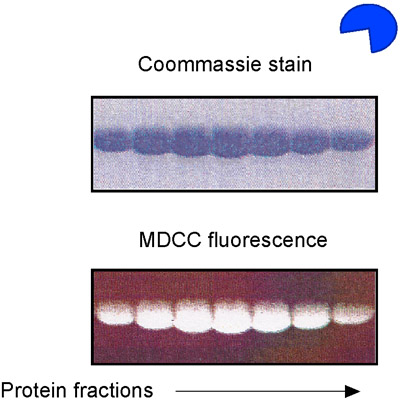
Figure 5. MDCC-PBP preparation. SDS-PAGE analysis of E. coli phosphate binding protein (PBP), purified and labeled with the MDCC fluorophore.
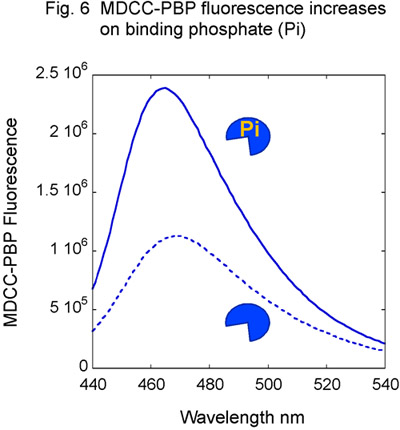
Figure 6. MDCC-PBP response to phosphate. Titration of MDCC-PBP with phosphate (Pi) results in increasing MDCC fluorescence.

Figure 7a. Preparation of the phosphate (Pi) standard curve. MDCC-PBP (20 μM) is mixed with varying amounts of Pi (0 - 8 μM) and fluorescence measured over time until equilibrium is reached. Final concentrations: 10 μM MDCC-PBP, 0 - 4 μM Pi.
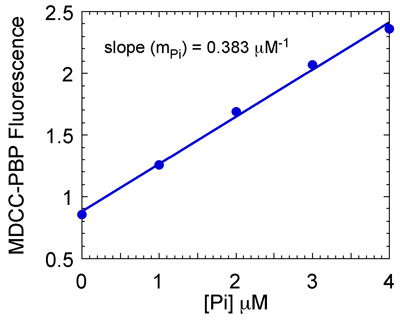
Figure 7b. Preparation of the phosphate (Pi) standard curve. Maximum MDCC-PBP fluorescence is plotted versus [Pi] to yield a standard curve. The slope of the line (0.383 μM-1 in this case) is used to convert MDCC-PBP fluorescence into Pi concentration.
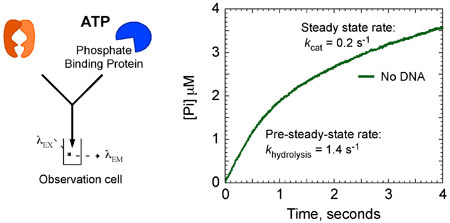
Figure 8a. Msh2-Msh6 ATPase kinetics. Msh2-Msh6 (4 μM), in the absence G:T DNA, mixed rapidly with ATP (1 mM) and MDCC-PBP (20 μM) exhibits a burst of ATP hydrolysis and Pi release. Data analysis yields the rate (k hydrolysis = 1.4 s-1) and amplitude (2 μM; 1 site per Msh2-Msh6) of the burst phase, which is followed by a linear, steady state phase at a rate of 0.4 μM s-1 (kcat = 0.2 s-1).
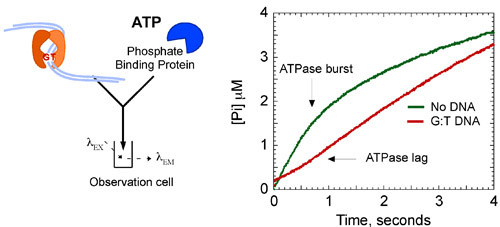
Figure 8b. Msh2-Msh6 ATPase kinetics. Addition of G:T DNA to the reaction (6 μM) suppresses the burst of ATP hydrolysis, stabilizing the complex in an ATP-bound state. Final concentrations: 2 μM Msh2-Msh6, 500 μM ATP, 3 μM DNA, 10 μM MDCC-PBP. Burst kinetics are fit by the following equation: [Pi] = A0e-kt + Vt, where [Pi] is phosphate concentration, A0 is the burst amplitude, k is the observed burst rate constant and V is the velocity of the linear phase (kcat = V/[Msh2-Msh6]).
| Sample | Protein | DNA | ||||
| Reagent | Stock | Working | Vol, μL | Stock | Working | Vol, μL |
| Msh2-Msh6 | 5 μM | 0.8 μM | 64 | - | - | - |
| 2ApG:T | - | - | - | 10 μM | 0.12 μM | 4.8 |
| buffer | 10x | 1x | 40 | 10x | 1x | 40 |
| ddH2O | - | - | 296 | - | - | 355 |
| Total | 400 | 400 | ||||
Table 1 DNA binding reaction
| Sample | Protein | Protein-DNA | ATP | ||||||
| Reagent | Stock | Working | Vol, μL | Stock | Working | Vol, μL | Stock | Working | Vol, μL |
| Msh2-Msh6 | 20 μM | 4 μM | 80 | 20 μM | 4 μM | 80 | - | - | - |
| G:T | - | - | - | 100 | 6 | 24 | - | - | - |
| ATP | - | - | - | - | - | - | 50 mM | 1 mM | 8 |
| 7-MEG | 250x | 1x | 1.6 | 250x | 1x | 1.6 | 250x | 1x | 1.6 |
| PNPase | 100x | 1x | 4 | 100x | 1x | 4 | 100x | 1x | 4 |
| PBP-MDCC | 150 μM | 20 μM | 53.3 | 150 μM | 20 μM | 53.3 | - | - | - |
| Buffer | 10x | 1x | 40 | 10x | 1x | 40 | 10x | 1x | 40 |
| ddH2O | - | - | 221 | - | - | 197 | - | - | 346 |
| Total | 400 | 400 | 400 | ||||||
Table 2 ATPase reaction
Dyskusje
The example of a DNA mismatch binding protein described here illustrates the power and utility of transient kinetic methods for studying the mechanisms of biological molecules. Stopped-flow measurements on the single turnover time scale provided unambiguous evidence for rapid and specific binding of Msh2-Msh6 protein to a mismatched base pair and formation of a long-lived protein X DNA complex in the reaction 9. Moreover, stopped-flow (and quench-flow) analysis of ATPase activity provided direct evidence for M...
Podziękowania
This work was supported by an NSF CAREER Award (M.M.H), a Barry M. Goldwater scholarship (F.N.B) and an ASBMB Undergraduate Research Award (C.W.D). The clone for over-expression of PBP was kindly provided by Dr. Martin Webb (MRC, UK).
Materiały
| Name | Company | Catalog Number | Comments |
| 37 G | DNA Sequence: 5’- ATT TCC TTC AGC AGA TAT G T A CCA TAC TGA TTC ACA T -3’ | ||
| 37 T (2-Ap) | DNA Sequence: 5’- ATG TGA ATC AGT ATG GTA TApT ATC TGC TGA AGG AAA T -3’ | ||
| 37 T | DNA Sequence: 5’- ATG TGA ATC AGT ATG GTA T A T ATC TGC TGA AGG AAA T -3’ |
Odniesienia
- Johnson, K. A. Advances in transient-state kinetics. Curr Opin Biotechnol. 9 (1), 87-89 (1998).
- Johnson, K. A. E. . Kinetic analysis of macromolecules. , (2003).
- Obmolova, G., Ban, C., Hsieh, P., Yang, W. Crystal structures of mismatch repair protein MutS and its complex with a substrate DNA. Nature. 407 (6805), 703-710 (2000).
- Lamers, M. H. The crystal structure of DNA mismatch repair protein MutS binding to a G x T mismatch. Nature. 407 (6805), 711-717 (2000).
- Warren, J. J. Structure of the human MutSalpha DNA lesion recognition complex. Mol Cell. 26 (4), 579-592 (2007).
- Kunkel, T. A. &. a. m. p. ;. a. m. p., Erie, D. A. . DNA Mismatch Repair. Annu Rev Biochem. 74, 681-710 (2005).
- Jiricny, J. The multifaceted mismatch-repair system. Nat Rev Mol Cell Biol. 7 (5), 335-346 (2006).
- Hsieh, P., Yamane, K. DNA mismatch repair: Molecular mechanism, cancer, and ageing. Mech Ageing Dev. 129 (7-8), 391-407 (2008).
- Jacobs-Palmer, E., Hingorani, M. M. The effects of nucleotides on MutS-DNA binding kinetics clarify the role of MutS ATPase activity in mismatch repair. J Mol Biol. 366 (4), 1087-1098 (2007).
- Antony, E., Khubchandani, S., Chen, S., Hingorani, M. M., M, M. Contribution of Msh2 and Msh6 subunits to the asymmetric ATPase and DNA mismatch binding activities of Saccharomyces cerevisiae Msh2-Msh6 mismatch repair protein. DNA Repair (Amst). 5 (2), 153-162 (2006).
- Antony, E., Hingorani, M. M. Mismatch recognition-coupled stabilization of Msh2-Msh6 in an ATP-bound state at the initiation of DNA repair. Biochemistry. 42 (25), 7682-7693 (2003).
- Finkelstein, J., Antony, E., Hingorani, M. M., O'Donnell, M. Overproduction and analysis of eukaryotic multiprotein complexes in Escherichia coli using a dual-vector strategy. Anal Biochem. 319 (1), 78-87 (2003).
- Zhai, J., Hingorani, M. M. S. cerevisiae Msh2-Msh6 DNA binding kinetics reveal a mechanism of targeting sites for DNA mismatch repair. Proc Natl Acad Sci U S A. 107 (2), 680-685 (2010).
- Brune, M., Hunter, J. L., Corrie, J. E., Webb, M. R. Direct, real-time measurement of rapid inorganic phosphate release using a novel fluorescent probe and its application to actomyosin subfragment 1 ATPase. Biochemistry. 33 (27), 8262-8271 (1994).
- Brune, M. Mechanism of inorganic phosphate interaction with phosphate binding protein from Escherichia coli. Biochemistry. 37 (29), 10370-10380 (1998).
- Antony, E., Hingorani, M. M. Asymmetric ATP binding and hydrolysis activity of the Thermus aquaticus MutS dimer is key to modulation of its interactions with mismatched DNA. Biochemistry. 43 (41), 13115-13128 (2004).
- Gradia, S., Acharya, S., Fishel, R. The human mismatch recognition complex hMSH2-hMSH6 functions as a novel molecular switch. Cell. 91 (7), 995-1005 (1997).
- Mazur, D. J., Mendillo, M. L., Kolodner, R. D., D, R. Inhibition of Msh6 ATPase activity by mispaired DNA induces a Msh2(ATP)-Msh6(ATP) state capable of hydrolysis-independent movement along DNA. Mol Cell. 22 (1), 39-49 (2006).
Przedruki i uprawnienia
Zapytaj o uprawnienia na użycie tekstu lub obrazów z tego artykułu JoVE
Zapytaj o uprawnieniaPrzeglądaj więcej artyków
This article has been published
Video Coming Soon
Copyright © 2025 MyJoVE Corporation. Wszelkie prawa zastrzeżone