Aby wyświetlić tę treść, wymagana jest subskrypcja JoVE. Zaloguj się lub rozpocznij bezpłatny okres próbny.
Method Article
Measuring Cell Cycle Progression Kinetics with Metabolic Labeling and Flow Cytometry
W tym Artykule
Podsumowanie
Tracking subtle changes in the progression and kinetics of cell cycle stages can be accomplished by use of a combination of metabolic labeling of nucleic acids with BrdU and total genomic DNA staining via Propidium Iodide. This method avoids the need of chemical synchronization of cycling cells, thereby preventing the introduction of non-specific DNA damage, which in turn affects cell cycle progression.
Streszczenie
Precise control of the initiation and subsequent progression through the various phases of the cell cycle are of paramount importance in proliferating cells. Cell cycle division is an integral part of growth and reproduction and deregulation of key cell cycle components have been implicated in the precipitating events of carcinogenesis 1,2. Molecular agents in anti-cancer therapies frequently target biological pathways responsible for the regulation and coordination of cell cycle division 3. Although cell cycle kinetics tend to vary according to cell type, the distribution of cells amongst the four stages of the cell cycle is rather consistent within a particular cell line due to the consistent pattern of mitogen and growth factor expression. Genotoxic events and other cellular stressors can result in a temporary block of cell cycle progression, resulting in arrest or a temporary pause in a particular cell cycle phase to allow for instigation of the appropriate response mechanism.
The ability to experimentally observe the behavior of a cell population with reference to their cell cycle progression stage is an important advance in cell biology. Common procedures such as mitotic shake off, differential centrifugation or flow cytometry-based sorting are used to isolate cells at specific stages of the cell cycle 4-6. These fractionated, cell cycle phase-enriched populations are then subjected to experimental treatments. Yield, purity and viability of the separated fractions can often be compromised using these physical separation methods. As well, the time lapse between separation of the cell populations and the start of experimental treatment, whereby the fractionated cells can progress from the selected cell cycle stage, can pose significant challenges in the successful implementation and interpretation of these experiments.
Other approaches to study cell cycle stages include the use of chemicals to synchronize cells. Treatment of cells with chemical inhibitors of key metabolic processes for each cell cycle stage are useful in blocking the progression of the cell cycle to the next stage. For example, the ribonucleotide reductase inhibitor hydroxyurea halts cells at the G1/S juncture by limiting the supply of deoxynucleotides, the building blocks of DNA. Other notable chemicals include treatment with aphidicolin, a polymerase alpha inhibitor for G1 arrest, treatment with colchicine and nocodazole, both of which interfere with mitotic spindle formation to halt cells in M phase and finally, treatment with the DNA chain terminator 5-fluorodeoxyridine to initiate S phase arrest 7-9. Treatment with these chemicals is an effective means of synchronizing an entire population of cells at a particular phase. With removal of the chemical, cells rejoin the cell cycle in unison. Treatment of the test agent following release from the cell cycle blocking chemical ensures that the drug response elicited is from a uniform, cell cycle stage-specific population. However, since many of the chemical synchronizers are known genotoxic compounds, teasing apart the participation of various response pathways (to the synchronizers vs. the test agents) is challenging.
Here we describe a metabolic labeling method for following a subpopulation of actively cycling cells through their progression from the DNA replication phase, through to the division and separation of their daughter cells. Coupled with flow cytometry quantification, this protocol enables for measurement of kinetic progression of the cell cycle in the absence of either mechanically- or chemically- induced cellular stresses commonly associated with other cell cycle synchronization methodologies 10. In the following sections we will discuss the methodology, as well as some of its applications in biomedical research.
Protokół
1. Cell Preparation

- Plate cells to achieve a density of approximately 60% confluency. Cells must be in log phase at the time of collection. For mcf7 cells, this is accomplished by seeding at 5 x 10⁵ cells / 10 cm plate in the appropriate media. HT29 and LS180 cells are seeded at 6 x 10⁵ cells / 6 cm plate. We used DMEM media supplemented with 10% FBS and 1x penicillin/streptomycin. Be sure to seed plates for the correct positive and negative controls in addition to your test samples. They include the following:
| i | positive control | BrdU only |
| ii | positive control | PI only |
| iii | negative control | BrdU negative, PI negative |
(It should be noted that a preliminary experiment with multiple timepoints such as the one outlined in this protocol can be used to narrow down the time frame during which to carry out future collections.)
- The plated cells are incubated at 37 °C, 5% CO2 for 24-48 h, thereby allowing cells to recover and attach.
- To pulse label cells with bromodeoxyuridine (BrdU), DMEM is replaced with fresh media containing 10 μM BrdU. Cells are incubated for 1 h at 37 °C, 5% CO2 to allow for BrdU incorporation into the DNA. Be sure to leave one plate untreated to act as the negative control.
- The pulse-labeling media is removed and the cells are rinsed briefly with 1X PBS.
- Fresh growth media is added (minus the BrdU) and cells are allowed to continue to incubate at 37 °C, 5% CO2 until the appropriate timepoint for harvesting is reached.
2. Harvesting and Fixation
- Untreated cells from step 1.3 are considered the zero timepoint. This sample can be harvested together with the 1 h timepoint which is collected immediately after BrdU treatment.
- To harvest the cells, media is removed and the plates are rinsed once with 1X PBS.
- Cells are trypsinized, collected in culturing media and subsequently pelleted by centrifugation at 1500 rpm for 5 min Supernatant is discarded.
- Rinse 1-10 x 106 cells in 5 ml ice cold 1X PBS. Centrifuge at 1500 rpm for 5 min Supernatant is discarded.
- The cell pellet is then resuspended in 100 μl of ice-cold PBS/1% FBS. Addition of 1% FBS in PBS aids in preventing cell clumping.
- Add these cells drop by drop to 5 ml of -20 °C, 70% ethanol to fix the cells.
- Incubate on ice for 30 min or store at 4 °C overnight. This is an ideal step at which to stop the collection of samples from the various timepoints. The samples can be left in ethanol for several days, allowing them to be processed simultaneously through the remainder of the protocol.
3. BrdU and PI Staining
- Pellet cells by centrifugation for 5 min at 1500 rpm.
- Remove the fixative, but leave ~50 μl in which to loosen the pellet by vortexing.
- To denature the DNA, slowly add 1 ml of 2N HCL/Triton X-100 dropwise while vortexing. Incubate samples at room temperature for 30 min.
- Pellet cells by centrifuging samples for 5 min at 1500 rpm. Aspirate and discard the supernatant.
- Resuspend the cell pellet in 1 ml of 0.1M sodium tetraborate, pH 8.5, to neutralize the denaturation step.
- Centrifuge cells for 5 min at 1500 rpm. Aspirate and discard the supernatant.
- Resuspend the cell pellet in 75 μl of BrdU staining mix (50 μl 0.5% tween 20/1% BSA/PBS + 20 μl FITC conjugated anti-BrdU + 5 μl 10 mg/ml RNase).
- Incubate at room temperature for 45 min protected from light.
- To pellet cells, centrifuge the samples for 5 min at 1500 rpm. Aspirate and discard the supernatant.
- Resuspend the cell pellet in 1 ml of PBS containing 5 μg/ml propidium iodide.
4. Flow Cytometry
- To analyze the cells, a flow cytometer equipped with a 488 nm laser and the appropriate filters is necessary. Analysis software such as CellQuest is necessary to create the plots outlined below.
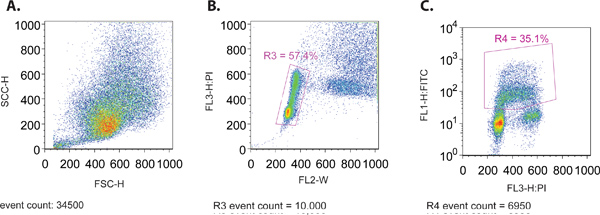
- When running the sample through the flow cytometer, create a forward scatter (SSC-H) vs. side scatter (FSC-H) plot to ensure the proper size distribution of cells (Figure 1A). Both of these parameters are plotted on a linear scale.
- Simultaneously view a plot of FL3-H (PI stain) vs. FL2-W (Figure 1B). This plot is used to create a gate (R3) to isolate the fraction of cells that are within the normal distribution pattern of the cell cycle. In general, this distribution pattern is characterized by two clusters of cells from the 2N and 4N DNA content of PI staining representing the G1 and G2 phases of the cell cycle, respectively. A string of cells located between these 2 clusters is representative of ongoing DNA replication that occurs in the S phase of the cell cycle.
- Create a plot displaying the gated cells (R3) from step 4.3, with FL1-H (FITC, log plot) on the y-axis and PI (linear plot) on the x-axis (Figure 1C). This plot will be used to set the remaining parameters using the various controls outlined in 1.1, as well as to collect data for analysis.
- Place the PI only stained sample onto the cytometer. Adjust the gain to place G1 at ~200 on the x-axis. This will be easier to visualize in a histogram plot of the PI stain.
- A second control involves running a BrdU-only sample on the flow cytometer. Adjust the gain so that the 2 populations of cells (BrdU positive vs. BrdU negative) appear on the plot. Ideally, the BrdU negative cells are positioned to appear just below 10-1.
- The final control is the BrdU/PI negative sample. Run this negative control to ensure that cells do not appear in any of the upper or right hand quadrants.
- Once the parameters of the various plots have been set, the flow cytometer is calibrated and ready for processing of BrdU and PI stained cells. A minimum of 10,000 cells that are gated in the correct PI fraction (refer to step 4.3) must be read per collection.
- To analyze the collected data, software such as FlowJo or FacsDiva are utilized. Each of the above mentioned plots can be recreated in these programs and quantitative and statistical analysis performed.
- The endpoint of the analysis involves several successive steps. Creating a plot of FITC vs. PI with cells gated as PI positive from the PI vs. FL2-W plot allows one to distinguish the cycling population. A second gate is created from this plot by isolating the BrdU positive population. Expressing this distinctive population on a histogram plot with PI on the x-axis allows one to track the time course of cell cycle progression. This can be further visualized by plotting the number of BrdU-positive cells with G1 or G2 content as a function of time.
5. Representative Results
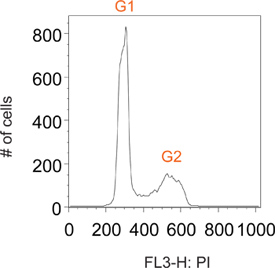
Normally cycling cells stained with propidium iodide have distinct peaks at G1 and G2, corresponding to cells containing 2N and 4N DNA content, respectively (Figure 2). Pulse labeling with BrdU allows for selective labeling of a sub-population of cells that are actively synthesizing DNA (i.e. S phase). Shortly after removal of the BrdU reagent, all labeled cells are in S phase (Figure 3). By restricting labeling to a short pulse one is able to follow this now distinct sub-population of cells throughout numerous time points as they pass through the subsequent phases of the cell cycle. This can be visualized at the 1 h time point in Figure 3 as a distinct lack of G1 and G2 peaks.
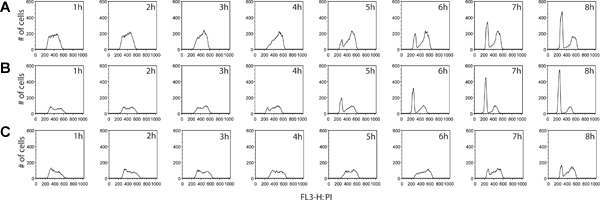
Additional information can be derived from the BrdU labeling step. Not only can the proportion of actively dividing cells be measured, but an estimate of cell cycle stage distribution between two samples can be determined as well. By collecting cells at equally spaced intervals following the removal of the BrdU reagent, cells can be traced as they continue to cycle, progress to G2 and ultimately move through to cell division of the original cells, finally emerging as BrdU-positive daughter cells with G1 DNA content (Figure 4). An example of cell cycle phase quantification and kinetic analysis is provided in Figure 5.

Figure 1. (A) Forward Scatter versus Side Scatter Plot of a representative mcf7 cell population. (B) PI versus Width (FL-W) Plot of a representative mcf7 cell population. Gating is shown to exclude cell doublets in the final analysis (R3). Cell doublets will have greater pulse width than a single cell, as they take longer to pass through the laser beam and therefore can be excluded from the analysis. (C) PI versus FITC (BrdU) Plot of a representative mcf7 cell population. Gating is shown to include only the FITC (BrdU) positive cells (R4).

Figure 2. Representative histogram plot of a total population of normally cycling cells.

Figure 3. Histogram plot of cells that have been collected 1h after the removal of the BrdU pulse, after gating for FITC (BrdU)-positive cells. BrdU-positive cells at an early timepoint following the removal of label show PI profiles that correspond to samples displaying DNA content consistent with cells that are in the S-phase of the cell cycle, confirming the successful labeling of cells only during DNA synthesis.

Figure 4. Comparison of cell cycle progression kinetics between cancer cell lines, colorectal cancers HT29 (A) and LS180 (B), as well as breast cancer mcf7 (C). Cells were collected every hour for 8 hours, following the removal of the BrdU pulse. In this experiment, we observed a clear profile of accelerated cell cycle progression through the G2 phase of the cell cycle in the colorectal cell line LS180. Comparing the kinetics between the two profiles of colorectal cancer cells, the emergence of a G1 peak is evident at T= 4h post-BrdU in the LS180 cells, compared with the corresponding time point for the HT-29 cell line which lacks this peak. Compared with either one of the two colorectal cell lines, mcf7 cells are cycling at a significantly reduced rate. Click here to view larger figure.

Figure 5. (A) Quantitative cell cycle phase analysis of BrdU-labeled cancer cells. The Dean/Jett/Fox algorithm was applied to HT29, LS180 and mcf7 (illustrated in green). The resulting cell cycle phase distributions from each sample are expressed as % total BrdU-positive cells for each phase. Only select time points for each cell line are displayed, as the analyses for some of the earlier time points produced invalid results. In these earlier time points, all BrdU-positive cells are in S-phase and therefore lack distinct G1 and G2 peaks, which are necessary for algorithm application. (B) Histograms of cancer cells showing the kinetics of progression through G2/M phases of the cell cycle. Progression through G2/M phases is fastest for LS180 cells, followed by HT29 and mcf7. Click here to view larger figure.

Figure S1. Flow cytometry controls. mcf7 cells are shown as (A) negative control where cells are neither PI nor BrdU stained. (B) PI only stained. (C) BrdU-FITC labeled samples.

Figure S2. Schematic illustration showing the relationship between fluorescent emission spectrum of PI versus FITC (BrdU). The spectral collection windows for fluorescent channel 1 (FL1, for FITC) and fluorescent channel 3 (FL3, for PI) are shown in corresponding boxes. There is no fluorophore spectra overlap between FL1 and FL3 detection. Evidently, fluorescence compensation is not necessary when experimental data from PI and FITC-BrdU co-labeled cells are collected in the FL1/FL3 channels respectively. Fluorescence spectrums were obtained from BD BioSciences website: http://www.bdbiosciences.com/research/multicolor/spectrum_viewer. Click here to view larger figure.
Access restricted. Please log in or start a trial to view this content.
Dyskusje
By combining flow cytometry with BrdU incorporation, we have the necessary tools to study cell cycle kinetics. The distinctive property of BrdU to function as a thymidine analogue is what allows for DNA content quantification of a cycling cell. The incorporation of BrdU into a growing daughter DNA strand during the synthesis phase of the cell cycle is what allows one to follow a subpopulation of cycling cells through the replication of DNA in S phase, to a period of growth at G2 and ultimately to cell division. Daught...
Access restricted. Please log in or start a trial to view this content.
Ujawnienia
We have nothing to disclose.
Podziękowania
We thank Andy Johnson of the Biomedical Research Center at UBC for assistance with FACS analysis. Cancer Research Funding in the Wong Laboratory is provided by the Canadian Cancer Society Research Institute (operating grant #019250) and from Research Reinvestment funds of the Faculty of Pharmaceutical Sciences, UBC. JMYW is supported by the Canada Research Chairs and the Michael Smith Foundation for Health Research Career Development programs.
Access restricted. Please log in or start a trial to view this content.
Materiały
| Name | Company | Catalog Number | Comments |
| bromodeoxyuridine | BD Biosciences | 55089 | |
| propidium iodide | Sigma-Aldrich | 287075 | 1mg/ml stock |
| FITC anti-BrdU | BD Biosciences | 347583 | |
| sodium tetraborate | Fisher Scientific | S80172 | 0.1M, pH 8.5 |
| FACS Caliber | BD Biosciences |
Odniesienia
- Musgrove, E. A., Caldon, C. E., Barraclough, J., Stone, A., Sutherland, R. L. Cyclin D as a therapeutic target in cancer. Nat. Rev. Cancer. 11, 558-572 (2011).
- Molchadsky, A., Rivlin, N., Brosh, R., Rotter, V., Sarig, R. p53 is balancing development, differentiation and de-differentiation to assure cancer prevention. Carcinogenesis. 31, 1501-1508 (2010).
- Dickson, M. A., Schwartz, G. K. Development of cell-cycle inhibitors for cancer therapy. Curr. Oncol. 16, 36-43 (2009).
- Banfalvi, G. Cell cycle synchronization of animal cells and nuclei by centrifugal elutriation. Nat. Protoc. 3, 663-673 (2008).
- van Opstal, A., Boonstra, J. Inhibitors of phosphatidylinositol 3-kinase activity prevent cell cycle progression and induce apoptosis at the M/G1 transition in CHO cells. Cell Mol. Life Sci. 63, 220-228 (2006).
- Gasnereau, I. Flow cytometry to sort mammalian cells in cytokinesis. Cytometry. A. 71, 1-7 (2007).
- Harper, J. V. Synchronization of cell populations in G1/S and G2/M phases of the cell cycle. Methods Mol. Biol. 296, 157-166 (2005).
- Pedrali-Noy, G. Synchronization of HeLa cell cultures by inhibition of DNA polymerase alpha with aphidicolin. Nucleic Acids Res. 8, 377-387 (1980).
- Merrill, G. F. Cell synchronization. Methods Cell Biol. 57, 229-249 (1998).
- Fleisig, H. B., Wong, J. M. Telomerase promotes efficient cell cycle kinetics and confers growth advantage to telomerase-negative transformed human cells. Oncogene. , (2011).
- Cai, D., Byth, K. F., Shapiro, G. I. AZ703, an imidazo[1,2-a]pyridine inhibitor of cyclin-dependent kinases 1 and 2, induces E2F-1-dependent apoptosis enhanced by depletion of cyclin-dependent kinase 9. Cancer Res. 66, 435-444 (2006).
- Pozarowski, P., Darzynkiewicz, Z. Analysis of cell cycle by flow cytometry. Methods Mol. Biol. 281, 301-311 (2004).
- Sherwood, S. W., Rush, D. F., Kung, A. L., Schimke, R. T. Cyclin B1 expression in HeLa S3 cells studied by flow cytometry. Exp. Cell Res. 211, 275-281 (1994).
Access restricted. Please log in or start a trial to view this content.
Przedruki i uprawnienia
Zapytaj o uprawnienia na użycie tekstu lub obrazów z tego artykułu JoVE
Zapytaj o uprawnieniaPrzeglądaj więcej artyków
This article has been published
Video Coming Soon
Copyright © 2025 MyJoVE Corporation. Wszelkie prawa zastrzeżone