Object Substitution Masking
Source: Laboratory of Jonathan Flombaum—Johns Hopkins University
Visual masking is a term used by perceptual scientists to refer to a wide range of phenomena in which in an image is presented but not perceived by an observer because of the presentation of a second image. There are several different kinds of masking, many of them relatively intuitive and unsurprising. But one surprising and important type of masking is called Object Substitution Masking. It has been a focus of research in vision science since it was discovered, relatively recently, around 1997 by Enns and Di Lollo.1
This video will demonstrate standard procedures for how to conduct an object substitution experiment, how to analyze the results, and it will also explain the hypothesized causes for this unusual form of masking.
1. Stimuli and design
- To run this experiment, you will need a programming environment such as MATLAB or experimental sequencing software such as E-Prime.
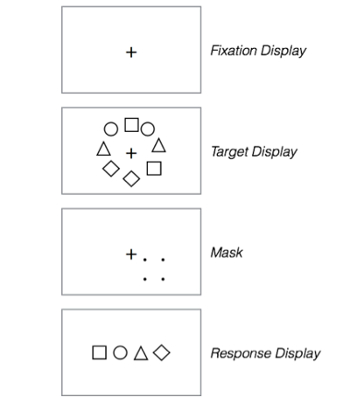
- Each trial will consist of four basic components: A fixation cross, a shape stimulus display (called the target display), a mask (four dots), and a response display. Figure 1 depicts the four primary elements in each trial.
- The display background will always be white.
- The fixation cross is a small cross in th
Figure 5 graphs average response accuracy across participants as a function of SOA. As the graph should make clear, an ANOVA analysing these results would probably show a significant effect of SOA. What kind of effect does it show? It appears that with very large SOAs, negative or positive, the mask does nothing-performance in the task is very good. When separated by 150 or 300 ms, the mask and the target stimulus are really just separate events. But these are crit
Among the many applications of Object Substitution Masking in recent years are studies that have utilized it in conjunction with neurophysiological techniques in order to isolate brain circuits involved in the production of conscious experience. Hirose and colleagues2 in 2005 conducted an experiment using a technique known as repeated Transcranial Magnetic Stimulation (rTMS): Researchers use a magnetic coil to induce small electrical potentials in the brain of a subject, and repeated induction can cause a smal
- Enns, J. T., & Di Lollo, V. (1997). Object substitution: A new form of masking in unattended visual locations. Psychological Science, 8(2), 135-139.
- Hirose, N., Kihara, K., Tsubomi, H., Mima, T., Ueki, Y., Fukuyama, H., & Osaka, N. (2005). Involvement of V5/MT+ in object substitution masking: evidence from repetitive transcranial magnetic stimulation. Neuroreport,16(5), 491-494.
- Goodhew, S. C., Visser, T. A., Lipp, O. V., & Dux, P. E. (2011). Implicit semantic perception in object substitution masking. Cognition, 118(1), 130-134.
Przejdź do...
Filmy z tej kolekcji:

Now Playing
Object Substitution Masking
Sensation and Perception
6.4K Wyświetleń

Color Afterimages
Sensation and Perception
11.0K Wyświetleń

Finding Your Blind Spot and Perceptual Filling-in
Sensation and Perception
17.2K Wyświetleń

Perspectives on Sensation and Perception
Sensation and Perception
11.7K Wyświetleń

Motion-induced Blindness
Sensation and Perception
6.8K Wyświetleń

The Rubber Hand Illusion
Sensation and Perception
18.2K Wyświetleń

The Ames Room
Sensation and Perception
17.2K Wyświetleń

Inattentional Blindness
Sensation and Perception
13.2K Wyświetleń

Spatial Cueing
Sensation and Perception
14.8K Wyświetleń

The Attentional Blink
Sensation and Perception
15.8K Wyświetleń

Crowding
Sensation and Perception
5.7K Wyświetleń

The Inverted-face Effect
Sensation and Perception
15.4K Wyświetleń

The McGurk Effect
Sensation and Perception
15.9K Wyświetleń

Just-noticeable Differences
Sensation and Perception
15.3K Wyświetleń

The Staircase Procedure for Finding a Perceptual Threshold
Sensation and Perception
24.2K Wyświetleń
Copyright © 2025 MyJoVE Corporation. Wszelkie prawa zastrzeżone