Method Article
Microarray-based Identification of Individual HERV Loci Expression: Application to Biomarker Discovery in Prostate Cancer
In This Article
Summary
Human endogenous retroviruses (HERV), which occupy 8% of the human genome, retain scarce coding capacities but a hundred thousand long terminal repeats (LTRs). A custom Affymetrix microarray was designed to identify individual HERV locus expression and was used on prostate cancer tissues as a proof of concept for future clinical studies.
Abstract
The prostate-specific antigen (PSA) is the main diagnostic biomarker for prostate cancer in clinical use, but it lacks specificity and sensitivity, particularly in low dosage values1. ‘How to use PSA' remains a current issue, either for diagnosis as a gray zone corresponding to a concentration in serum of 2.5-10 ng/ml which does not allow a clear differentiation to be made between cancer and noncancer2 or for patient follow-up as analysis of post-operative PSA kinetic parameters can pose considerable challenges for their practical application3,4. Alternatively, noncoding RNAs (ncRNAs) are emerging as key molecules in human cancer, with the potential to serve as novel markers of disease, e.g. PCA3 in prostate cancer5,6 and to reveal uncharacterized aspects of tumor biology. Moreover, data from the ENCODE project published in 2012 showed that different RNA types cover about 62% of the genome. It also appears that the amount of transcriptional regulatory motifs is at least 4.5x higher than the one corresponding to protein-coding exons. Thus, long terminal repeats (LTRs) of human endogenous retroviruses (HERVs) constitute a wide range of putative/candidate transcriptional regulatory sequences, as it is their primary function in infectious retroviruses. HERVs, which are spread throughout the human genome, originate from ancestral and independent infections within the germ line, followed by copy-paste propagation processes and leading to multicopy families occupying 8% of the human genome (note that exons span 2% of our genome). Some HERV loci still express proteins that have been associated with several pathologies including cancer7-10. We have designed a high-density microarray, in Affymetrix format, aiming to optimally characterize individual HERV loci expression, in order to better understand whether they can be active, if they drive ncRNA transcription or modulate coding gene expression. This tool has been applied in the prostate cancer field (Figure 1).
Introduction
Human endogenous retroviruses (also called HERVs) are spread throughout our genome. They originate from ancestral and independent infections within the germ line, followed by copy-paste propagation processes and leading to multicopy families. Today, they are no more infectious but they occupy 8% of the human genome; as a point of comparison, exons span 2% of the human genome. Data from the ENCODE project published in 2012 showed that different RNA types cover about 62% of the genome, including one third in intergenic regions. Moreover, it appears that the amount of transcriptional regulatory motifs is at least 4.5x higher than the one corresponding to protein-coding exons. HERVs long terminal repeats (LTR) represent a broad range of potential transcriptional regulatory elements, as it is their usual function in infectious retroviruses. Historically, apart from a few loci expressed in the placenta or testis, it was commonly believed that HERV are silent due to epigenetic regulation. Therefore, we have designed a high-density microarray, in Affymetrix format, aiming to optimally characterize individual HERV loci expression, in order to better understand whether they are active, if they drive lncRNA transcription or modulate coding gene expression. This tool dubbed HERV-V2 GeneChip integrates 23,583 HERV probesets and can discriminate 5,573 distinct HERV elements composed of solo LTRs as well as complete and partial proviruses (Figure 2).
Diagnosis, Assessment, and Plan:
Diagnosis of prostate cancer is based on dosage of the prostate specific antigen (PSA) biomarker in clinical laboratory, a digital rectal examination to evaluate morphological alteration of the prostate and finally prostate biopsies observed by the pathologist. The lack of sufficient specificity and sensitivity among conventional cancer biomarkers, such as PSA for prostate cancer, has been widely recognized after several decades of clinical implications1. Initially, PSA was proposed for the diagnosis and treatment of adenocarcinoma of the prostate11. It was latter proposed for cancer screening and monitoring the development of the disease12. However, there remains a question which is regularly asked: ‘how to use PSA'. (i) A gray zone corresponding to a concentration in serum of 2.5-10 ng/ml does not allow a clear difference to be made between cancer and noncancer2; (ii) two large cohort studies enrolling hundreds of thousands of people in Europe and USA failed to come to a clear conclusion about the usefulness of screening in terms of disease specific mortality13,14; (iii) analysis of post-operative PSA kinetic parameters such as PSA clearance, PSA velocity and doubling time, although simple in theory, can pose considerable challenges in practical application3,4. We may expect that in the coming years, biomarker applications will support a clinical choice between watchful waiting and more or less aggressive treatments depending on tumor phenotype. Concerning the diagnosis rendered by the pathologist, a first limiting factor comes from a 20% false negative diagnosis within prostate biopsies (many cancers are missed by sampling). A second concern deals with the need for an additional biopsy procedure following a negative one, which may present adverse effects.
Radical prostatectomy is currently one of the standard treatments for prostate cancer. It is proposed in healthy patients, aging from 45-65 years, especially in the case of aggressive patterns (Gleason 7 to 10), multifocal tumor or palpable tumor. It is now done in our department using robotic assisted surgery. Because of the growing evidence that molecular markers will have paramount importance in the coming years, we decided to propose to all our patients the possibility of participating in a program for prostate tissue banking. More precisely, the expanding molecular research programs on prostate cancer have resulted in an increasing requirement for access to high quality fresh tumor tissues from prostatectomy specimens. This research, in particular the genomic approaches, required large samples of high DNA/RNA quality. Tumoral and adjacent ‘non tumoral' tissues from the same patient are needed. Recommendations for handling and processing radical prostatectomies are designed to preserve pathological features that determine stage and margin status and thereby potential further treatment and prognosis. Any fresh tissue sampling method, therefore, should not compromise subsequent pathological assessments in order to be acceptable to the diagnosis. Macroscopic dissection of the prostate is difficult and great attention needs to be paid to margin tissues and capsular invasion: any dissection for prostate banking should be always conducted by a trained uropathologist according to an agreed protocol. The ethics committee of the medical faculty and the state medical board agreed to these investigations and informed consent was obtained for all patients included in the prostate tissues banking.
Protocol
1. Surgery
Once removed by the surgeon, keep the prostate on ice until taken in charge of by a pathologist.
2. Handling of Prostate Tissues
- To respect the delay of perioperative ischemia, transfer radical prostatectomy specimens on ice to the laboratory by dedicated staff within 30 min after surgical ablation. The delay of freezing should be less than 20-30 min (Figure 3A).
- Weigh and stain the prostate according to the usual protocol (e.g. green on the right side, black on the left side, see Figures 3B and 3C).
- Perform a large transverse section of the gland on the posterior side (Figure 3D). Orient the prostate and put it on the anterior side. Perform a large transverse section of the gland on the posterior side with a sterile surgical knife.
- Dissect pieces of tissue on the transition zone, on the left and right peripheral zones, leaving the margins intact (Figure 3E).
- Put the cores of tissue in an Eppendorf tube, snap freeze and store in liquid nitrogen (Figure 3F). If you are not making biobank proceed directly with step 2.7.
- Perform prostate banking only if the total length of cancer on biopsies is superior to 10 mm. Use a suture thread to close the prostate and to prevent gland distortion and minimal disruption of the surgical margin (Figure 3G). Then fix the radical prostatectomy specimen with formalin and embed in paraffin according to the usual procedure for histological analysis.
- Mount frozen tissue cores vertically upon a small mound of OCT and make sections in a cryostat. Take a first single 5 µm frozen section and stain it with blue toluidine.
- Perform a quick histological examination to analyze the nature of the tissue (i.e. benign or malignant). For tumoral tissue, estimate the quantity of tumoral cells and select only cores with more than 80% of tumoral cells.
- Following this, perform a new single 5 µm frozen section and stain it with hematoxylin, eosin and Safran. Then, cut 15 sections x 30 µm and place it in a RNAse free Eppendorf tube.
- Take a last 5 µm frozen section for hematoxylin, eosin and Safran and stain it to control the quantity of tumoral cells at the end of the procedure.
- Put the Eppendorf tube in dry ice and send the sample to the molecular biology laboratory.
3. RNA Extraction, Purification, and Quality Control
- Homogenization. Perform homogenization in the presence of 1 ml of Trizol/100 mg tissue until the tissue is completely dissolved in solution. Add Trizol solution gradually and proceed with care on ice using a hand-held grinder. Once homogenized, aliquot the solution to Eppendorf tubes and leave in Trizol at room temp for five minutes.
- Phase separation. Add 300 µl chloroform (or 150 µl BCP/1.5 ml Trizol). Vortex 15 sec then leave at room temp for 2-3 min. Centrifuge at 12,000 x g for 15 min at 2-8 °C.
- RNA precipitation. Transfer carefully the top aqueous phase to a new tube. Add 750 µl isopropanol. Incubate at RT for 10 min (agitate by reversal). Incubate 2 hr at -19 °C/-31 °C. Centrifuge samples at 12,000 x g for 30 min at 2-8 °C.
- RNA wash and suspension. Following centrifugation, remove the supernatant. Wash RNA pellet with 1 ml 80% EtOH (gently reverse the tubes). Centrifuge samples at 7,500 x g for 10 min at 2-8 °C. Remove supernatant using P1000 and P10. Allow remaining EtOH to air dry for 2-3 min. Add 100 µl RNase-free water, transfer tubes to 70 °C heat block and let sit for 2-3 min to dissolve the pellet. Then put on ice. Store at -19 °C/-31 °C for short term storage and -80 °C for long term storage.
- RNA purification. Purify RNA using the RNeasy Mini kit (Qiagen). Briefly, start by adding 350 µl buffer RLT to the 100 µl RNA sample and mix well, then follow the Qiagen procedure. Finally, take a 3 µl (out of 50 µl) aliquot of the purified product for quality controls (step 3.6). Store RNA at -19 °C/-31 °C for a short term period or at -80 °C for a long term storage.
- RNA QC (Figure 4A). Check the quality of RNA and the RNA integrity using a Bioanalyzer (Agilent) and a Nanodrop (Thermo), according to the manufacturer instructions. The RNA Integrity Number (RIN) is used to assess the RNA quality. In particular, succeed in the detection of 18S and 28S peaks is strongly recommended to use the samples in further steps.
4. WT-ovation RNA Amplification
Recommendations to perform the amplification steps using the WT-Ovation amplification kit in optimal conditions:
- Run no fewer than eight amplification samples at a time to ensure pipetting precision. Then, account for 1 waste volume when preparing master mixes that require a splitting of the kit into 3 batches of 8 reactions.
- Always keep thawed reagents and reaction tubes on ice unless otherwise instructed.
- Use only a fresh 80% ethanol solution for purification.
- Do not stop at any stage of the protocol.
- Dilute total RNA to get a concentration of 25 ng/µl. Process 2 µl of the diluted sample.
- Prepare the Poly-A RNA spike-in control solution by a serial dilution of the Poly-A RNA Stock with Poly-A Control Dilution Buffer (Affymetrix), to achieve a 1:25,000 dilution.
Step 1: First Strand cDNA Synthesis from 4.3 - 4.8. The reagents mentioned are referred by the supplier as follows: A1 (First Strand Primer Mix), A2 (First Strand Buffer Mix), A3 (First Strand Enzyme Mix).
- Thaw A1 and A2 at room temperature. Mix by using a vortex-mixer for 2 sec and spin for 2 sec. Then, quickly place on ice. Place A3 on ice.
- Put 2 µl of total RNA (50 ng) in a 0.2 ml PCR tube and add 2 µl of A1 (final volume: 4 µl). Cap and spin the tube for 2 sec.
- Incubate at 65 °C for 5 min then place the tube on ice.
- Prepare the First Strand cDNA Master Mix as follows (given for a single reaction). Mix by pipetting and spin down the Master Mix briefly. Immediately, place on ice.
Reagent Volume First Strand Buffer Mix (A2) 5 µl Poly-A RNA Control (1:25,000) 0.5 µl First Strand Enzyme Mix (A3) 0.5 µl - Add 6 µl of the Master Mix to the RNA/Primer-containing tube. Mix by flicking the tube, spin for 2 sec and quickly place on ice (final volume: 10 µl).
- Incubate at 4 °C for 1 min, then 25 °C for 10 min, then 42 °C for 10 min and then 70 °C for 15 min. Keep cool at 4 °C. Remove the reaction tube from thermal cycler, spin briefly and keep on ice. Continue immediately with the Second Strand cDNA Synthesis step.
Step 2: Second Strand cDNA Synthesis from 4.8 - 4.12. The reagents mentioned are referred by the supplier as follows: B1 (Second Strand Buffer Mix) and B2 (Second Strand Enzyme Mix).
- Spin down B2 and B3 for 2 sec and quickly place on ice. Thaw B1 at room temperature. Mix by using a vortex-mixer for 2 sec, spin for 2 sec and quickly place on ice.
- Prepare a Second Strand Master Mix as follows (given for a single reaction). Mix by pipetting and spin down the Master Mix briefly. Immediately, place on ice.
Reagent Volume Second Strand Buffer Mix (B1) 9.75 µl Second Strand Enzyme Mix (B2) 0.25 µl - Add 10 µl of the Master Mix to each First Strand Reaction tube. Mix by pipetting 3x, spin for 2 sec and place on ice (final volume: 20 µl).
- Incubate at 4 °C for 1 min, then 25 °C for 10 min, then 50 °C for 30 min, and then 70 °C for 5 min. Keep cool at 4 °C. Remove the reaction tube from thermal cycler, spin briefly and keep on ice. Continue immediately with the Post-Second Strand Enhancement step.
Step 3: Post-Second Strand Enhancement from 4.13 - 4.15. The reagents mentioned are referred by the supplier as follows: B1 (Second Strand Buffer Mix), B3 (Reaction Enhancement Enzyme Mix).
- Prepare a Master Mix by combining B1 and B3 Mix as follows (given for a single reaction). Mix by pipetting and spin down the Master Mix briefly. Immediately, place on ice.
Reagent Volume Second Strand Buffer Mix (B1) 1.9 µl Reaction Enhancement Enzyme Mix (B3) 0.1 µl - Add 2 µl of the Master Mix to each Second Strand Reaction tube. Mix by pipetting 3x, spin for 2 sec and place on ice (final volume: 22 µl).
- Incubate at 4 °C for 1 min, then 37 °C for 15 min, and then 80 °C for 20 min. Keep cool at 4 °C. Remove the reaction tube from thermal cycler, spin briefly and place on ice. Continue immediately with the SPIA Amplification step.
Step 4: Single strand cDNA (sscDNA) synthesis by SPIA procedure from 4.16 - 4.19. The reagents mentioned are referred by the supplier as follows: C1 (SPIA Primer Mix), C2 (SPIA Buffer Mix), C3 (SPIA Enzyme Mix).
- Thaw the C1 and C2 at room temperature. Mix by using a vortex-mixer, spin for 2 sec and quickly place on ice. Thaw C3 on ice. Mix the content by gently inverting 5x. Make sure not to introduce air-bubbles. Then, spin for 2 sec and place on ice.
- Prepare a SPIA-Master Mix, accounting for a 0.5 waste volume, as follows. Mix by pipetting and spin down the Master Mix briefly. Immediately, place on ice.
Reagent Volume SPIA-Buffer Mix (C2) 5 µl SPIA-Primer Mix (C1) 5 µl SPIA-Enzyme Mix (C3) 10 µl - Add 20 µl of the SPIA Master Mix to the Enhanced Second Strand Reaction tube. Mix by pipetting 6-8x, spin and quickly place on ice (final volume: 42 µl).
- Incubate at 4 °C for 1 min, then 47 °C for 60 min and then 95 °C for 5 min. Keep cool at 4 °C. Remove the tube from thermal cycler, spin briefly and place on ice.
5. sscDNA Purification and Quality Control
- sscDNA purification. Purify sscDNA using the QIAquik PCR purification kit (Qiagen). Briefly, start by adding 200 µl buffer PB to the 42 µl of amplified cDNA product, mix and load on the column. Then follow the Qiagen procedure. Finally, take a 3 µl (out of 30 µl) aliquot of the sscDNA purified product for quality controls (step 5.2).
- sscDNA yield and size distribution verification (Figure 4B). Check sscDNA yield and size distribution using a Bioanalyzer and a Nanodrop, according to the manufacturer instructions. The size of distribution of amplified cDNA should be typically comprised between 100 and 1,500 bases long with a peak around 600 bases.
6. sscDNA Fragmentation
- Prepare 2 µg of cDNA in 30 µl, adjusting the volume with Nuclease-free water.
- Prepare 1x One-Phor-All Buffer PLUS (OPA), starting from a 10x OPA buffer PLUS solution.
- Prepare 0.2 U/µl DNase I (5-fold dilution of 1 U/µl DNase I).
- Prepare a Fragmentation Master Mix as follows (given for a single reaction):
Reagent Volume 10X One-Phor-All Buffer PLUS 3.6 µl DNase I (0.2 U/µl) 3 µl - Add 6.6 µl of Fragmentation Mix to the 30 µl of sscDNA.
- Spin and incubate at 37 °C for 10 min, then inactivate the DNase I at 95 °C for 10 min and keep on ice. Aliquot 1 µl of the fragmented cDNA for Agilent based-size distribution verification.
- sscDNA size distribution verification (Figure 4C). Check sscDNA size distribution using a Bioanalyzer (Agilent). The size distribution of fragmented cDNA should be typically comprised between 35 and 200 bases.
7. Labeling of Fragmented sscDNA
- Dilute the DLR-1a 7.5 mM to 5 mM in DEPC-water.
- Prepare a labeling Master Mix as follows (given for a single reaction):
Reagent Volume 5x TdT Reaction Buffer 14 µl CoCl2 (25 mM) 14 µl DLR-1a (5 mM) 1 µl Terminal transferase (400 U/µl) 4.4 µl - Add 33.4 µl of the labeling mix to each fragmented cDNA sample.
- Mix by flicking the tube, spin briefly and incubate at 37 °C for 60 min, then keep on ice.
8. Hybridization to the HERV Chip Microarray
- Prewet the HERV GeneChip with 200 µl of PreHybridization Mix (Affymetrix) and incubate at 50 °C, 60 rpm, for 10 min.
- Prepare the Hybridization mix as follows (given for a single reaction):
Reagent Volume Control Oligo B2 (3nM) 3.3 µl 20x Eukaryotic Hybridization Control 10 µl 2x Hybridization Mix 100 µl 99.9% DMSO 17.7 µl - Add the 131 µl of Hybridization Mix to the 69 µl of fragmented and labeled cDNA at room temperature to make a final volume of 200 µl.
- Mix and denature for 2 min at 95 °C, then incubate at 50 °C for 5 min and centrifuge at maximum speed for 5 min.
- Empty the prewetted HERV GeneChip and load the 200 µl target preparation. Apply tough-spots on the two septa.
- Hybridize at 50 °C, 60 rpm, for 18 hr.
- After 18 hr, empty the HERV GeneChip and store the collected hybridization solution at 4 °C. Fill the probe array with 250 µl Wash Buffer A. If the chips are not immediately run onto the fluidics, stored at 4 °C.
9. Washing and Staining
- Run the Fluidics from the GCOS menu bar. In the Fluidics dialog box, select the station of interest (1 - 4), then select Shutdown_450 for all modules, then run. Immerse the 3 Fluidics aspiration lines into Milli-Q water. Follow the LCD screen instructions.
- Apply the Prime_450 program to all modules. Place the tubing for Wash Buffer A in a bottle containing 400 ml Wash Buffer A, and the one for Wash Buffer B in a bottle containing 200 ml Wash Buffer B. Then again, follow the LCD screen instructions.
- Lift up the needles and place 600 µl stain cocktail 1 (SAPE Solution Mix) and 600 µl stain cocktail 2 (Antibody Solution Mix)-containing microcentrifuge tubes at positions # 1 and # 2, and 800 µl array holding buffer solution at position # 3.
- Assign the right chip to each module, select the FS450-004 protocol and run each module, following instructions on screen.
10. Scanning
- Warm up the GS3000 scanner. It is ready to scan when the light turns green.
- Apply tough-spots onto the septa to avoid leaking then load the chip into the autoloader or alternatively directly into the scanner. Start scanning.
- After scanning the chip, .cel files are generated. Check the image and align the grid to the spot to identify the probe cells (Figures 4D-F).
11. Data Analysis
- Quality control. Refer to the standard Affymetrix controls to verify that the HERV-V2 chips meet the QC criteria. For this purpose the following representations can be used: the log intensity value distribution (density plots and box plots), the median absolute deviation (MAD) versus the intensity median (MAD-Med) plots, the background plots, the normalized unscaled standard error (NUSE) plots and the relative log expression (RLE) plots.
- Normalization. In addition, the dataset should be explored to highlight unexpected batch effects and to correct them before statistical analysis. The data preprocessing thus includes a background correction (e.g. based on the tryptophan probe baseline signal), followed by RMA normalization and summarization15.
- Data mining and search for differential expressed genes. Normalize the chips and apply a hierarchical clustering approach to explore the dataset (Figure 6A). Then, perform a search for differentially expressed genes (DEG) by using a classical significant analysis of microarray (SAM) procedure16 followed by a false discovery rate (FDR) correction17. Note that these steps are fully integrated in some software analysis suites like Partek GS but can alternatively be performed using the R statistical software18 with packages from the Bioconductor project19. After the statistical analysis, filter the dataset to exclude the probesets for which expression values are less than 26.
- Visualization and interpretation. Interpret the results from the HERV-V2 microarray in a dedicated interface using annotation databases.
Results
The value of transcriptomic studies lies primarily in the quality of the starting biological material. If the RNA extraction is performed in optimal conditions, the RNA Integrity Number (RIN) is typically 7 or greater (Figure 4A). The need to hybridize 2 µg of cDNA on the Affymetrix HERV-V2 chip implies the use of an amplification process. A successful amplification step leads to a bell-shaped distribution (Figure 4B). Then, DNAse1 fragmentation is performed in order to homogenize the cDNA size distribution around 100 nucleotides before hybridization (Figure 4C). After hybridization and scanning (Figure 4D), a visual inspection of the image enables one to check if the grid is well aligned to the spots (Figure 4E) and if hybridization controls are consistent (Figure 4F). This step is also useful in order to exclude microarrays in which air-bubbles or errors occurred during the experiment.
Once the chips have passed QC (Figure 5) and after normalization, the statistical analysis of 5 match-pair tumor and normal prostate RNA samples from the Lyon-Sud Hospital led to the identification of 207 HERV probesets with differential expression values (p.val <0.05) (Figure 6A). To support these records and to gain prostate-specific information, 35 additional match-pair samples (colon, ovary, testis, breast, lung and prostate) were added to the analysis and the SAM-FDR procedure (FDR = 20%) eventually identified 44 prostate specific HERV probesets. Among them, the most relevant 10 HERV structures are described (Figure 6B). Further clinical studies will be required to assess the values of sensitivity and specificity of these candidate biomarkers.
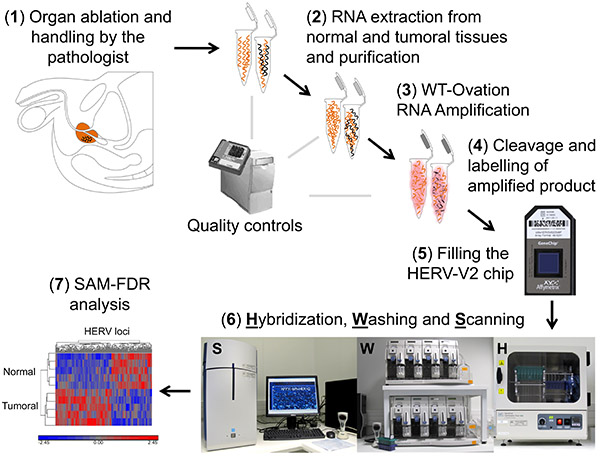
Figure 1. Scheme of the overall procedure from the clinic (1: prostatectomy by the clinician and the tissue preparation by the pathologist) to the bench (2-6: sample preparation, target preparation, microarray processing) leading to the identification of candidate biomarkers (7: biocomputing analysis of the HERV microarrays). Nucleic acids derived from normal tissue are depicted in orange; nucleic acids derived from tumoral area consist of a mix of normal (orange) and tumor specific (black) nucleic acids. Click here to view larger image.
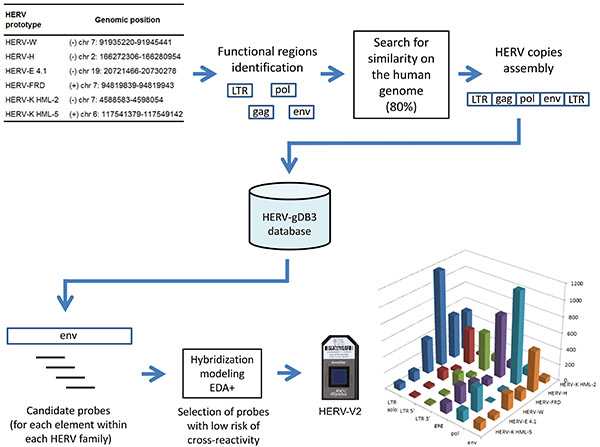
Figure 2. Conception and content of the HERV-V2 chip: HERV sequences retrieved from the human genome are stored in a database called HERV-gDB3, then the 25-mer candidate probes pass through a dedicated hybridization modeling procedure (EDA+) before being eventually synthesized on the array (the resulting targeted sub-regions are depicted for each family). Click here to view larger image.
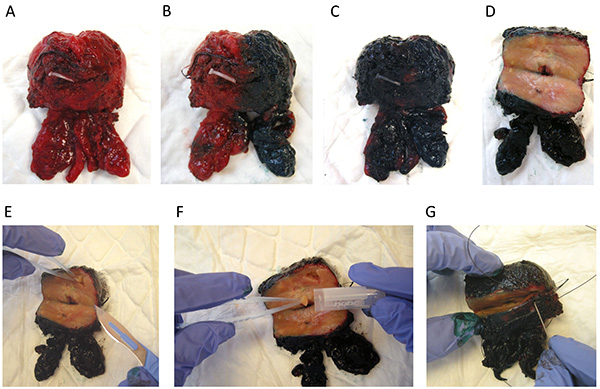
Figure 3. Prostate handling by the pathologist. (A) Fresh radical prostatectomy specimen is transferred to the laboratory. (B-C) The prostate is stained (green on the right side, black on the left side). (D) Large transverse section of the gland on the posterior side. (E) Leaving the margins intact, pieces of tissues are dissected from different areas of the prostate gland. (F) Cores of tissue are placed in an Eppendorf tube. (G) Suture thread is used to close the prostate and to prevent gland distortion and minimal disruption of the surgical margin. Then, the radical prostatectomy specimen is ready for fixing in formalin according to the usual procedure for histological analysis. Click here to view larger image.
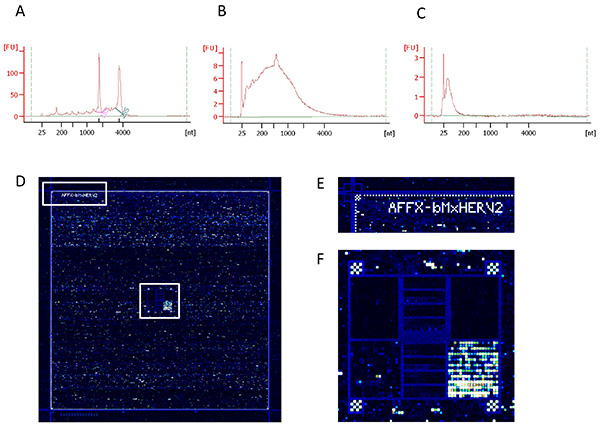
Figure 4. Quality controls of nucleic acid preparation and hybridization efficiency. (A) RNA integrity, (B) cDNA amplified targets and (C) fragmented targets used in the hybridization stage. These three quality controls were obtained with the Bioanalyzer using RNA nano chips and the Eukaryote Nano Serie II assay. (D) Overall image of the HERV-V2 microarray hybridization area after scanning, (E) enlargement of the upper left corner showing grid alignment controls and (F) enlargement of the center area showing spotting hybridization controls. Click here to view larger image.
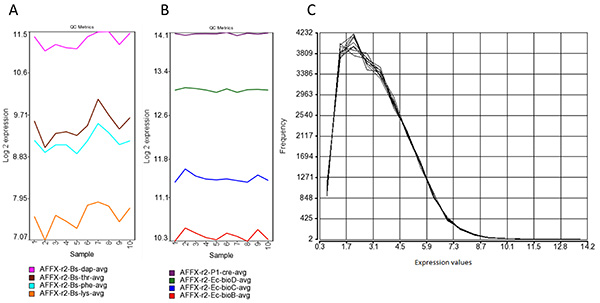
Figure 5. Processing of signals. (A) Affymetrix polyA spike-in amplification controls. The polyA controls Dap, Thr, Phe and Lys transcripts from B. subtilis genes are spiked in the RNA sample and serve to assess the overall success of the target preparation steps. Intensity should be detected at decreasing values among these spike-in controls to ensure that there was no bias during the WT-Ovation amplification between highly- and low-expressed genes. (B) Affymetrix spike-in hybridization controls. These targets isolated from E. coli and P1 bacteriophage are spiked before the labeling procedure. Increasing values from BioB, BioC, BioD and Cre indicate the overall success of the hybridization. (C) Intensity distribution of the chip signals after RMA normalization. Most of the probesets exhibit signals with values lower than 26 (background), indicating an overall expression mainly restricted to some specific HERV loci. Click here to view larger image.
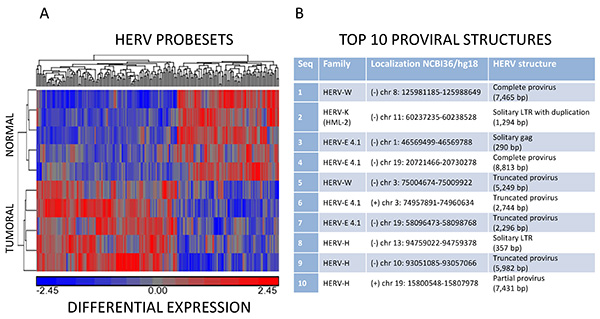
Figure 6. Data analysis. (A) Hierarchical clustering analysis of normal and tumoral samples. Partitioning clustering was applied to the normalized expression values using a Euclidean distance function algorithm, grouping probesets into up (red)- and down (blue)-regulation among normal and tumoral samples. (B) Selection of the top 10 HERV structures identified as candidate biomarker of prostate cancer. For each HERV element, the related HERV family, the genomic coordinates (NCBI 36/hg18) and a brief description of the HERV structure are given. Click here to view larger image.
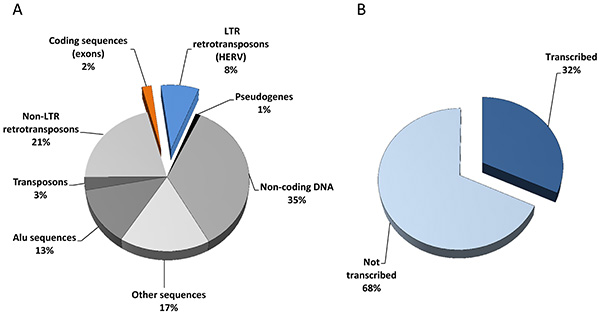
Figure 7. The HERV repertoire. (A) Sequencing of the human genome revealed 25,000 protein-coding genes (exons, 2%) and a huge amount of transposable elements including 200,000 long-terminal repeat (LTR) retrotransposons (HERV, 8%). (B) Extrapolation from HERV-V2 chip content and associated expression data (79 samples originating from 8 normal versus tumoral tissue types) suggest that one third of the HERV repertoire is transcriptionally active. Click here to view larger image.
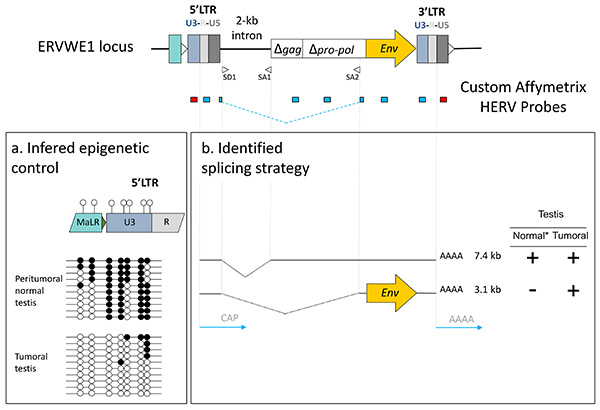
Figure 8. Functional interpretation of signals from the chip. (A) Promoter identification and epigenetic control: U3 negative signal (red probe, 5'LTR) versus R-U5 positive signal (blue probe, 5'LTR) suggest U3-driven transcription, supported by the different CpG methylation (solid black circles) content of U3 in peritumoral normal versus tumoral tissues. (B) Splicing strategy: the putative 3.1 kb envelope encoding mRNA expressed exclusively in the tumor is identified using SD1/SA2 splice junction overlapping probe. *Deduced by the comparison with other non-placental tissues. Click here to view larger image.
Discussion
Over the last 10 years, most of the attempts for HERV expression measurement have used RT-PCR techniques either to focus on a specific locus20-24 or based on the relative conservation of the pol genes to evaluate general trends within HERV genera25,26. Additionally, PCR amplifications using highly degenerated primers coupled with low density microarrays intended to detect and quantify the expression of HERV families27,28. In order to trace the expression of individual locus within a family, approaches based on the PCR amplification of conserved regions combined with subsequent cloning and sequencing enabled transcriptionally active distinct elements of the HML-229,30 or HERV-E4.131 families to be identified. Also ending by cloning and sequencing steps, the genome repeat expression monitoring technique aiming to identify promoters among repeats identified active HML-2 specific human solitary LTRs32,33. We successively developed two generations of high-density microarrays dedicated to the analysis of the HERV transcriptome, introducing methodologies suitable for repeated element probe design in order to minimize cross reactions between paralogous elements within a family34,35. The HERV-V2 chip which targets 2,690 distinct proviruses and 2,883 solo LTRs of the HERV-W, HERV-H, HERV-E 4.1, HERV-FRD, HERV-K HML-2 and HERV-K HML-5 families, unveiled the expression of 1,718 HERV loci (Figures 7A and B) in a wide range of tissues35, illustrated in this paper by the identification of putative prostate cancer biomarkers. In addition, the use of multiple probesets on a given locus is informative about its transcriptional regulation. First, a U3 negative signal in conjunction with a U5 positive one classifies the LTR as a promoter, and conversely U3 positive and U5 negative signals may reflect a polyadenylation role. We thus identified 326 promoter LTRs in a broad range of tissues 35 and, based on this U3-U5 dichotomous information provided by the array, we proposed and experimentally confirmed for some selected cases that such autonomous transcription was controlled by a methylation dependent epigenetic process34 (Figure 8). Second, the detection of signals from e.g. LTR, gag and env independent probesets or issued from probes targeting specific splice junction is informative about the proviral splicing strategy, as illustrated by the ERVWE1/Syncytin1 expression profile in placenta or in tumoral testis34. This indicates that the process of HERV specific probe selection is robust enough to support the identification of tissue-associated splicing strategy, as efficiently as for conventional genes36 (Figure 8).
This method is the first attempt to identify individually HERV locus expression using a custom high density microarray based on Affymetrix technology. The clearly identified advantages of the microarray format to decipher HERV transcriptome consisting of (i) the coordinated exploration of several HERV families and (ii) the simultaneous and independent analysis of the different regions for each locus, e.g. U3 and U5 domains for solo and proviral LTRs, gag or env regions and possible spliced junctions associated with proviral structures, without any a priori on the functionality of the HERV element. Prospects rely upon an improvement of annotations in the microarray-associated biocomputing tools. This should allow one to convert chip signals into biological hypotheses such as whether evidenced active HERVs drive lncRNA transcription or modulate more or less proximal coding gene expression. Indeed, such assumption is supported by recent studies that identified prostate cancer-associated ncRNA transcripts containing components of viral ORFs from the HERV-K endogenous retrovirus family or portions of a viral LTR promoter region37, as well as two gene fusion events namely HERV-K22q11-ETV1 and HERV-K17-ETV38,39. Taken together, this whole transcriptome approach combined with LTR function and splicing strategy identifications may help to decipher the marker versus the trigger components of HERV expression in chronic40,41 and infectious diseases42,43.
Disclosures
This work was supported by bioMérieux SA, the Hospices Civils de Lyon and the French public agency OSEO (Advanced Diagnostics for New Therapeutic Approaches, a French government-funded program dedicated to personalized medicine). PP, VC, GO, NM, and FM are employees of bioMérieux SA. PP, NM and FM have submitted patent applications covering the findings of this paper.
Acknowledgements
We thank Cecile Montgiraud, Juliette Gimenez, Magali Jaillard and Bertrand Bonnaud for their contribution to the initial development and optimization of the HERV-V2 protocol. We also wish to thank Hader Haidous for his guidance on ethical considerations.
Materials
| Name | Company | Catalog Number | Comments |
| Trizol | Invitrogen | 15596-026 | |
| RNA poly-A control stock | Affymetrix | 900433 | |
| DNAse 1 | Promega | M6101 | 1,000 U (1 U/µl) |
| Terminal transferase | Roche | 3333574001 | 400 U. Including enzyme and coenzyme (CoCl2). |
| DLR-1a | Affymetrix | 900542 | |
| Hybridization internal controls B2 and 20x Eukaryotic Hybridization Control | Affymetrix | 900454 | |
| GeneChip Hybridization, Wash and staining | Affymetrix | 900720 | Including PreHybridization Mix and 2x Hybridization Mix for 30 reactions |
| 10x One-Phor-All Buffer PLUS | Composition in DEPC-treated water: 100 mM Tris-acetate pH 7.5; 100 mM magnesium acetate; 500 mM potassium acetate. | ||
| RNeasy Mini kit | Qiagen | 74104 | RNA cleanup protocol |
| WT-Ovation RNA amplification system | Nugen | 2210-24 | |
| QIAquik PCR purification kit | Qiagen | 28104 | |
| EQUIPMENT | |||
| Material Name | Company | Catalogue Number | Comments |
| Nanodrop 1000 | Thermo Scientific | ||
| GeneChip Scanner 3000 7G | Affymetrix | GS30007G | Optional: autoloader |
| GeneChip Fluidics Station 450 | Affymetrix | FS450 | |
| GeneChip Hybridization 640 Oven | Affymetrix | 640 | Includes 4 GeneChip Probe array carriers |
| Workstation loaded with GeneChip Operating Software (GCOS) including the GeneChip Scanner 3000 High-Resolution Scanning Patch | |||
| HERV-V2 chip | Affymetrix | Custom array. For microarray availability (for research use only), please contact: François Mallet Laboratoire Commun de Recherche Hospices Civils de Lyon-bioMérieux Medical Diagnostic Discovery Department Centre Hospitalier Lyon Sud, Bâtiment 3F 69495, Pierre Bénite cedex France Phone: 33 (0)4 72 67 87 85 Email: francois.mallet@biomerieux.com | |
| HERV-V2 conception Dedicated database and annotations The construction of a dedicated database, grouping genomic HERV sequences belonging to 6 HERV families, has been achieved by the following procedure: (i) the most complete and representative sequence of each HERV family was selected from the literature and defined as a prototype sequence (Figure 2). (ii) The 6 prototypes were functionally annotated with reference to their LTR (U3/R/U5) and internal parts (gag/pol/env). (iii) RepeatMasker 44 was then applied using these functional sequences as input libraries. A genome-wide search of all related sequences was performed over the human genome on the basis of a minimum 80% homology (NCBI 36/hg18). (iv) Finally, the functional sequences retrieved by this process were assembled into distinct loci on the basis of their genomic location and eventually implemented in a dedicated HERV database. This database, called HERV-gDB3, contains 10,035 individual HERV loci35. Locus-specific probes design Starting from HERV-gDB3, overlapping tracks of 25-mer candidate probes were firstly generated. Each candidate probe was then aligned against the human genome using KASH 45 in order to assess the cross-hybridization potentialities. This latter estimation was performed by a model developed specifically for this purpose and referred to as EDA+. Briefly, the principle of EDA+ is to take into account the instability brought by mismatches and gaps in a 25-mer target/probe hybridization complex. Candidate probes exhibiting low cross-hybridization risks (i.e. a low number of non-specific genomic targets) are selected and lastly assembled into probesets. Custom HERV GeneChip microarray The custom HERV GeneChip integrates 23,583 HERV probesets and can discriminate 5,573 distinct HERV elements, composed of solo LTRs, complete and partial proviruses (Figure 2). The standard Affymetrix control probes for unbiased amplification and hybridization were also included in the microarray. | |||
References
- Artibani, W. Landmarks in prostate cancer diagnosis: the biomarkers. BJU Int. 110, Suppl 1. 8-13 (2012).
- Girometti, R., et al. Negative predictive value for cancer in patients with "gray-zone" PSA level and prior negative biopsy: preliminary results with multiparametric 3.0 Tesla MR. J. Magn. Reson. Imaging. 36, 943-950 (2012).
- You, B., et al. Prognostic value of modeled PSA clearance on biochemical relapse free survival after radical prostatectomy. Prostate. 69, 1325-1333 (2009).
- Vickers, A. J., Brewster, S. F. PSA Velocity and Doubling Time in Diagnosis and Prognosis of Prostate Cancer. Br. J. Med. Surg. Urol. 5, 162-168 (2012).
- Bussemakers, M. J., et al. DD3: a new prostate-specific gene, highly overexpressed in prostate cancer. Cancer Res. 59, 5975-5979 (1999).
- Vlaeminck-Guillem, V., Ruffion, A., Andre, J., Devonec, M., Paparel, P. Urinary prostate cancer 3 test: toward the age of reason. Urology. 75, 447-453 (2010).
- Buscher, K., et al. Expression of the human endogenous retrovirus-K transmembrane envelope, Rec and Np9 proteins in melanomas and melanoma cell lines. Melanoma Res. 16, 223-234 (2006).
- Ishida, T., et al. Identification of the HERV-K gag antigen in prostate cancer by SEREX using autologous patient serum and its immunogenicity. Cancer Immun. 8, 15(2008).
- Sauter, M., et al. Human endogenous retrovirus K10: expression of Gag protein and detection of antibodies in patients with seminomas. J. Virol. 69, 414-421 (1995).
- Pérot, P., Bolze, P. A., Mallet, F. Viruses: Essential Agents of Life. Witzany, G. , Springer-Verlag. 325-361 (2012).
- Stamey, T. A., Kabalin, J. N. Prostate specific antigen in the diagnosis and treatment of adenocarcinoma of the prostate. I. Untreated patients. Untreated patients. J. Urol. 141, 1070-1075 (1989).
- Catalona, W. J., et al. Measurement of prostate-specific antigen in serum as a screening test for prostate cancer. New Engl. J. Med. 324, 1156-1161 (1991).
- Schroder, F. H. Prostate cancer around the world. An overview. Urol. Oncol. 28, 663-667 (2010).
- Klotz, L. Active surveillance for favorable-risk prostate cancer: background, patient selection, triggers for intervention, and outcomes. Curr. Urol. Rep. 13, 153-159 (2012).
- Irizarry, R. A., et al. Exploration, normalization, and summaries of high density oligonucleotide array probe level data. Biostatistics. 4, 249-264 (2003).
- Tusher, V. G., Tibshirani, R., Chu, G. Significance analysis of microarrays applied to the ionizing radiation response. Proc. Natl. Acad. Sci. U.S.A. 98, 5116-5121 (2001).
- Storey, J. D., Tibshirani, R. Statistical significance for genomewide studies. Proc. Natl. Acad. Sci. U.S.A. 100, 9440-9445 (2003).
- Team, R. D. C. R: A language and environment for statistical computing. , (2008).
- Gentleman, R. C., et al. Bioconductor: open software development for computational biology and bioinformatics. Genome Biol. 5, R80(2004).
- de Parseval, N., Lazar, V., Casella, J. F., Benit, L., Heidmann, T. Survey of human genes of retroviral origin: identification and transcriptome of the genes with coding capacity for complete envelope proteins. J. Virol. 77, 10414-10422 (2003).
- Wang-Johanning, F., et al. Detecting the expression of human endogenous retrovirus E envelope transcripts in human prostate adenocarcinoma. Cancer. 98, 187-197 (2003).
- Smallwood, A., et al. Temporal regulation of the expression of syncytin (HERV-W), maternally imprinted PEG10, and SGCE in human placenta. Biol. Reprod. 69, 286-293 (2003).
- Okahara, G., et al. Expression analyses of human endogenous retroviruses (HERVs): tissue-specific and developmental stage-dependent expression of HERVs. Genomics. 84, 982-990 (2004).
- Buscher, K., et al. Expression of human endogenous retrovirus K in melanomas and melanoma cell lines. Cancer Res. 65, 4172-4180 (2005).
- Forsman, A., et al. Development of broadly targeted human endogenous gammaretroviral pol-based real time PCRs Quantitation of RNA expression in human tissues. J. Virol. Methods. 129, 16-30 (2005).
- Muradrasoli, S., Forsman, A., Hu, L., Blikstad, V., Blomberg, J. Development of real-time PCRs for detection and quantitation of human MMTV-like (HML) sequences HML expression in human tissues. J. Virol. Methods. 136, 83-92 (2006).
- Seifarth, W., et al. Comprehensive analysis of human endogenous retrovirus transcriptional activity in human tissues with a retrovirus-specific microarray. J. Virol. 79, 341-352 (2005).
- Pichon, J. P., Bonnaud, B., Mallet, F. Quantitative multiplex degenerate PCR for human endogenous retrovirus expression profiling. Nat. Protoc. 1, 2831-2838 (2006).
- Flockerzi, A., et al. Expression pattern analysis of transcribed HERV sequences is complicated by ex vivo recombination. Retrovirology. 4, 39(2007).
- Flockerzi, A., et al. Expression patterns of transcribed human endogenous retrovirus HERV-K(HML-2) loci in human tissues and the need for a HERV Transcriptome Project. BMC Genomics. 9, 354(2008).
- Gosenca, D., et al. HERV-E-Mediated Modulation of PLA2G4A Transcription in Urothelial Carcinoma. PLoS ONE. 7, e49341(2012).
- Buzdin, A., Kovalskaya-Alexandrova, E., Gogvadze, E., Sverdlov, E. GREM, a technique for genome-wide isolation and quantitative analysis of promoter active repeats. Nucleic Acids Res. 34, e67(2006).
- Buzdin, A., Kovalskaya-Alexandrova, E., Gogvadze, E., Sverdlov, E. At least 50% of human-specific HERV-K (HML-2) long terminal repeats serve in vivo as active promoters for host nonrepetitive DNA transcription. J. Virol. 80, 10752-10762 (2006).
- Gimenez, J., et al. Custom human endogenous retroviruses dedicated microarray identifies self-induced HERV-W family elements reactivated in testicular cancer upon methylation control. Nucleic Acids Res. 38, 2229-2246 (2010).
- Pérot, P., et al. Microarray-based sketches of the HERV transcriptome landscape. PLoS ONE. 7, e40194(2012).
- Fehlbaum, P., Guihal, C., Bracco, L., Cochet, O. A microarray configuration to quantify expression levels and relative abundance of splice variants. Nucleic Acids Res. 33, e47(2005).
- Prensner, J. R., et al. Transcriptome sequencing across a prostate cancer cohort identifies PCAT-1, an unannotated lincRNA implicated in disease progression. Nat. Biotechnol. 29, 742-749 (2011).
- Tomlins, S. A., et al. Distinct classes of chromosomal rearrangements create oncogenic ETS gene fusions in prostate cancer. Nature. 448, 595-599 (2007).
- Hermans, K. G., et al. Truncated ETV1, fused to novel tissue-specific genes, and full-length ETV1 in prostate cancer. Cancer Res. 68, 7541-7549 (2008).
- Brodziak, A., et al. The role of human endogenous retroviruses in the pathogenesis of autoimmune diseases. Med. Sci. Monit. 18, RA80-RA88 (2012).
- Mullins, C. S., Linnebacher, M. Human endogenous retroviruses and cancer: Causality and therapeutic possibilities. World J. Gastroenterol. 18, 6027-6035 (2012).
- Young, G. R., et al. Resurrection of endogenous retroviruses in antibody-deficient mice. Nature. 491, 774-778 (2012).
- Vander Kuyl, A. C. HIV infection and HERV expression: a review. Retrovirology. 9, 6(2012).
- Smit, A. F. A., Hubley, R. RepeatMasker Open-3.0. , (1996).
- Navarro, G., Raffinot, M. Flexible Pattern Matching in Strings: Practical On-Line Search Algorithms for Texts and Biological Sequences. , Cambridge University Press. (2002).
Reprints and Permissions
Request permission to reuse the text or figures of this JoVE article
Request PermissionThis article has been published
Video Coming Soon
Copyright © 2025 MyJoVE Corporation. All rights reserved