
A subscription to JoVE is required to view this content. Sign in or start your free trial.
Method Article
Multimodal Imaging and Spectroscopy Fiber-bundle Microendoscopy Platform for Non-invasive, In Vivo Tissue Analysis
In This Article
Summary
The assembly and use of a multimodal microendoscope is described which can co-register superficial tissue image data with tissue physiological parameters including hemoglobin concentration, melanin concentration, and oxygen saturation. This technique can be useful for evaluating tissue structure and perfusion, and can be optimized for individual needs of the investigator.
Abstract
Recent fiber-bundle microendoscopy techniques enable non-invasive analysis of in vivo tissue using either imaging techniques or a combination of spectroscopy techniques. Combining imaging and spectroscopy techniques into a single optical probe may provide a more complete analysis of tissue health. In this article, two dissimilar modalities are combined, high-resolution fluorescence microendoscopy imaging and diffuse reflectance spectroscopy, into a single optical probe. High-resolution fluorescence microendoscopy imaging is a technique used to visualize apical tissue micro-architecture and, although mostly a qualitative technique, has demonstrated effective real-time differentiation between neoplastic and non-neoplastic tissue. Diffuse reflectance spectroscopy is a technique which can extract tissue physiological parameters including local hemoglobin concentration, melanin concentration, and oxygen saturation. This article describes the specifications required to construct the fiber-optic probe, how to build the instrumentation, and then demonstrates the technique on in vivo human skin. This work revealed that tissue micro-architecture, specifically apical skin keratinocytes, can be co-registered with its associated physiological parameters. The instrumentation and fiber-bundle probe presented here can be optimized as either a handheld or endoscopically-compatible device for use in a variety of organ systems. Additional clinical research is needed to test the viability of this technique for different epithelial disease states.
Introduction
Fiber-bundle microendoscopy techniques typically analyze in vivo tissue using either imaging techniques or a combination of spectroscopy techniques.1-3 One such imaging technique, high-resolution fluorescence microendoscopy, can image apical tissue micro-architecture with sub-cellular resolution in a small, microscale field-of-view, using a topical contrast agent such as proflavine, fluorescein, or pyranine ink.1,3-11 This imaging modality has shown promising clinical performance in qualitatively differentiating diseased and healthy epithelial tissue in real-time with low inter-observer variability.8 Occasionally, investigators will use high-resolution fluorescence microscopy data to extract quantitative features such as cell and nuclear size or gland area, but this remains a primarily qualitative technique targeted towards visualizing tissue morphology.1,3,8-10 On the other hand, spectroscopy techniques, such as diffuse reflectance spectroscopy, are targeted towards providing functional tissue information and have shown promising clinical performance in quantitatively identifying cancerous lesions in multiple organs.2,12-15
Therefore, there is a need for a device incorporating both types of modalities to potentially further reduce inter-observer variability, maintain real-time visualization of tissue micro-architecture, and provide a more complete analysis of tissue health. To accomplish this goal, a multimodal probe-based instrument was constructed that combines two modalities in a single fiber-optic probe: high-resolution fluorescence microendoscopy and sub-diffuse reflectance spectroscopy.11 This method co-registers qualitative high-resolution images of apical tissue morphology (structural properties) with quantitative spectral information (functional properties) from two distinct tissue depths including local hemoglobin concentration ([Hb]), melanin concentration ([Mel]), and oxygen saturation (SaO2).11,12,16 This specific sub-diffuse reflectance spectroscopy modality uses two source-detector separations (SDSs) to sample two unique tissue depths to provide a more comprehensive picture of tissue health by sampling down to the basement membrane and underlying tissue stroma.11
The fiber-probe consists of a central 1 mm-diameter image fiber with approximately 50,000 4.5 µm diameter fiber elements, a cladding diameter of 1.1 mm and an overall coating diameter of 1.2 mm. The image fiber is surrounded by five 200 µm diameter fibers with cladding diameters of 220 µm. Each 200 µm multimode fiber is located a center-to-center distance of 864 µm away from the center of the image fiber. Each of the 200 µm multimode fibers are 25° apart. Using the leftmost 200 µm multimode fiber as the "source" fiber, and the additional three 200 µm multimode fibers as the "collection" fibers, this geometry necessarily creates three center-to-center SDSs of 374 µm, 730 µm, 1,051 µm, and 1,323 µm. The fiber tips are enclosed in a cylindrical metal casing that keeps the distances between fibers constant. The diameter of the cylindrical metal casing is 3 mm. The distal end (towards the fiber-optic probe tip) of the fiber-optic probe is 2 feet long. The probe then separates into the six respective individual fibers at the proximal end (towards the instrumentation) which is an additional 2 feet long, for a total length of 4 feet. Figure 1 shows a representation of the fiber-optic probe.

Figure 1: Fiber-optic probe design. The fiber-optic probe consists of one 1 mm-diameter image fiber and four 200 µm multimode fibers. This figure shows representations of (a) the metal end cap which constrains the geometry of the fibers at the probe tip to yield SDSs of 374, 730, and 1,051 µm with respect to the leftmost 200 µm multimode fiber (Scale bar ≈ 1 mm), (b) the fibers being constrained within the metal cap, showing the fiber cores, fiber cladding, and fiber coating (Scale bar ≈ 1 mm), (c) the protective polyamide sheathing around fibers (Scale bar ≈ 1 mm), (d) the finished distal tip of the probe, with the metal finger grip and single black cable containing all fibers (Scale bar ≈ 4 mm), and (e) a picture of the distal tip of the probe (Scale bar ≈ 4 mm). Please click here to view a larger version of this figure.
This multimodal instrumentation and associated technique is the first combination of these modalities within a single probe, although other combined structural/functional techniques do exist that combine different modalities. For example, hyperspectral imaging combines wide-field imaging with quantitative hemoglobin and melanin properties,17,18 and other techniques have been developed that combine optical coherence tomography (OCT) with analysis of tissue protein expression,19 to name a few. This article reports on a compact and easy-to-implement instrumentation setup that uses a general fiber-optic probe which can be optimized for various purposes including endoscopic use in the lower gastrointestinal tract and esophagus or as a handheld probe for use in the oral cavity and external skin placement.11,20
The hardware for this instrumentation requires both custom data acquisition and post-processing code to acquire diffuse reflectance spectra and then extract the resulting volume-averaged tissue physiological parameters including [Hb], [Mel], and SaO2. The custom data acquisition code was built to allow the simultaneous acquisition from a camera (for high-resolution fluorescence microscopy) and a spectrometer (for diffuse reflectance spectroscopy). Drivers are often available from the manufacturers' websites to allow integration with a variety of programming languages. The custom post-processing code imports a priori absorption values of in vivo [Hb] and [Mel]21 and then utilizes a previously developed nonlinear optimization fitting process that creates a fitted curve of the spectra.22 The fitted curve is built by minimizing the χ2 value between itself and the raw spectra and determining the tissue physiological parameters ([Hb], [Mel], and SaO2) from the fitted curve and with the lowest χ2 value.22 The code can be modified to include absorption from other chromophores as well, such as the exogenous pyranine ink used here, so that target physiological parameters are unaffected.
Physiological indicators of tissue health, such as [Hb], [Mel], and SaO2, can be used as reports of tumor response to therapy or as indicators of local vascularization and angiogenesis.14,23 Including a high-resolution fluorescence microendoscopy modality helps guide probe placement and provides investigators with a more complete picture of the relationship between epithelial tissue structure and function. In this article, construction and application of the multimodal microendoscope is described.11
Protocol
Institutional Review Board approval (IRB #15-09-149) was obtained from the Human Subjects Research program at the University of Arkansas for all aspects of this study. The methods described were carried out in accordance with the approved guidelines, and informed consent was obtained from all participants.
1. Assembly of the High-resolution Fluorescence Microendoscopy Modality
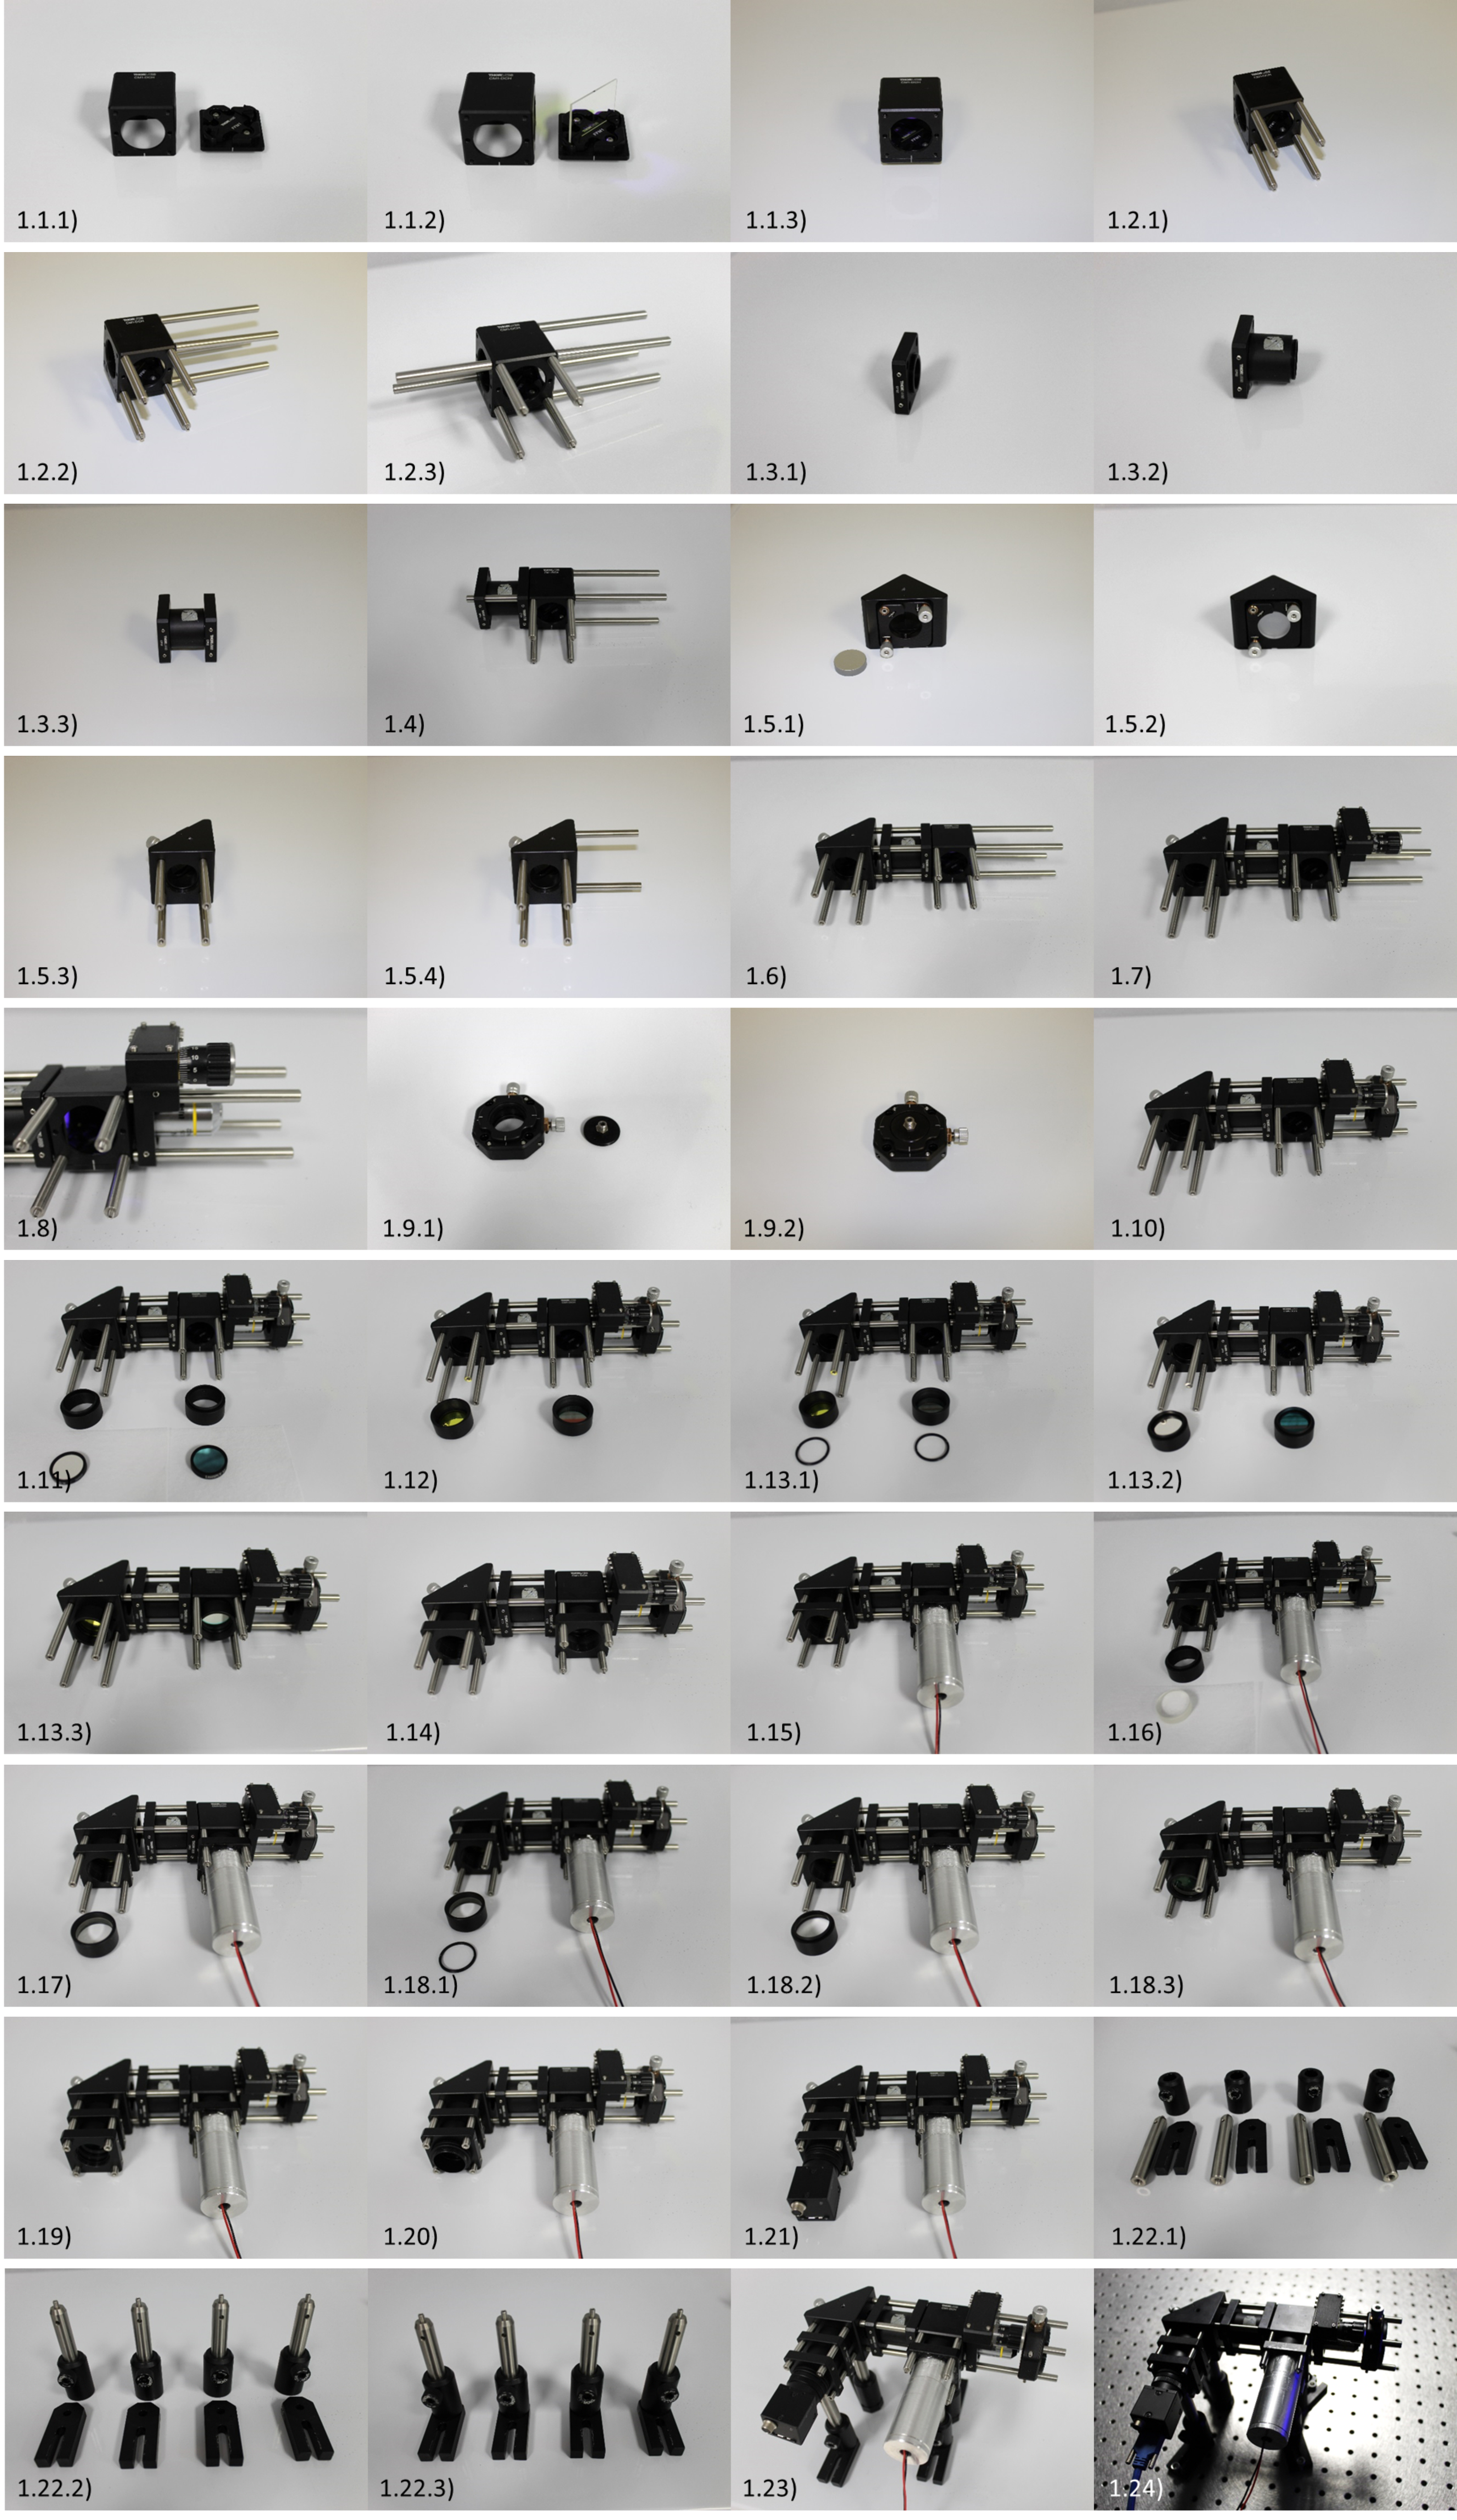
Note: The outlined steps for assembly of the high-resolution fluorescence microendoscopy modality can be visualized in Figure 2.
- Place a 470 nm Dichroic Mirror Inside a 30 mm Cage Cube.
- Obtain a 30 mm cage cube and remove the dichroic filter mount.
- Place a 470 nm dichroic mirror in the dichroic filter mount.
- Re-insert and secure the dichroic filter mount back inside the cage cube.
- Attach Cage Assembly Rods to the 30 mm Cage Cube.
- Secure four 1.5 inch cage assembly rods to the front of the cage cube.
- Secure four 3.0 inch cage assembly rods to the right side of the cage cube.
- Secure two 2.0 inch cage assembly rods diagonally on the left side of the cage cube.
- Build a Cage Plate/Lens Tube Assembly.
- Obtain a 1.0 inch threaded 30 mm cage plate and attach a stress free retaining ring to the inside of the cage plate using the provided threading.
- Screw in a 1.0 inch lens tube to the stress-free retaining ring.
- Attach a second 1.0 inch threaded 30 mm cage plate to the 1.0 inch lens tube and adjust the standard retaining rings so that the two cage plates are flush.
- Slide the 1.0 inch Cage Plate/Lens Tube Assembly onto the Left Side of the 30 mm Cage Cube.
- Build the right-angle mirror mount assembly.
- Obtain a right-angle mirror mount and a 1.0 inch UV-enhanced aluminum mirror.
- Place the 1.0 inch UV-enhanced aluminum mirror into the mirror mount and tighten.
- Secure four 2.0 inch cage assembly rods to the front of mirror mount
- Secure two 2.0 inch cage assembly rods diagonally on the right side of the cage cube.
- Connect the right-angle mirror mount assembly onto the left side of the 1.0 inch cage plate/lens tube assembly by placing the opposing cage assembly rods through the respective openings of the 30 mm cage plate.
- Thread a z-axis translation mount through the 3.0 inch cage assembly rods on the right side of the assembly.
- Attach a 10X achromatic objective lens to the z-axis translation mount.
- Build a 1.0 inch fiber adaptor plate/xy-axis translation lens mount assembly.
- Obtain an xy-axis translation mount and a 1.0 inch fiber adaptor plate.
- Secure the 1.0 inch fiber adaptor plate into the xy-axis translation lens mount.
- Slide the 1.0 inch fiber adaptor/xy-axis translation lens mount assembly in front of the objective lens.
- Obtain two 0.5 inch long, 1.0 inch diameter lens tubes, one 440/40 nm bandpass filter (excitation filter) and one 525/36 nm bandpass filter (emission filter).
- Place each filter inside a 0.5 inch long, 1.0 inch diameter lens tube, such that the arrow on the outside of the filter is facing the side of the lens tube with the external threads.
- Attach the filters to the assembly.
- Obtain two standard retaining rings.
- Secure the filters inside the 0.5 inch long, 1.0 inch diameter lens tubes with the standard retaining rings.
- Screw in the lens tube with the excitation filter to the front of the 30 mm cage cube and screw in the lens tube with the emission filter to the right-angle mirror mount.
- Screw in the 0.5 inch lens tube with the emission filter to the front of the right-angle mirror mount.
- Obtain two 1.0 inch threaded 30 mm cage plates and place them in front of the 0.5 inch long, 1.0 inch diameter lens tubes containing the filters.
- Using epoxy or strong adhesive, attach a 455 nm LED to the cage plate connected to the excitation filter.
- Obtain one 0.5 inch long, 1.0 inch diameter lens tube and a 1.0 inches achromatic doublet tube lens with focal length of 50 mm.
- Place the tube lens inside the lens tube such that the arrow on the outside of lens is facing the side of the lens tube with the external threads.
- Screw in the tube lens to the assembly.
- Obtain one standard retaining ring.
- Secure the lens inside the 0.5 inch long, 1.0 inch diameter lens tube with the standard retaining ring.
- Attach the lens tube with the tube lens to the left-most cage plate.
- Place a 30 mm cage plate in front of the 0.5 inch long, 1.0 inches diameter lens tube containing the tube lens.
- Attach a stress free retaining ring to the inside of the 30 mm cage plate.
- Attach a USB monochrome camera to the cage plate with the stress free retaining ring.
- Construct the optical post mounting devices.
- Obtain four 0.5 inch post holders, four 0.5 inches optical posts, and four mounting bases.
- Secure the 0.5 inch optical posts inside the 0.5 inch post holders.
- Secure the 0.5 inch post holders onto the mounting bases.
- Screw in the four optical post mounting devices to the screw holes located under the 30 mm cage cube, the right-angle mirror mount, the cage plate connected to the LED, and the cage plate connected to the camera.
- Screw in the four the optical post mounting devices to either an optical breadboard or optical table to finish construction of the high-resolution fluorescence microendoscopy modality.

Figure 2: Assembly of the high-resolution fluorescence microendoscopy modality. The high-resolution fluorescence microendoscopy modality can be constructed by building a shell of 1.0 inch diameter-sized components, with special care taken in handling the dichroic mirror, objective lens, excitation/emission filters, and tube lens. Glass surfaces of these components must be carefully handled using lens paper. Please click here to view a larger version of this figure.
2. Assembly of the Sub-diffuse Reflectance Spectroscopy Modality
Note: The outlined steps for assembly of the sub-diffuse reflectance spectroscopy modality can be visualized in Figure 3.
- Obtain a tungsten-halogen light source and, using epoxy or a strong adhesive, secure a 1.0 inch threaded 30 mm cage plate onto the front.
- Secure four 3.0 inch cage assembly rods to the cage plate.
- Attach a z-axis translation mount to the cage assembly rods.
- Screw in a 20X achromatic objective lens to the z-axis translation mount.
- Build a fiber adaptor plate/xy-axis translation lens mount assembly.
- Obtain an xy-axis translation mount and a 1.0 inches fiber adaptor plate.
- Secure the fiber adaptor plate into the xy-axis translation lens mount.
- Slide the 1.0 inch fiber adaptor/xy-translation mount assembly in front of the objective lens.
- Build the motor arm assembly.
- Obtain the custom-built aluminum motor arm and one SMA fiber adaptor plate.
- Screw in the fiber adaptor plate (with external threading) into the aluminum motor arm (with internal threading).
- Attach the custom-built aluminum motor arm adaptor to the motor arm with four #4-40 0.5 in. screws.
- Build the motor/motor arm/motor housing assembly.
- Obtain the custom-built aluminum motor housing and the 400-step stepper motor.
- Line up the screw holes on the stepper motor and motor housing and then secure with four #4-40 0.5 inch screws.
- Feed the rotating motor rod of the stepper motor through the opening of the motor arm assembly and tighten the locking screw on the aluminum motor arm adaptor.
- Build the optical switch assembly.
- Obtain the custom-built aluminum optical switch and three 1.0 inch fiber adaptor plates.
- Thread the adaptor plates into the threaded holes in the optical switch.
- Attach the custom-built aluminum optical switch face-plate onto the optical switch with four #4-40 0.5 inch screws.
- Attach the motor/motor arm/motor housing assembly to the optical switch by feeding the rotating motor rod of the stepper motor through the central hole of the optical switch.
- Obtain an electric circuit board and stepper motor driver, and then place the stepper motor driver across the central groove of the breadboard.
- Observe the electrical connection schematic (Figure 3, 2.12) for the stepper motor driver, 12 V power supply, and stepper motor.
- Connect the stepper motor driver, 12 V power supply, and stepper motor as specified in the circuit diagram (Figure 3, 2.12) to complete construction of the motorized optical switch.
- Screw in the optical switch components and tungsten-halogen light source to an optical breadboard or optical table near the previously constructed (Figure 2, 1.24) high-resolution fluorescence microendoscopy assembly.
- Attach one end of a 550 µm, 0.22 NA patch cable to the 1.0 inch fiber adaptor plate of the motor arm assembly.
- Attach the other end of the 550 µm, 0.22 NA patch cable to the fiber connector of the USB spectrometer.
- Screw in the five distal probe cables to the respective 1.0 inch fiber adaptor plates on the instrumentation to finish completion of the multimodal high-resolution imaging and sub-diffuse reflectance spectroscopy fiber-bundle microendoscope.
- Screw in the central 1 mm diameter image fiber cable to the 1.0 inch fiber adaptor plate mentioned in step 1.9.2.
- Screw in the leftmost 200 µm multimode fiber cable to the 1.0 inch fiber adaptor plate mentioned in step 2.6.
- Screw in the 2nd 200 µm multimode fiber cable to the leftmost 1.0 inch fiber adaptor attached to the tungsten-halogen lamp mentioned in step 2.9.2.
- Screw in the 3rd 200 µm multimode fiber cable to the middle 1.0 inch fiber adaptor plate mentioned in step 2.9.2.
- Screw in the 4th 200 µm multimode fiber cable to the rightmost 1.0 inch fiber adaptor plate mentioned in step 2.9.2.

Figure 3: Assembly of the sub-diffuse reflectance spectroscopy modality. The sub-diffuse reflectance spectroscopy modality can be constructed using a basic tungsten-halogen lamp coupled to an objective lens to focus light through the 200 µm multimode delivery fiber, and a spectrometer. Additionally, a custom-built motorized optical switch can be constructed within the lamp-fiber-spectrometer path to switch between each SDS. Investigators using multiple spectrometers to acquire from multiple SDSs can bypass the optical switch component. Please click here to view a larger version of this figure.
3. Calibration of the Sub-diffuse Reflectance Spectroscopy Modality
Note: The following steps (section 3) must be completed prior to spectral data collection (section 4).
- Turn on all components of the instrumentation, including the 455 nm LED, broadband tungsten-halogen lamp, CMOS camera, USB spectrometer, stepper motor, and motor control board. Ensure the shutter on the tungsten-halogen lamp is open.
- Turn off all ambient light.
- Open the custom data acquisition software.
- Keep equipment running for 30 min for the lamp reach an appropriate temperature and for inherent noise from the spectrometer to stabilize.
- Place a 20% diffuse reflectance standard inside the bottom opening of the custom-built, 3D printed calibration standard device.
- Place the fiber-optic probe inside the leftmost slot of the custom, 3D printed fiber-holder, demonstrated in Figure 4. The leftmost slot fixes the perpendicular distance from the fiber-optic probe tip to the reflectance standard at 2.1 mm, which is the optimum distance in which the signal reaching the spectrometer is maximized for the first SDS of 374 µm.
- Adjust the motorized optical switch to the left-most position such that the spectrometer is connected to the first SDS of 374 µm.
- Set the integration time to 500 msec. This integration time must be chosen as to not saturate the spectrometer but maintain a practically low integration time.
- Acquire a spectrum, Rmax,374µm, by clicking "Acquire Spectrum" in the software.
- Close the shutter on the tungsten-halogen lamp and record a spectrum, Rdark,374µm, of background noise, by clicking "Acquire Spectrum" in the software. Once acquired, open the shutter once again.
- Place the fiber-optic probe inside the rightmost slot of the custom, 3D printed fiber-holder, demonstrated in Figure 4. The rightmost slot fixes the perpendicular distance from the fiber-optic probe tip to the reflectance standard at 3.9 mm, which is the optimum distance in which the signal reaching the spectrometer is maximized for the second SDS of 730 µm.
- Adjust the motorized optical switch to the middle position such that the spectrometer is connected to the second SDS of 730 µm.
- Acquire a spectrum, Rmax,730µm, by clicking "Acquire Spectrum" in the software.
- Close the shutter on the tungsten-halogen lamp and record a spectrum, Rdark,730µm, of background noise, by clicking "Acquire Spectrum" in the software.
- Open the shutter once again.

Figure 4: Calibration of the sub-diffuse reflectance spectroscopy modality. For pre-experimental calibration, the fiber-optic probe tip must be placed at different perpendicular distances from the 20% diffuse reflectance standard depending on the SDS. To consistently achieve these perpendicular distances across all experiments, a calibration standard device was designed (device cross section shown in (a)) to hold the probe at exact distances from the 20% diffuse reflectance standard. In this specific fiber-optic probe setup, light from the tungsten-halogen lamp is shown through the optical switch at source-detector separations of (b) 374 µm and (c) 730 µm (with motor and motor arm removed from the optical path for clarity). Distances of (d) 2.1 mm for the 374 µm SDS, and (e) 3.9 mm for the 730 µm SDS are required for calibration. Please click here to view a larger version of this figure.
4. In Vivo Data Acquisition and Optical Property Extraction from Human Skin
In this section, the multimodal microendoscope technique will be demonstrated on in vivo human skin.
- Open the custom data acquisition software and adjust the spectrometer integration time by clicking "Integration Time" and set it so that it is the same as during calibration, which was 500 msec in this case (step 3.8).
- Determine the area of skin in which to acquire data, which may differ on the application of the investigator. In this case, the thin skin of the forearm was chosen as a demonstration.
- If the skin area contains hair, remove the hair with a disposable sterile razor.
- Obtain a standard yellow highlighter, which contains pyranine ink, and lightly mark the chosen skin area.
- Turn on the 455 nm LED and close the shutter to the tungsten-halogen lamp.
- Place the probe in gentle contact with the skin.
- Move the probe around on the stained area of tissue to view a live high-resolution feed of apical keratinocyte architecture on the viewing window of the software.
- Select an appropriate exposure time and gain, 150 msec and 10 dB gain in this case, to avoid image saturation, by clicking "Exposure Time" and "Gain", typing in the appropriate values, and then clicking "Apply Settings" in the software interface.
- Acquire an image by clicking "Acquire Image" in the software interface.
- While keeping the probe at the same image site, turn off the 455 nm LED and open the shutter to the tungsten-halogen lamp.
- Adjust the motorized optical switch to the left position such that the spectrometer is connected to the second SDS of 374 µm.
- Acquire spectra, Rtissue,374µm, by clicking "Acquire Spectra" in the software interface.
- Adjust the motorized optical switch to the middle position such that the spectrometer is connected to the second SDS of 730 µm.
- Acquire spectra, Rtissue,730µm, by clicking "Acquire Spectra" in the software interface.
- Open the custom post-processing software.
- Run the post-processing software by clicking "Run" and select the high-resolution fluorescence image, four calibration spectra, and the two in vivo spectra from the folder in which the data was saved when prompted by the software.
NOTE: The custom software obtains the true absolute reflectance (Rabs,374µm and Rabs,730µm) using the following equations.


The post-processing code, as previously described, calculates a fitted curve to the diffuse reflectance spectra (equations 1 and 2) and then determines tissue physiological parameters including ([Hb], [Mel], and SaO2).11,22,24
Results
Following this protocol, the investigator will obtain an in-focus high-resolution image of the tissue site with the full field of view (Figure 5). Outlines of cells can be seen if stained with pyranine ink from a standard yellow highlighter, whereas individual cell nuclei can be seen if stained with a dye such as proflavine. Following spectral acquisition, the post-processing software uses a priori knowledge of in vivo hemoglobin concentration ([Hb]) and...
Discussion
The multimodal high-resolution imaging and sub-diffuse reflectance spectroscopy fiber-bundle microendoscope reported here can be optimized and used by investigators for a variety of applications including endoscopic or handheld use for human or animal studies. It thus provides a flexible method for visualizing in vivo apical tissue micro-architecture alongside measurements of hemoglobin concentration, melanin concentration, and tissue oxygen saturation from two different tissue depths. This article describes the...
Disclosures
The authors declare that they have no competing financial interests.
Acknowledgements
This material is based on work supported by the National Institutes of Health (1R03-CA182052, 1R15-CA202662), the National Science Foundation Graduate Research Fellowship Program (G.G., DGE-1450079), the Arkansas Biosciences Institute, and the University of Arkansas Doctoral Academy Fellowship. Any opinions, findings, and conclusions or recommendations expressed in this material are those of the authors and do not necessarily reflect the views of the acknowledged funding agencies.
Materials
| Name | Company | Catalog Number | Comments |
| 30 mm Cage Cube with Dichroic Filter Mount | Thorlabs, Inc. | CM1-DCH | |
| 470 nm Dichroic Mirror (Beam Splitter) | Chroma Corporation | T470lpxr | |
| Cage Assembly Rod, 1.5", 4-Pack | Thorlabs, Inc. | ER1.5-P4 | |
| Cage Assembly Rod, 3.0", 4-Pack | Thorlabs, Inc. | ER3-P4 | |
| Cage Assembly Rod, 2.0", 4-Pack | Thorlabs, Inc. | ER2-P4 | |
| SM1-Threaded 30 mm Cage Plate | Thorlabs, Inc. | CP02 | |
| SM1 Series Stress-Free Retaining Ring | Thorlabs, Inc. | SM1PRR | |
| SM1 Lens Tube, 1.00" Thread Depth | Thorlabs, Inc. | SM1L10 | |
| Right-Angle Kinematic Mirror Mount | Thorlabs, Inc. | KCB1 | |
| 1" UV Enhanced Aluminum Mirror | Thorlabs, Inc. | PF10-03-F01 | |
| Z-Axis Translation Mount | Thorlabs, Inc. | SM1Z | |
| 10X Olympus Plan Achromatic Objective | Thorlabs, Inc. | RMS10X | |
| XY Translating Lens Mount | Thorlabs, Inc. | CXY1 | |
| SMA Fiber Adapter Plate with SM1 Thread | Thorlabs, Inc. | SM1SMA | |
| SM1 Lens Tube, 0.50" Thread Depth | Thorlabs, Inc. | SM1L05 | |
| 440/40 Bandpass Filter (Excitation) | Chroma Corporation | ET440/40x | |
| 525/36 Bandpass Filter (Emission) | Chroma Corporation | ET525/36m | |
| Quick Set Epoxy | Loctite | 1395391 | |
| 455 nm LED Light Housing Kit - 3-Watt | LED Supply | ALK-LH-3W-KIT | |
| 1" Achromatic Doublet, f = 50 mm | Thorlabs, Inc. | AC254-050-A | |
| Flea 3 USB Monochrome Camera | Point Grey, Inc. | FL3-U3-32S2M-CS | |
| 0.5" Post Holder, L = 1.5" | Thorlabs, Inc. | PH1.5 | |
| 0.5" Optical Post, L = 4.0" | Thorlabs, Inc. | TR4 | |
| Mounting Base, 1" x 2.3" x 3/8" | Thorlabs, Inc. | BA1S | |
| Long Lifetime Tungsten-Halogen Light Source (Vis-NIR) | Ocean Optics | HL-2000-LL | |
| 20X Olympus Plan Objective | Edmund Optics, Inc. | PLN20X | |
| Custom-Built Aluminum Motor Arm | N/A | N/A | Custom designed and built |
| Custom-Built Aluminum Motor Arm Adaptor | N/A | N/A | Custom designed and built |
| Custom-Built Aluminum Motor Housing | N/A | N/A | Custom designed and built |
| Stepper Motor - 400 steps/revolution | SparkFun Electronics | ROB-10846 | Multiple suppliers |
| Custom-Built Aluminum Optical Fiber Switch | N/A | N/A | Custom designed and built |
| Custom-Built Aluminum Optical Fiber Switch Face-Plate | N/A | N/A | Custom designed and built |
| Arduino Uno - R3 | SparkFun Electronics | DEV-11021 | Multiple suppliers |
| Electronic Breadboard - Self-Adhesive | SparkFun Electronics | PRT-12002 | Multiple suppliers |
| EasyDriver - Stepper Motor Driver | Sparkfun Electronics | ROB-12779 | |
| 12 V, 229 mA Power Supply | Phihong | PSM03A | Multiple suppliers |
| Enhanced Sensitivity USB Spectrometer (Vis-NIR) | Ocean Optics | USB2000+VIS-NIR-ES | |
| 550 µm, 0.22 NA, SMA-SMA Fiber Patch Cable | Thorlabs, Inc. | M37L01 | |
| Custom-Built Fiber-Optic Probe | Myriad Fiber Imaging | N/A | |
| 20% Spectralon Diffuse Reflectance Standard | Labsphere, Inc. | SRS-20-010 | |
| Standard Yellow Highlighter | Sharpie | 25005 | Multiple suppliers, proflavine or fluorescein can be substituted |
References
- Muldoon, T. J., et al. Subcellular-resolution molecular imaging within living tissue by fiber microendoscopy. Opt Express. 15, 16413-16423 (2007).
- Rajaram, N., Reichenberg, J. S., Migden, M. R., Nguyen, T. H., Tunnell, J. W. Pilot clinical study for quantitative spectral diagnosis of non-melanoma skin cancer. Lasers Surg Med. 42, 716-727 (2010).
- Louie, J. S., Richards-Kortum, R., Anandasabapathy, S. Applications and advancements in the use of high-resolution microendoscopy for detection of gastrointestinal neoplasia. Clin Gastroenterol Hepatol. 12, 1789-1792 (2014).
- Chang, S. S., et al. High resolution microendoscopy for classification of colorectal polyps. Endoscopy. 45, 553-559 (2013).
- Muldoon, T. J., et al. Noninvasive imaging of oral neoplasia with a high-resolution fiber-optic microendoscope. Head Neck. 34, 305-312 (2011).
- Muldoon, T. J., et al. Evaluation of quantitative image analysis criteria for the high-resolution microendoscopic detection of neoplasia in Barrett's esophagus. J Biomed Opt. 15, 026027 (2010).
- Prieto, S. P., Powless, A. J., Boice, J. W., Sharma, S. G., Muldoon, T. J. Proflavine Hemisulfate as a Fluorescent Contrast Agent for Point-of-Care Cytology. PLoS One. 10, e0125598 (2015).
- Parikh, N., et al. In vivo diagnostic accuracy of high resolution microendoscopy in differentiating neoplastic from non-neoplastic colorectal polyps: a prospective study. Am J Gastroenterol. 109, 68-75 (2014).
- Shin, D., et al. Quantitative analysis of high-resolution microendoscopic images for diagnosis of esophageal squamous cell carcinoma. Clin Gastroenterol Hepatol. 13, 272-279 (2015).
- Prieto, S. P., et al. Qualitative and quantitative comparison of colonic microendoscopy image features to histopathology. Proc SPIE Int Soc Opt Eng. 9328, (2015).
- Greening, G. J., et al. Fiber-bundle microendoscopy with sub-diffuse reflectance spectroscopy and intensity mapping for multimodal optical biopsy of stratified epithelium. Biomed Opt Express. 6, 4934-4950 (2015).
- Rajaram, N., Gopal, A., Zhang, X., Tunnell, J. W. Experimental validation of the effects of microvasculature pigment packaging on in vivo diffuse reflectance spectroscopy. Lasers Surg Med. 42, 680-688 (2010).
- Spliethoff, J. W., et al. Monitoring of tumor response to cisplatin using optical spectroscopy. Transl Oncol. 7, 230-239 (2014).
- Chang, V. T., et al. Quantitative physiology of the precancerous cervix in vivo through optical spectroscopy. Neoplasia. 11, 325-332 (2009).
- Yu, B., Shah, A., Nagarajan, V. K., Ferris, D. G. Diffuse reflectance spectroscopy of epithelial tissue with a smart fiber-optic probe. Biomed Opt Express. 5, 675-689 (2014).
- Hennessy, R., Goth, W., Sharma, M., Markey, M. K., Tunnell, J. W. Effect of probe geometry and optical properties on the sampling depth for diffuse reflectance spectroscopy. J Biomedical Opt. 19, 107002 (2014).
- Ghassemi, P., Travis, T. E., Moffatt, L. T., Shupp, J. W., Ramella-Roman, J. C. A polarized multispectral imaging system for quantitative assessment of hypertrophic scars. Biomed Opt Express. 5, 3337-3354 (2014).
- Vasefi, F., et al. Polarization-sensitive hyperspectral imaging in vivo: a multimode dermoscope for skin analysis. Sci Rep. 4, (2014).
- Winkler, A. M., Rice, P. F. S., Drezek, R. A., Barton, J. K. Quantitative tool for rapid disease mapping using optical coherence tomography images of azoxymethane-treated mouse colon. J Biomedl Opt. 15, 041512 (2010).
- Bish, S. F., et al. Handheld Diffuse Reflectance Spectral Imaging (DRSi) for in-vivo characterization of skin. Biomed Opt Express. 5, 573-586 (2014).
- Prahl, S. A. . Optical Absorption of Hemoglobin. , (1999).
- Rajaram, N., et al. Design and validation of a clinical instrument for spectral diagnosis of cutaneous malignancy. Appl Opt. 49, 142-152 (2010).
- Hennessy, R., Markey, M. K., Tunnell, J. W. Impact of one-layer assumption on diffuse reflectance spectroscopy of skin. J Biomed Opt. 20, 27001 (2015).
- Rajaram, N., Nguyen, T. H., Tunnell, J. W. Lookup table-based inverse model for determining optical properties of turbid media. J Biomed Opt. 13, 050501 (2008).
- Nichols, B. S., Rajaram, N., Tunnell, J. W. Performance of a lookup table-based approach for measuring tissue optical properties with diffuse optical spectroscopy. J Biomed Opt. 17, 057001 (2012).
- Greening, G. J., James, H. M., Muldoon, T. J. . Optical Phantoms: Diffuse and Sub-diffuse Imaging and Spectroscopy Validation. , 1-37 (2015).
- Karsten, A. E., Smit, J. E. Modeling and verification of melanin concentration on human skin type. Photochem Photobiol. 88, 469-474 (2012).
- Glennie, D. L., Hayward, J. E., Farrell, T. J. Modeling changes in the hemoglobin concentration of skin with total diffuse reflectance spectroscopy. J Biomed Opt. 20, 035002 (2015).
- Lim, L., Nichols, B., Rajaram, N., Tunnell, J. W. Probe pressure effects on human skin diffuse reflectance and fluorescence spectroscopy measurements. J Biomed Opt. 16, 011012 (2011).
Reprints and Permissions
Request permission to reuse the text or figures of this JoVE article
Request PermissionExplore More Articles
This article has been published
Video Coming Soon
Copyright © 2025 MyJoVE Corporation. All rights reserved