
Method Article
A Web Tool for Generating High Quality Machine-readable Biological Pathways
In This Article
Summary
PathWhiz is a comprehensive, online pathway drawing tool for generating biochemical and biological pathways. It uses publicly accessible databases and easily expandable palettes consisting of pre-drawn pathway components. This protocol describes how to easily build new pathways, replicate and edit existing pathways, and propagate previously drawn pathways to different organisms.
Abstract
PathWhiz is a web server built to facilitate the creation of colorful, interactive, visually pleasing pathway diagrams that are rich in biological information. The pathways generated by this online application are machine-readable and fully compatible with essentially all web-browsers and computer operating systems. It uses a specially developed, web-enabled pathway drawing interface that permits the selection and placement of different combinations of pre-drawn biological or biochemical entities to depict reactions, interactions, transport processes and binding events. This palette of entities consists of chemical compounds, proteins, nucleic acids, cellular membranes, subcellular structures, tissues, and organs. All of the visual elements in it can be interactively adjusted and customized. Furthermore, because this tool is a web server, all pathways and pathway elements are publicly accessible. This kind of pathway "crowd sourcing" means that PathWhiz already contains a large and rapidly growing collection of previously drawn pathways and pathway elements. Here we describe a protocol for the quick and easy creation of new pathways and the alteration of existing pathways. To further facilitate pathway editing and creation, the tool contains replication and propagation functions. The replication function allows existing pathways to be used as templates to create or edit new pathways. The propagation function allows one to take an existing pathway and automatically propagate it across different species. Pathways created with this tool can be "re-styled" into different formats (KEGG-like or text-book like), colored with different backgrounds, exported to BioPAX, SBGN-ML, SBML, or PWML data exchange formats, and downloaded as PNG or SVG images. The pathways can easily be incorporated into online databases, integrated into presentations, posters or publications, or used exclusively for online visualization and exploration. This protocol has been successfully applied to generate over 2,000 pathway diagrams, which are now found in many online databases including HMDB, DrugBank, SMPDB, and ECMDB.
Introduction
Biological pathway diagrams are like blueprints for life scientists. They are perhaps the most concise and informative routes for depicting biological processes and the contextual connections between genes, proteins, and metabolites. This is because images are much more efficiently processed and often much more easily understood by humans than text1. The quality, detail, and content of pathway diagrams can vary considerably. These differences often depend on the intended purpose of the pathway and the skills of the pathway artist. Pathways created for educational purposes such as wall charts or textbooks are often created by professional artists. As a result, these pathway diagrams are much more visually pleasing and offer considerably more biological detail with full depictions of metabolite structures, subcellular components, cell structures, tissues, and organs. These "textbook" representations often include detailed notes and commentaries. On the other hand, pathway diagrams designed for internet applications often have to sacrifice artistry and visual richness in favor of simplified machine readable "wiring" diagrams. These wireframe diagrams are more easily image-mapped and hyperlinked. Simplified pathway diagrams are the basis to such popular online pathway databases as KEGG2, MetaCyc3, Wikipathways4, and Reactome5. The emergence of computer-compatible pathway databases has also led to the appearance of computer-compatible pathway drawing tools. In other words, one does not have to be a professional artist or a professional programmer to generate useable pathway diagrams. For instance, BioCyc's Pathway tools6 and Wikipathway's PathVisio software7allow users to freely generate and share machine-readable pathways in BioPAX8 and/or HTML format. Additionally, there are a number of other stand-alone freeware packages as well as commercial packages that support the generation of various machine-readable, wire-frame pathways, such as Cytoscape9, GenMAPP10, PathCase11, and VisANT12.
The simplification of internet pathway diagrams largely grew from the historical limitations found in many web browsers and web-based rendering tools. However, significant advances in web technologies have been made in the past few years. This suggested that it could be possible to generate interactive, internet-compatible pathway diagrams that are just as colorful, just as aesthetically pleasing and just as biologically complete as those found in textbooks. This work led to the development of PathWhiz. PathWhiz was implemented using a Ruby on Rails (http://rubyonrails.org, version 4.2.0) web framework incorporating a MySQL relational database (https://www.mysql.com, version 5.1.50) to manage all of the pathway data, including entity relationships, external references, descriptions, visualization specifications and chemical structures. The front-end web client is controlled by Ruby on Rails combined with Backbone.js (http://backbonejs.org, version 1.0.0) as the front-end web framework for the editor.
Originally developed for the curation of the human-only Small Molecule Pathway Database (SMPDB)13, PathWhiz14has since been extended to support pathway generation for many other organisms and to function as a general pathway image and knowledge database. In particular, this web tool allows for the creation of the full range of biochemical/biological pathways including metabolic, protein interaction, molecular signaling, physiological, and drug/disease pathways. This pathway drawing tool differs from most other pathway generating tools in three major ways: 1) it is a web server rather than a stand-alone, installable software package; 2) it supports the facile generation and interactive visualization of chemical compounds, proteins, nucleic acids, cellular membranes, subcellular structures, tissues, and organs; and 3) it allows users to easily borrow, build or improve upon the work of other users, thereby allowing "crowd-sourced" pathway generation. As a web server, it has several advantages over downloadable, platform-specific software tools. In particular, it is compatible with any platform, operating system and modern web browser. Furthermore, it does not require the user to register in order to begin creating a pathway (though users can freely create a "private account" in order to track and control the accessibility of the pathways they create). Perhaps the most appealing feature of this tool is the amount of biological and biochemical detail that can be easily added into any pathway through a palette of pre-rendered images and an extensive database of protein and biochemical data. This allows both "non-artists" and "non-programmers" to easily create colorful, aesthetically pleasing and richly detailed pathways that are web-compatible and fully machine-readable. A more detailed comparison between PathWhiz and other pathway drawing tools is provided in Table 1.
A number of popular life science databases have already used this pathway drawing tool to create database-specific, online, interactive pathway diagrams. For instance, the Escherichia coli Metabolome Database (ECMDB)15recently updated its pathway library with more than 1,650 pathways drawn using web based tool. Each pathway in the ECMDB is now displayed as a richly colored, fully hyperlinked image map with detailed metabolite and protein structure depictions, as well as a simplified black and white KEGG-like wire diagram. This large-scale pathway update led to the discovery of many intermediate metabolites that had not been previously included in other Escherichia coli metabolic databases. Other databases, such as the Human Metabolome Database (HMDB)15, not only rely on PathWhiz pathways to depict and describe metabolic and signaling pathways, but also to depict the metabolic changes involved in diseases such as cancer. HMDB currently includes 101 metabolic pathways, 376 drug action pathways, 233 disease-associated pathways and 16 signaling pathways, all generated through this web tool.
The following protocol describes in detail how PathWhiz can be used to easily create, replicate, and propagate biochemical pathways for a variety of purposes and applications.
Protocol
1. Pathway Generation
- Go to http://smpdb.ca/pathwhiz using any modern web browser.
- From the menu bar, select either "Try Me!" to use the tool as a guest (pathways drawn will be public), "Sign Up" to register for an account (pathways drawn will only be editable by the user), or "Log In" to use an existing account. To register for an account, go to step 1.2.1, otherwise go to step 1.3.
- To register for an account, fill in the form with an email, name, affiliation, city, country, and 8 character minimum password with password confirmation, then click "Sign Up".
- If not automatically redirected to the pathway index, select the "Draw" link in the menu bar. This index page will show a table of existing pathways. Click the "New Pathway" button to start a new pathway.
- Enter the name of the pathway to be drawn (e.g. TCA Cycle).
- Choose the type of pathway to draw from the drop down list (e.g. Disease/Drug/Metabolic/Signaling/Physiological). It is possible to generate chemical pathways as well as protein signaling, DNA/RNA pathways, or protein-protein interaction pathways.
- Search and choose a species by typing the scientific name of the organism in the autocomplete box (e.g., type Escherichia coli). If the name of the organism is not found in the drop down list, click the "New" button and follow steps 1.6.1 to 1.6.5 to add a new organism, otherwise proceed to step 1.7.
- Enter the scientific name of the species (e.g. Gorilla gorilla) and the common name (e.g. Gorilla).
- Choose the classification of the species from the drop down list as Eukaryote or Prokaryote and enter the taxonomy ID from the NCBI taxonomy (e.g. 9593).
- Click the "Create Species" button.
- Enter a comprehensive description for the pathway. See Supplementary File 1 for an example of a description. The more complete the description, the easier it is to search and find the pathway, and the more popular the pathway will be among users.
- Add external references to the pathway by clicking the "Add Reference" button and following steps 1.8.1 to 1.8.2, otherwise go to step 1.9.
- Enter the PubMed ID (which will automatically generate the citation text) or add the citation text manually (and leave the PubMed ID field empty) (e.g. PMC545700, or Kang Y, et al. Genome-Wide Expression Analysis Indicates that FNR of Escherichia coli K-12 Regulates a Large Number of Genes of Unknown Function. J. Bacteriology 187(3):1135-1160. doi:10.1128/JB.187.3.1135-1160. 2005).
- Repeat this process until all desired references have been added.
NOTE: In most cases, only one or two references are needed. However, the more meta-data one can add, the more popular the pathway will be.
- Click the "Create Pathway" button. A white gridded canvas will appear with a grey menu bar. This is where the drawing takes place.
- Click the "Add Process" link and select "Add Reaction" to add the first process visualization. For example, start with a reaction showing the conversion of Oxaloacetic Acid to Citric Acid, via the enzyme Citrate Synthase.
NOTE: Processes are biological events or activities. Processes can be divided into four categories: reactions, transport events, interactions, and binding events. In this example a reaction is shown, but the same principles apply to adding any kind of process. - Search the existing reactions by entering reactants, products, or enzymes in the autocomplete box (e.g. "Oxaloacetic Acid" or "Acetyl CoA"). Scroll through the existing reactions to find the desired reaction, select it and go straight to step 1.12, or, if the desired reaction is not found, click the "New Reaction" button and follow steps 1.11.1 to 1.11.11 to add a new reaction model to the database.
- On the New Reaction form, click the "Add Left Element" button to add a reactant on the left side of the reaction. Reactions are written as reaction equations with a left side and a right side.
- Select the stoichiometry and element type (Compound/Protein Complex/Element Collection/Nucleic Acid/Bound Element). Search for the element by name in the autocomplete box (e.g. "Oxaloacetic Acid"). Select the desired element. Go to step 1.11.3 or, if the desired element is not found, click the "New" button and follow step 1.11.2.1.
- On the new element form, fill in the fields appropriately and save.
- Repeat steps 1.11.1 and 1.11.2 for every element involved in the left side of the reaction (e.g. add two more compounds, "Acetyl-CoA" and "Water").
- Select the direction of the pathway from the drop-down list (e.g., choose the arrow directed from left to right).
NOTE: Arrow representations include Left to Right, Right to Left, and Reversible. - With the left element of the reaction now completed, click the "Add Right Element" button to add a product.
- Select the stoichiometry and element type as in step 1.11.2. Search for the element by name in the autocomplete box (e.g. "Citric acid") and select the desired element. If the desired element is not found, click the "New" button and follow step 1.11.2.1.
- Repeat steps 1.11.5 and 1.11.6 for every element involved in the right side of the reaction (e.g. add "Hydrogen Ion" and "Coenzyme A").
- After the reactants and products have been generated, click the "Add Enzyme" button to add an enzyme to the reaction.
- Search for the enzyme by typing its name in the autocomplete box (e.g. "Citrate synthase") and select the desired enzyme. If the enzyme does not exist in the database, click the "New" button and follow steps 1.11.9.1 to 1.11.9.7.
- When creating a new enzyme, use the New Enzyme form to fill in the enzyme name and species on the corresponding tabs (e.g. Name: Citrate Synthase, Species: Escherichia coli).
- Click the "Add Protein" button to add the species-specific information (i.e. the sequence and quaternary structure information) to this enzyme.
- Fill in the stoichiometry and search for the protein by name (Citrate Synthase), gene name (gltA), or UniProt ID in the autocomplete box. Select the desired protein or, if the desired protein is not found, click the "New" button and follow step 1.11.9.3.1.
- On the New Protein form, fill in the fields appropriately and click the "Create Protein" button. Obligatory fields include Name and UniProt ID. The rest of the fields are optional.
- Use the "Add Modifications" and/or "Add Cofactors" buttons to add protein modification or enzyme cofactors, if required. In this case, neither are required. Fill in the fields appropriately.
- Click the "Add Biological State" button to add a subcellular location to the enzyme.
- Search for the desired biological state by entering the species, cell type, and/or subcellular location in the autocomplete box (e.g. "Escherichia coli, Cell, Cytosol"). Select the desired state or, if the desired state is not found, click the "New" button and proceed to step 1.11.9.6.1.
- On the New Biological State form, fill in the fields appropriately. If the species, etc., is not found, use the "New" button as described above in steps 1.6.1 to 1.6.5. Once done, click the "Create Biological State" button.
- Click the "Create Enzyme" button to save the enzyme.
- Repeat steps 1.11.8 to 1.11.9 to add additional enzymes, if necessary.
NOTE: A reaction can have many different enzymes associated with it, and the enzymes do not have to belong to the same biological state or species (so long as the reactants and products are the same). When drawing a reaction it is always possible to choose which of its associated enzymes should be displayed. - Click the "Create Reaction" button to save the new reaction.
- Specify the reaction's subcellular location (for this particular pathway) in the Biological State field, if known.
- Select the orientation desired for initial rendering the reaction from the drop down lists (Left to Right, Right to Left, Horizontal/Vertical) (e.g. select Left to Right and Horizontal).
- Click the "Create Reaction" button. The newly created reaction will be displayed on the drawing canvas.
- Using a mouse or touch pad, click and drag to reposition the reaction elements on the canvas as desired. Follow steps 1.15.1 to 1.15.5 for repositioning and editing of reaction elements (compounds, edges and/or enzymes) of the recently created reaction.
- Select one or more elements (compounds, edges and/or enzymes) at the same time by either single-clicking each element to add them one-by-one to the current selection, or select all the elements by using the cursor to drag a box around the relevant elements. The selected elements will be colored red.
- Drag the selected elements across the canvas to reposition them in the desired area (usually in the center of the canvas) using a mouse or touch pad. Deselect elements by clicking on them a second time, or clicking on the blank canvas.
- Double-click a chemical compound (it will become surrounded by a dashed grey box) to access a pop-up sidebar that will appear on the right side of the screen. Use this sidebar to edit the template, biological state, z-index and complete reaction details.
- Choose one type of template from the options available (Large, Medium or Small Compound Visualization, Large, Medium or Small Drug Visualization, Cofactor Visualization, Simple Bottom, Left Right or Top Visualization). Add a Biological State and edit the z-index if needed.
NOTE: It is best to keep the type of template consistent throughout the entire pathway, except to differentiate between compound types, i.e. drugs vs. metabolites.
- Choose one type of template from the options available (Large, Medium or Small Compound Visualization, Large, Medium or Small Drug Visualization, Cofactor Visualization, Simple Bottom, Left Right or Top Visualization). Add a Biological State and edit the z-index if needed.
- Double-click a protein/enzyme (it will become surrounded by a dashed grey box) to access a pop-up sidebar (will appear on the right side of the screen). Use this sidebar to edit the template, biological state, the z-index, protein complex details, and complete reaction details.
- Choose one type of template from the options available (Enzyme Monomer, Dimer or Tetramer, No Label, Protein Label or Subunit Label, Transporter, Receptor or Repressor). Add a Biological State and edit the z-index if needed.
NOTE: Different colors are provided to distinguish between proteins; the default color is set to green.
- Choose one type of template from the options available (Enzyme Monomer, Dimer or Tetramer, No Label, Protein Label or Subunit Label, Transporter, Receptor or Repressor). Add a Biological State and edit the z-index if needed.
- To edit the information for an entire process, double click any of its elements (they will become surrounded by a dashed grey box) and access the "Edit Selected" link in the secondary menu bar (grey). Two options will be displayed: "Edit <Element>" and "Edit <Process>".
NOTE: "Edit <Element>" will direct users to the sidebar for the corresponding element. "Edit <Process>" will unveil options to "Edit Details", change the direction in which the process is rendered (Horizontal/Vertical and Left/Right), or reconnect the edges (also Horizontal/Vertical and Left/Right). Clicking the Edit Details link will lead to a screen where details of the reaction and all its elements can be edited at once, including Biological States, templates, and z-indexes. Enzymes can be added or removed from the display, and elements and edges can be hidden if desired. For example, double click the Hydrogen Ion element, and then click on "Edit Selected". Place cursor over "Edit Acetyl-CoA + Oxaloacetic acid + Water → Citric acid + Coenzyme A + Hydrogen Ion" and select "Edit Details". Add a Biological State for each compound (Escherichia coli, Cell, Cytoplasm). Once done, go to the bottom of the page and click the purple "Update Reaction" button. Only enzymes that are already associated with this reaction can be added to the pathway at this stage. If new enzymes need to be added to the reaction model, return to the reaction index (under the "Processes" tab), find the desired reaction, and add them there. - Edit the reaction edges through a single click or a double click.
- Select the reaction edges to manipulate them in the same way as compounds and proteins. Click and drag on the edge to move the whole edge.
NOTE: The start and end points can also be clicked and dragged to change the edge length. When the start/end point of an edge has been selected, the associated "knob" can be adjusted to control the direction and curvature of the start/end point. To add extra nodes to the edge, select the edge and note the blue rectangle that appears. Click the upper half of the rectangle to add a node and click the lower half to remove a node. - Double-click the start/end point of an edge to cycle the start/end point through the pointed arrow, blocking arrow, and no arrow options.
- Select the reaction edges to manipulate them in the same way as compounds and proteins. Click and drag on the edge to move the whole edge.
- Select one or more elements (compounds, edges and/or enzymes) at the same time by either single-clicking each element to add them one-by-one to the current selection, or select all the elements by using the cursor to drag a box around the relevant elements. The selected elements will be colored red.
- Once the first reaction has been drawn as desired, select a product of the reaction (e.g. Citric Acid) by double clicking it (notice the change in color to red) in order to add the next process onto this reaction product (in this case Citric Acid to cis-Aconitic Acid via Aconitate Hydratase).
- Once selected, click the "Add Process" tab and click the "Add Reaction" option.
- Add another reaction to the TCA Cycle (in this particular example) by repeating the process for adding a reaction (steps 1.11 to 1.15). Since this reaction is being built off an existing reaction product, only reactions that contain the selected element will appear.
- Add the remaining reactions for the TCA Cycle by following steps 1.11 to 1.15 for each reaction.
- Once all reactions have been added, add visual elements such as membranes, DNA, tRNAs, subcellular organelles, organs, tissues, zoom boxes or labels by clicking the "Add Visual Element" link and selecting one of the "Add Membrane", "Add Image", "Add Zoom Box" or "Add Label" options. Follow steps 1.20.1 to 1.20.4 to add visual elements.
- Click the "Add Membrane" option to add a cellular membrane. Edit this membrane by double clicking it to access the sidebar. Choose the type of membrane in the template field located on the sidebar. Select the "Enclosed membrane" option to render a boxed membrane.
- Click the "Add Image" option to add an image currently existing in the PathWhiz database (standard images include organs, organelles, and tissues). Edit the image by double clicking it to access a sidebar. Edit options are self-explanatory and include depth scaling with the z-index, scale up/scale down, and rotate left/rotate right.
- Click the "Add Zoom Box" option to add a zoom box to a particular image.
- Click the "Add Label" option to add a text label. Edit the label by double clicking it to access its sidebar. Editing options include the label template, text, and z-index.
NOTE: The "Add Vacuous Element" link offers options for adding extraneous compounds, proteins, nucleic acids, element collections, or edges to the canvas that are not associated with any process. These elements will show up initially in the upper left corner of the canvas. They appear as arbitrary elements that can be edited in the sidebar, where the user can choose the desired element and change the visualization details of said element. The element should be incorporated into the pathway before adding any new vacuous elements in order to maintain pathway neatness. Vacuous elements are only meant to assist in visual understanding (i.e. illustrating the presence of multiple tRNAs during transcription) and not to represent integral process components. They should be used sparingly as they will only show up in the visualization, and are not incorporated into the machine-readable formats (BioPAX, SBML, SBGN, PWML).
- Add a sub-pathway by clicking the "Add Process" link and selecting the "Add Sub-Pathway" option.
NOTE: Sub-pathways can also be chained to existing reactions, in the same way as demonstrated in steps 1.16 to 1.18. The addition of sub-pathways can reduce the complexity of large or complex pathways. They can also be used to provide additional information on connections between known pathways. - Search for the sub-pathway name in the autocomplete box. Only sub-pathways that have been already defined for this pathway will appear in the autocomplete box, thus if this is a new pathway, no sub-pathways will appear. If the desired sub-pathway does not exist, click the "New Sub-Pathway" button and follow steps 1.22.1 to 1.22.3.
- Select the sub-pathway type (Sub Pathway/Inhibitory Sub Pathway/Activating Sub Pathway).
- Enter the sub-pathway name.
- Add input and output elements to the sub-pathway in the same fashion as adding reactants and products to a reaction (steps 1.11.1 to 1.11.3 above).
NOTE: A sub-pathway should have at least one input or output element. This allows it to be connected to the other processes in the pathway, in the same way as reactions are chained (steps 1.16 to 1.18 above). - Click the "Create Sub-Pathway" button.
- Adjust the canvas size of a pathway diagram by clicking the "Other" link and selecting the "Change Canvas Size" option. To change the canvas size, follow steps 1.23.1 to 1.23.3.
- Fill in the "New Height" field and the "New Width" field accordingly.
- Select the desired direction towards which the canvas should increase or decrease in size by clicking the corresponding button on the grid provided in the "Anchor" section.
- Click the "Update Canvas Size" button.
- Alternatively, adjust the canvas size automatically. Once the pathway is complete, click the "Other" link and select the "Fit Canvas to Pathway" option. This will automatically trim the canvas around the existing pathway elements.
- When the pathway is complete, click the "Pathway" link and select the "Export and View" option.
- Use the "Background Color for Images" option to choose either blue or white as the background color for the image.
- Select either Yes or No for the "Also Generate Simplified Version?" option. If Yes is selected, a KEGG-like wire diagram will also be automatically generated for the pathway.
- Click the "Generate Image Files" button.
NOTE: This generates the different data exchange formats and image files for the pathway. Images must be re-generated each time the pathway is updated, and this may take several minutes. - Once the image has been generated, click the "Show in Viewer" button to view a fully hyperlinked, high resolution pathway image in the browser.
NOTE: The "Show in Viewer" button only appears for pathways once their images have been generated. This view also contains links to download the pathway in various data exchange and image formats.
2. Pathway Replication
NOTE: Pathway replication is a quick and easy route to take an existing pathway in PathWhiz's library and duplicate it so that it can serve as a template for further editing or modification. To replicate a pathway, follow steps 1.1 to 1.3 to log in, if not already done.
- Go to the pathway index if not there already by clicking "Pathways" on the main menu bar. Search for the desired pathway to be replicated by entering its name in the search bar and clicking the "Search" button (e.g. "TCA Cycle").
- Locate the pathway to be replicated (e.g. "TCA Cycle"), and click the green "Replicate" button.
- Edit the name of the pathway if desired (e.g. type "TCA Cycle Practice". No two pathways can have the same name.
- Enter a new or different description for the pathway (see step 1.7).
- To add new or different references to the pathway, click the "Add Reference" button and follow step 1.8 above.
- Click the "Create Pathway" button. A purple progress wheel will appear while the pathway is being built. This process may take several minutes or more, depending on the size of the pathway.
- Edit or add any desired elements to the pathway using steps 1.10 to 1.22.
- Follow steps 1.23 to 1.29 to complete and export the pathway.
3. Pathway Propagation
NOTE: Pathway propagation is a quick and easy route to take an existing pathway in PathWhiz's library for one organism (e.g. Escherichia coli) and to create a similar pathway for another organism (e.g. Staphylococcus aureus). This process involves finding and substituting S. aureus proteins for E. coli proteins and regenerating the entire pathway with S. aureus proteins or genes. To propagate a pathway start by following steps 2.1 to 2.2 above.
- Locate the pathway to be propagated (in this case TCA Cycle) and click the "Show" button.
- Click the "Propagate" button in the top right corner.
- On the propagation form, click the "Add Species" button to identify the species to which the existing pathway will be converted. Multiple species can be added, although the more species there are, the longer the conversion time.
- Search for an existing species or add a new species following steps 1.6.1 to 1.6.5 above.
- If desired, change the E-value to determine the similarity threshold for finding protein homologs. Select Yes or No for the "Reviewed Proteins Only" option (this indicates which UniProt proteins should be used in the generated pathway).
- Click the "Propagate Pathway" button.
- Click the "OK" button in the pop-up window.
NOTE: A purple progress wheel will appear while the pathway is propagating. This process may take several minutes or more, depending on the size of the pathway and the number of species to which the initial pathway is being propagated. - A second pop-up window will appear when the propagation is complete. Click the "OK" button. This will create an index showing all the new pathways that have been generated from this propagation.
- From this index, check the pathway details and click the "Draw" button to view and edit each of the new pathways.
- Edit or add any desired elements to the pathway using steps 1.10 to 1.22.
- Follow steps 1.23 to 1.29 to complete and export the pathway.
4. Editing an Existing Pathway
NOTE: In some cases, new information about an existing pathway has to be added or incorrect information about a pathway needs to be corrected. To edit an existing pathway, start by following steps 1.1 to 1.3 to log in.
- Go to the pathway index if not there already by clicking "Pathways" on the main menu bar.
- Locate the pathway to be edited (in this case, the "TCA Cycle"). If the image is to be edited click the "Draw" button, if the description or references are to be edited, click the "Edit" button.
- To edit the image, follow steps 1.10 to 1.29 above.
- To edit the pathway description or references, follow steps 1.4 to 1.8 and click the "Update Pathway" button when finished to save the changes.
- Regenerate the image to update the changes by following steps 1.25 to 1.28.
5. Pathway Viewing and Downloading
NOTE: This web based tool contains thousands of carefully drawn and edited pathways that can be viewed or downloaded for different applications. To view or download a pathway, follow steps 1.1 to 1.3 to log in.
- Go to the pathway index (if not there already) by clicking "Pathways" on the main menu bar.
- Locate the pathway to be downloaded (in this case, TCA cycle) and click the "Show" button.
- Click on the purple button with the desired PathWhiz ID next to the "Show In Viewer" label (there may be more than one ID).
- Click the "Downloads" tab in the sidebar.
- Click the hyperlinks to download the pathway in various file formats.
Results
The web server's main pathway generation tool described in this manuscript is shown in Figure 1 and Figure 2. Menu options provided by each tab are also shown. Figures 3 and 4 provide a set of screenshots of the pathway creation process. Figure 5 provides a set of screenshots of the reaction creation process. Figure 6 shows the online pathway viewer and its menu.
PathWhiz can be used to generate pathways with various content types and styles. These include "traditional" metabolic pathways (Figure 7), disease and drug pathways showing side effects (Figure 8) and drug responses (Figure 9), as well as protein signaling pathways (Figure 10). Pathways may be richly colored with considerable biological detail or they may be converted to simple black and white representations (Figure 11). Once completed, these pathways may be viewed in the interactive pathway viewer (Figure 6), downloaded as images, or exported in several different machine-readable data exchange formats for further analysis. Note that the quality of the different data exchange formats depends on the quality of data inputted when originally drawing the pathway. For example, adding more reaction detail (i.e. stoichiometry, biological states) will produce more comprehensive BioPAX. On the other hand, pathways drawn with overlapping elements (for visual reasons, such as showing bound elements or protein complexes) may also produce overlapping glyphs in SBGN-ML.

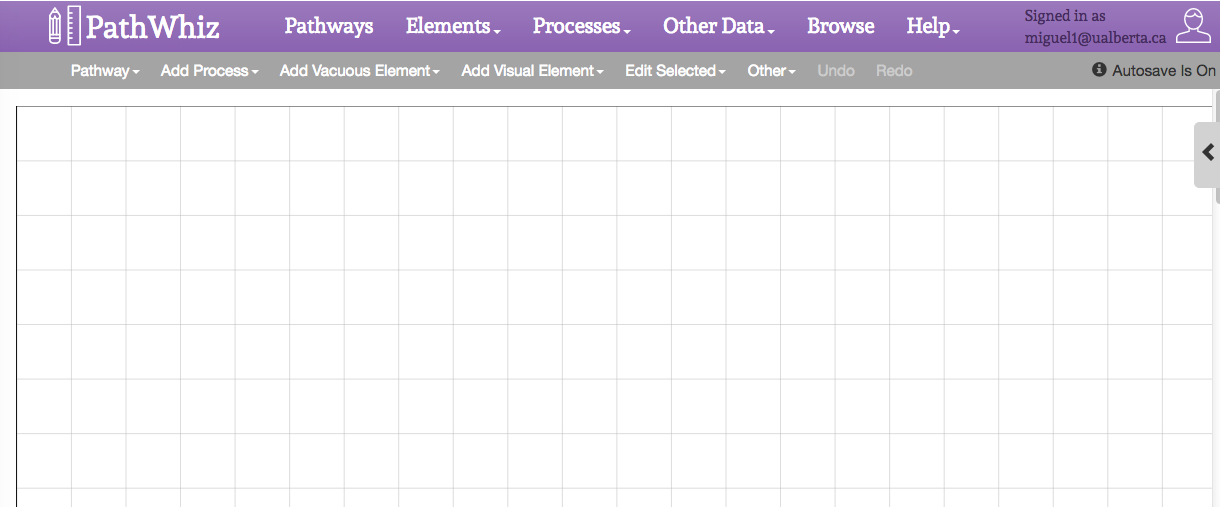
Figure 1: Pathway Editor Interface. The Editor Interface is composed of 3 main sections: a top main menu bar, a secondary menu and a gridded canvas. The top main menu bar (purple) provides links to view, edit, and create pathway elements. The lower secondary menu bar (grey) provides links to add and edit visual pathway elements in the current pathway diagram, such as reactions, interactions, transport processes, sub-pathways, compounds, proteins, nucleic acids, as well as membranes, cellular/subcellular images, zoom boxes, and labels. This menu also includes two tabs that permit the editing of selected elements or the editing of the canvas. The gridded white canvas below menu bars is where the reaction pathways and processes will be added. The zoom box works as a visual cue to indicate the magnification of a selected area in an image. It consists of a small square that is connected to a re-sizeable quadrilateral. The small square is placed on the area that is to be expanded or zoomed, while the quadrilateral works as a canvas in which one can add the reactions that happen in the selected area (by the smaller square). Edit the zoom box by double clicking it to access its sidebar. Editing options include drop down lists for template, color, and z-index. The rendering orientation of the zoom box can be changed by selecting top, right, left or bottom in the template tab. When the zoom box is selected, the black circles can be dragged to resize and reformat the different zoom box components. Please click here to view a larger version of this figure.

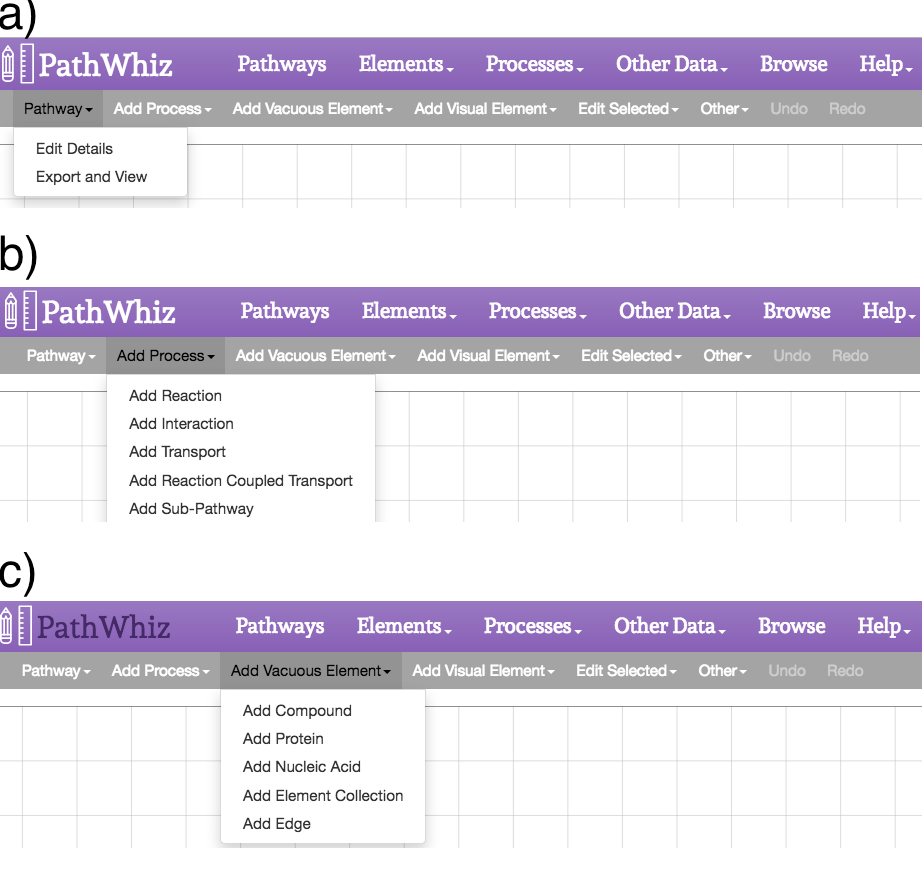
Figure 2: Pathway Editor Menus. The editor menus provide options to add processes and elements, as well as to edit the existing elements and the canvas. (a) The "Pathway" link offers options to "Edit Details" and "Export and View". The "Edit Details" option permits the editing of the pathway description and references while the "Export and View" option permits the generation or regeneration of the image files. (b) The "Add Process" link offers options for adding a reaction, interaction, binding event, transport event, reaction coupled transport, or sub-pathway to the canvas. (c) The "Add Vacuous Element" link offers options for adding a compound, a protein, a nucleic acid, an element collection, or an edge to the canvas. These elements will show up in the upper left corner of the canvas. An arbitrary element will appear in the canvas alongside the pop-up sidebar, where the user can search for the desired element or change the details of said element. The element should be incorporated into the pathway before adding any new vacuous elements, in order to maintain pathway neatness. Please click here to view a larger version of this figure.

Figure 3: Pathway Index Form. The pathway index offers a collection of currently existing pathways and a search box to query for specific pathways. Pathways can be filtered by name, type, species, and creator using the filter bar on the top of the index table. They can also be searched by name using the search bar at the top of the page. Opening up the "Advanced Search" allows more specific searches by combinations of biological state, type, species, compound, and protein. The advanced search allows the use of AND, OR, and NOT logical operators to create complex queries. Each pathway includes 5 buttons: "Show", "Edit", "Draw", "Destroy" and "Replicate". The "Show" button allows viewing of the pathway using the Viewer. The "Edit" button allows editing of the pathway metadata, including name, type, species, description and reference. The "Draw" button allows editing of the canvas containing the pathway. The "Destroy" button allows removal of the pathway from the database (if the user has permission). The "Replicate" button allows replication of the selected pathway. The "Previous" and "Next" buttons allow the user to navigate between pages of pathways. Please click here to view a larger version of this figure.

Figure 4: Create New Pathway Form. The "New Pathway" button (see Figure 3) leads to the pathway form shown here. This form contains fields for the pathway's name, type, species, and description. The "New Pathway" button also allows one to start from an existing pathway and add references. Please click here to view a larger version of this figure.

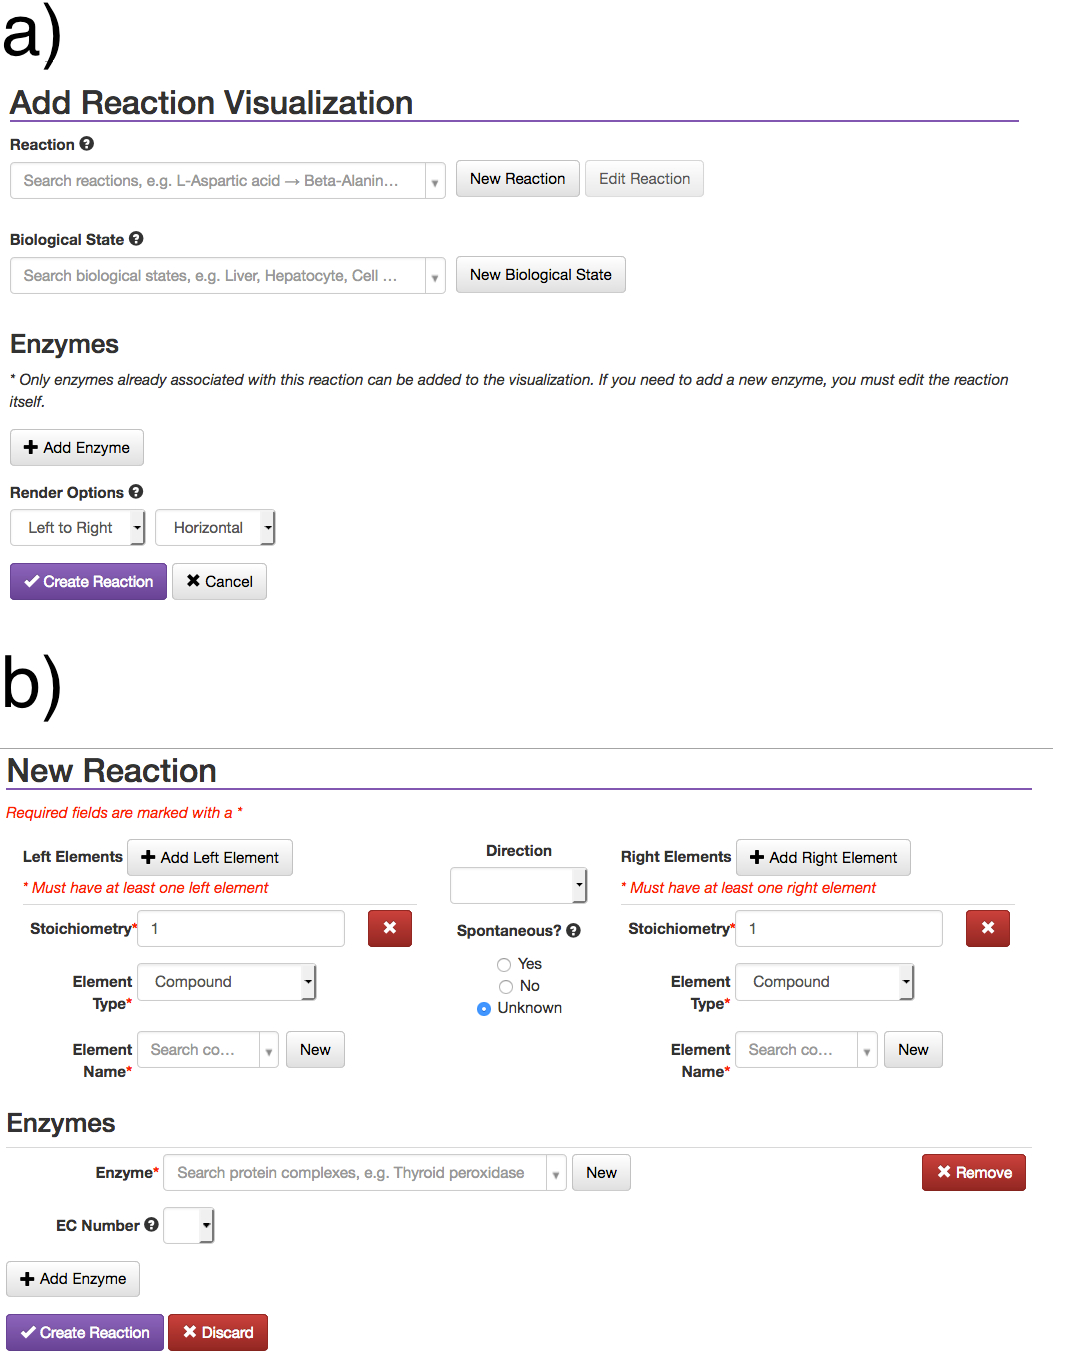
Figure 5: Create New Reaction Form. The "Add Process" link allows users to add a new process, such as a reaction or binding event. Adding a Process creates a reaction model, from which reaction visualizations can be generated and added to pathway diagrams. The reaction model and visualization are separate entities. (a) The reaction field permits searching for an existing reaction, by reactant, product, or enzyme. The biological state field permits searching and selecting an existing biological state. Once a reaction is chosen, the corresponding enzymes can be added using the "Add Enzyme" button, which will bring up an enzyme autocomplete box. The render options allow for the user to choose the direction they wish the reaction to be rendered. A new reaction can be created through the (b) "New Reaction" button, which leads to a New Reaction form where elements and enzymes can be added. Once all the fields are filled in, the reaction can be created through the "Create Reaction" button. To edit the underlying reaction model one should exit the pathway illustrator, go to the reaction index, and find and edit the reaction there. In order to prevent data discrepancies and unintentionally altering existing pathways, it is not possible to change the reactants/products or remove enzymes from a reaction model if it already has visualizations in existing pathways. Thus, editing the reaction model does not automatically update existing reaction visualizations. In order to change a reaction model one must re-add the corresponding visualization to the pathway diagram for the changes to appear. Please click here to view a larger version of this figure.

Figure 6: Pathway Viewer. The top right viewer interface buttons provide basic navigation, zooming, and screen toggling actions. The central viewport displays the pathway that can be navigated by clicking and dragging, or zooming using a mouse. The pathway elements displayed are hyperlinked to other pathways and databases (e.g. HMDB, DrugBank, UniProt). The side menu bar displays a description of the pathway with references supplied by the user. The side menu also displays the tabs "Highlight", "Analyze", "Downloads", and "Settings". The "Highlight" tab allows compounds and enzymes to be selected and highlighted in red. The "Analyze" tab allows experimental concentration data to be entered, which is then mapped to the pathway using a color gradient. The "Downloads" tab offers links to the corresponding downloadable image files and data exchange files. The PNG file is a smaller non-vector image file. The SVG + BioPAX links provide larger vector image files with embedded BioPAX, for machine-readability. The BioPAX, SBML, SBGN, and PWML links provide different machine-readable formats. The "Settings" tab allows for visual customization of the displayed pathway image. Please click here to view a larger version of this figure.

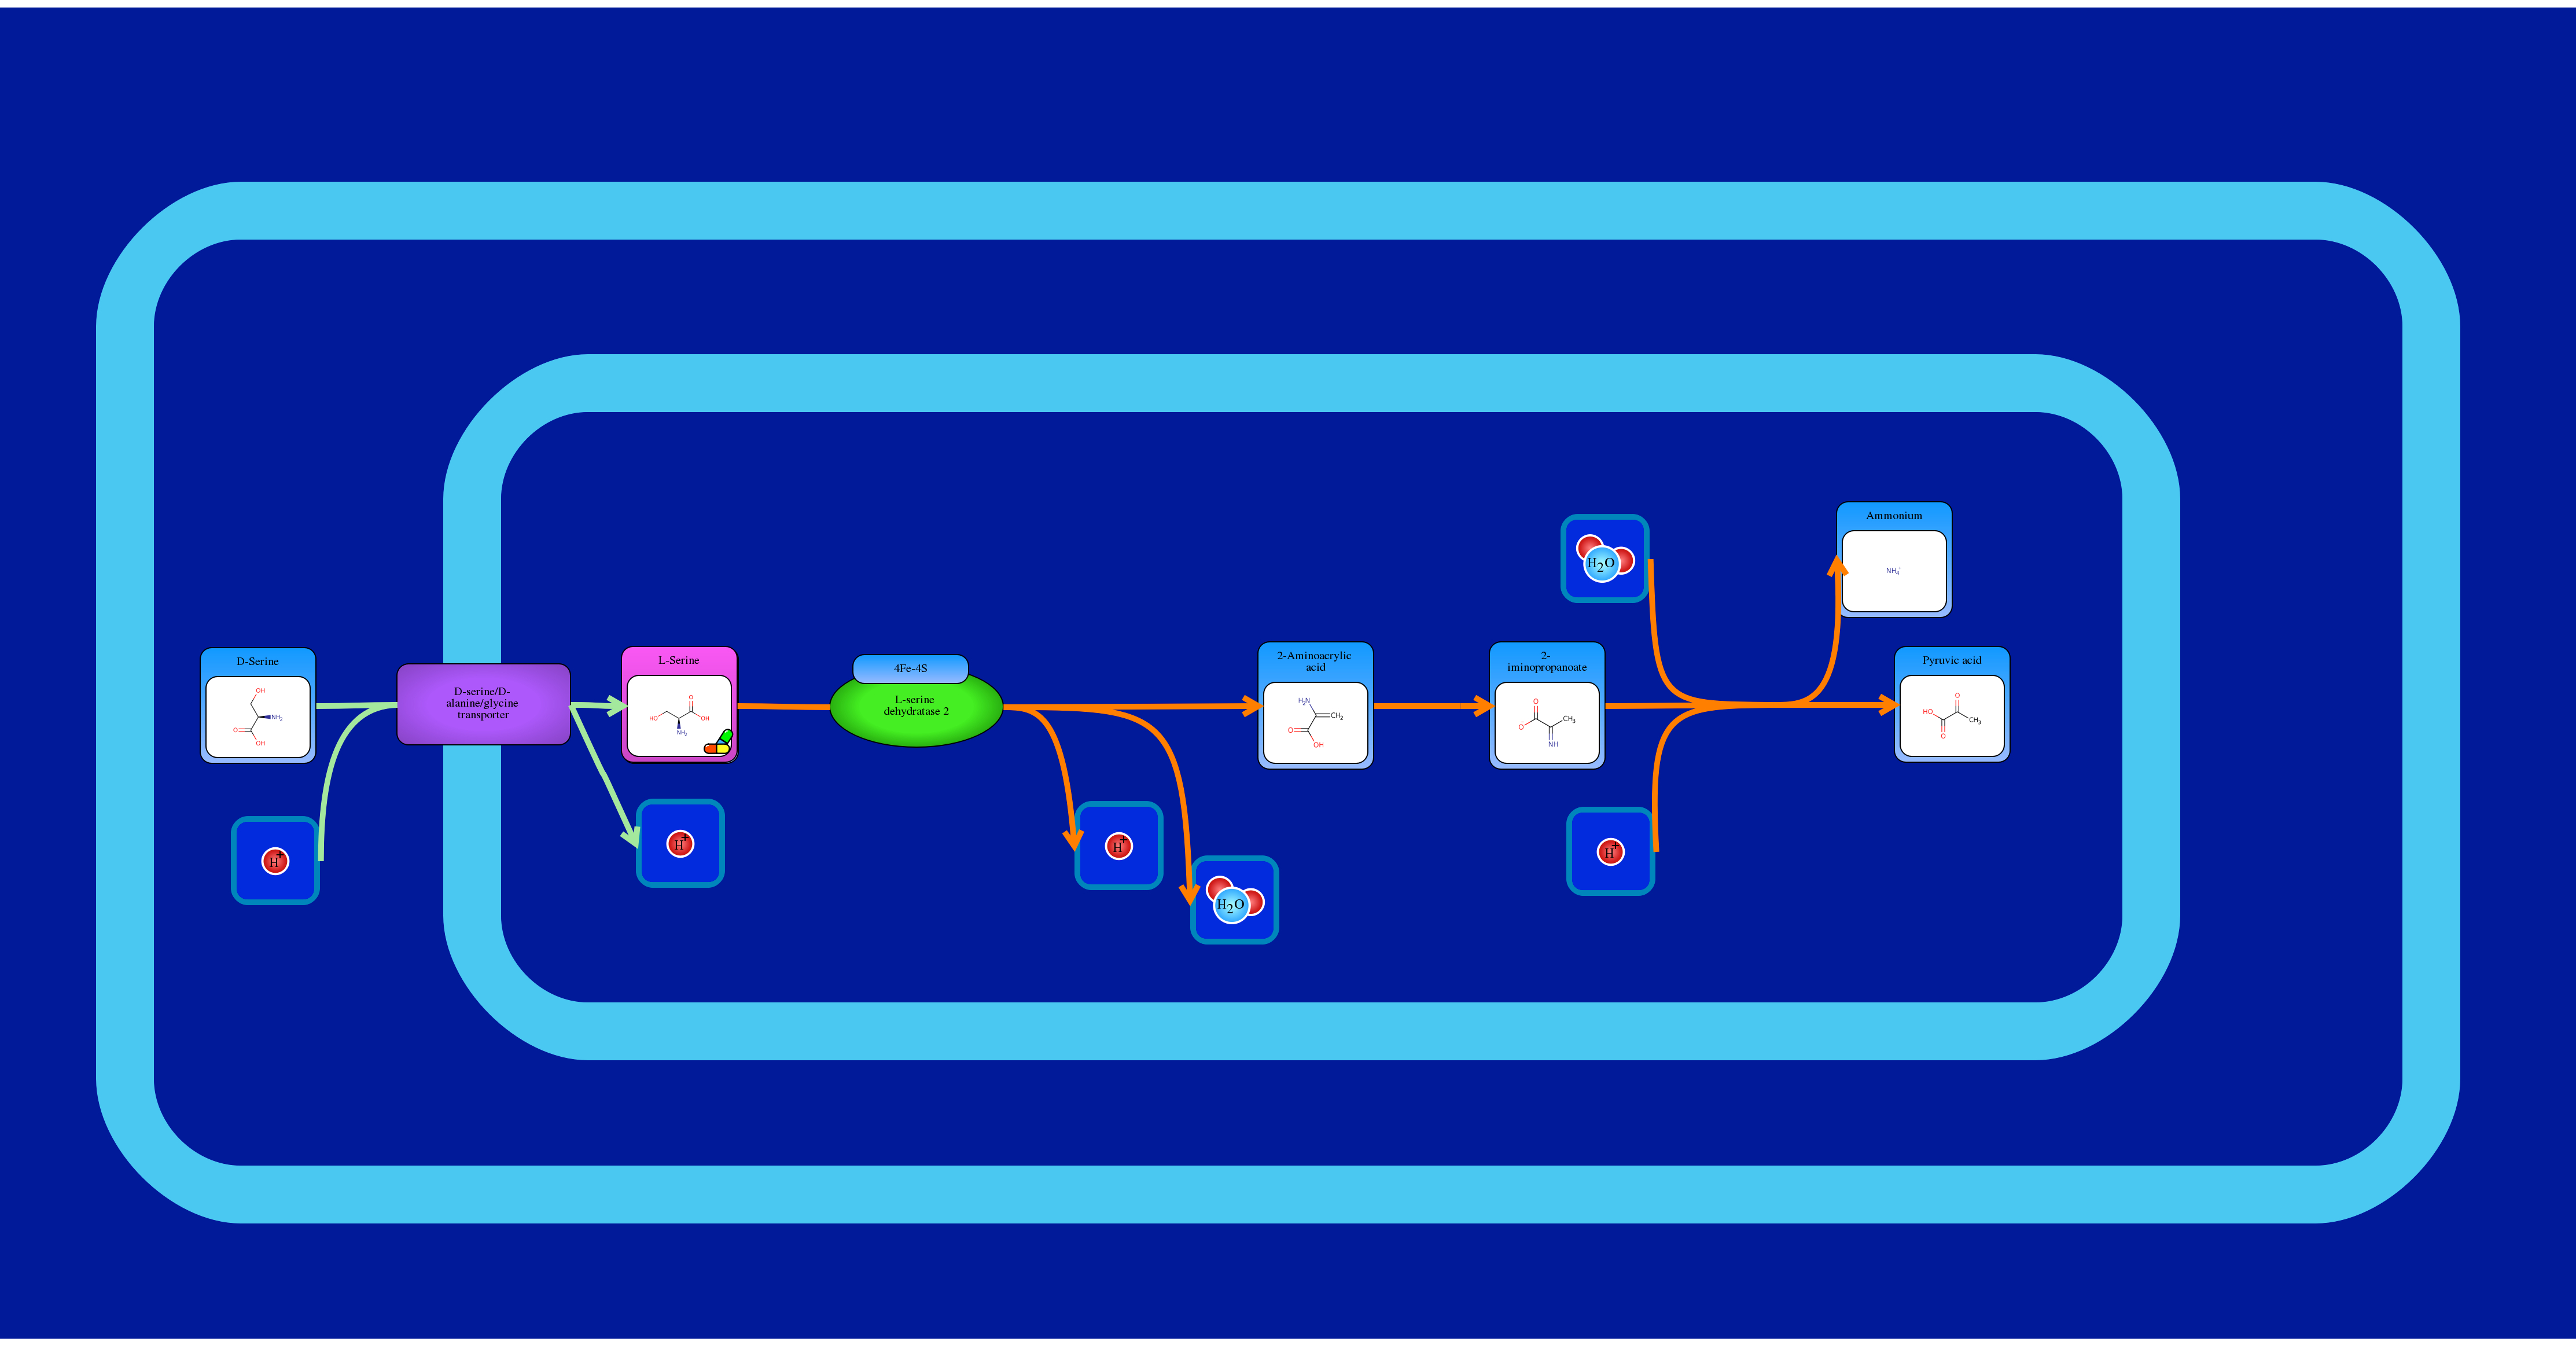
Figure 7: Metabolic Pathway Image. This is an example of a "traditional" metabolic pathway that describes the biosynthesis and degradation of a particular compound (D-serine). The main metabolite is positioned in the center of the canvas and the reaction and transport arrows (edges) show the flow of the pathway. Edges and elements can automatically be "snapped" together, i.e. connected. Element snap points are indicated by transparent red circles on the element sides, and edge start/end points are represented by transparent grey circles on edge ends. Snap points turn a transparent green when hovered over, and a solid green when selected. In order to snap an edge to an element, first click on either the edge start/end or the element snap point (it will turn solid green). Then click on the edge start/end or the element snap point that needs to be connected. The edge will automatically connect itself to the snap point, and remain connected until it's removed (by double clicking the edge and dragging the end point away, or connecting it to a different snap point). It is important to be mindful of accidentally selecting snap points, since this can have unintended consequences when attempting to move edges around. The solid green color of selected snap points is meant to alert the user to snap points they have currently selected. Snap points can be deselected by clicking on them a second time. Edges can also be reconnected to their original elements. When an edge is selected, visiting the "Edit Selected" menu link and then the "Edit Edge" link. This will bring up options to automatically connect the edge in different directions. Please click here to view a larger version of this figure.

Figure 8: Disease Pathway Image. This is an example of a disease pathway that shows the organs affected by the disease (Sarcosine Oncometabolite pathway). Additional image elements are used to depict the increase or decrease in the metabolite concentrations and their accumulation or dissipation. Please click here to view a larger version of this figure.

Figure 9: Drug Pathway Image. This is an example of a drug pathway that shows the organs where the drug is metabolized (Ibuprofen Pathway). The color surrounding the drug metabolite is usually depicted as pink. Please click here to view a larger version of this figure.

Figure 10: Protein Signaling Pathway Image. This is an example of a signaling pathway that shows a collection of signaling reactions between different proteins (EGFR Pathway). Proteins can be depicted with multiple colors and they can be represented either by the protein name or the subunit name. Please click here to view a larger version of this figure.

Figure 11: Colorful vs Simple Pathway Images. Colorful pathways can be generated with rich biological context on either a white or blue background (a). Folate metabolism is depicted here. Simple, KEGG-like pathways can also be generated using a simple black and white representation (b). Please click here to view a larger version of this figure.

Figure 12: Suboptimal Pathway Image. An image depicting what a suboptimal pathway (TCA Cycle) looks like. Overlapping elements and crossing edges make the pathway incomprehensible. This can happen if the reaction elements are not carefully or correctly manipulated on the canvas. Manipulating the elements to have more than two different template types for the compounds (Large, Medium, Small Compound Visualization or Drug Visualization, Cofactor Visualization, Simple Bottom, Left Right or Top Visualization) leads to several image inconsistencies. The template types are shown in step 1.15.2. Not connecting the edges affects the flow of the image leading to poor interpretations of the pathway. Please click here to view a larger version of this figure.
| PathWhiz | VANTED | PathVisio | Pathway Tools | VisANT | |
| Web Server | Yes | No | No | No | No |
| Installable Program | No | Yes | Yes | Yes | Yes |
| Protein Pathways | Yes | Yes | Yes | No | Yes |
| Metabolic Pathways | Yes | Yes | Yes | Yes | Yes |
| Save as PNG/JPG | Yes | Yes | Yes | No | No |
| Save as HTML | Yes | No | No | Yes | No |
| Save as SVG | Yes | Yes | Yes | No | Yes |
| Save as PDF | Yes | Yes | Yes | Yes | Yes |
| Save as BioPAX | Yes | Yes | Yes | Yes | Yes |
| Save as SBML | Yes | Yes | Yes | Yes | Yes |
| Save as SBGN-ML | Yes | Yes | Yes | No | No |
| Identifier Mapping | Yes | Yes | Yes | Yes | Yes |
| Membrane Rendering | Yes | No | No | No | No |
| Organelle Rendering | Yes | No | No | No | No |
| Organ Rendering | Yes | No | No | No | No |
| Color Rich Images | Yes | No | No | No | No |
| Pathway Description | Yes | No | No | Yes | No |
| Pathway DB Link | Yes | No | Yes | Yes | No |
| Pathway Inference | Yes | No | No | Yes | No |
| Expt. Data Overlay | No | Yes | No | Yes | Yes |
| Pathway Analysis | No | Yes | Yes | Yes | Yes |
Table 1: Feature Comparison. A feature comparison of several common pathway editing/rendering tools.
Supplementary File 1: Example of TCA Cycle Description for PathWhiz Pathway. Click here to download the Supplementary File.
Discussion
The protocol described here for creating a simple metabolic pathway (the TCA cycle) can be adapted to create a wide variety of machine-readable, biologically complex pathways for any species. Furthermore, this protocol also describes how one can replicate or propagate existing pathways created by other users. Constructing a pathway using this tool requires repeated step-by-step additions of reactions, interactions, transport processes, and sub-pathways, each of which are connected by overlapping elements. Putting all of these together allows one to create colorful, visually pleasing pathway diagrams that provide considerable biological detail and useful biological context. The steps described in this protocol are relatively simple, and the time it takes to build a pathway diagram depends on the size and complexity of the pathway. With a bit of practice, most individuals can render a high quality pathway diagram consisting of about 15-20 reactions or processes and several cellular components in about 15 min. A brand new user may take up to 30-40 min to generate a pathway of similar size and complexity. The time needed to generate a pathway is roughly linear with the number of reactions/processes that need to be rendered.
Creating a high quality pathway through this web-based tool depends on the quality and detail of the source material (pathways from books, online databases, experimental data, hand-drawn sketches) and the fastidiousness of the pathway "artist". Those wishing to generate higher quality pathway diagrams should pay particular attention to sections 1.11, 1.15 and 1.20 of the protocol, since these sections describe the creation and editing of reaction elements (reactants/products, enzymes, edges, images, zoom boxes, labels, and membranes). The best pathway diagrams will intelligently amalgamate information from as many existing representations of the pathway as possible including those found in books, posters, papers, and online databases. Another key to generating high quality pathways is carefully checking the correctness of the reactions before creating a reaction (through section 1.11 of the protocol). Taking the time and effort to ensure the reactants, products, and enzymes involved (many of which already exist in PathWhiz's large database) are correct for each species is very important. It is also important to be aware of the cellular location of the reactions and to include key cellular or subcellular components in order to provide the correct biological context. This can be done by checking and corroborating the reaction through online databases such as UniProt. Having all the required information at hand, along with a rough, hand-drawn sketch of the pathway to be created will greatly reduce errors and the overall time spent on drawing or rendering.
As might be expected, larger and more complex pathways will take longer to render, particularly if the desired elements and processes are not already in PathWhiz's database. When working with larger pathways, it is usually wise to switch from the Autosave mode to the Manual save mode, in order to prevent a long lag between actions. When replicating a pathway, the amount of time the user might wait for the pathway to be generated depends on the number of elements in the pathway. Most pathways can be replicated in about 1-2 min. When propagating a pathway, successful rendering of the newly propagated pathway depends on how similar the two species are, as PathWhiz uses BLAST17 sequence searches to find homologous enzymes between species. Larger pathways will be slower to propagate because BLAST will need to be run on a greater number of enzymes. Attempting to propagate pathways between significantly dissimilar species (say between yeast and humans) will result in pathways being rendered with a number of unknown proteins. These "distantly" propagated pathways will usually require additional manual editing. Due to the highly visual nature of pathway diagrams and the detail that can be brought to a pathway, it is always a good idea to work on a computer with a reasonably large screen (>20 inches or >50 cm) and a good internet connection (>5 mbps).
If problems with rendering or screen refreshing are encountered, the user may have to do a small amount of troubleshooting. If a large, complex pathway takes too long to update, the user may have to refresh the page. If a pathway does not propagate as expected, the user may have to do some manual editing to ensure that all elements are displayed correctly. Also, as a more specific example, if elements of a reaction are not displayed, the user may have to make sure that all elements or enzymes are properly selected and the edges are not hidden. The "Help" link on the main header may be useful if a problem is encountered. A tutorial is available under the "Tutorial" tab and a user manual is available under "User Guides" tab. Both explain many of the tool's features in detail. The User Guide may be used to troubleshoot or explain potential limitations for a particular feature, such as when a user locks a pathway and later wishes to edit it.
As highlighted through this protocol and through the examples provided in the accompanying figures, this tool offers a number of unique features not found in any (or most) other pathway drawing tools (see Table 1). First, it is fully web-based and completely platform-independent. Second, it supports the rendering and facile generation of multicolored, biologically complex, visually pleasing, fully hyperlinked pathway diagrams that can also be converted to machine-readable formats (BioPAX, SBGN-ML18, SBML19, PWML14). Third, pathway diagrams generated by this tool can be browsed, searched, selected and easily explored through an easy-to-use online database and viewing interface. Fourth, the web tool is designed to support community pathway contributions, allowing for "pathway crowd sourcing" that encourages the sharing and generation of new pathways and new pathway elements.
Pathways generated by this web based tool can be used for a variety of applications. Richly detailed, fully hyperlinked pathways can be readily integrated into organism-specific databases for proteomics, metabolomics or systems biology applications. Internet-accessible pathways are especially useful for education and training purposes, as the details available through web-based images are often much greater than what can be displayed via a static image or through a single textbook or journal page. This web based tool also supports the generation of pathway representations that are more suited for printing and publication. As a result, many images generated by this web based tool are appearing in papers, posters and slide presentations. Exporting pathways into text-based data exchange file formats (such as BioPAX and SBML) allows for pathways generated using this web server to be used directly in computational analysis for systems biology or metabolic modeling applications. Propagating pathways between species allows inferences to be made about biological processes, especially among those species that have been very recently sequenced. While not all existing pathways currently exist in PathWhiz, its public pathway database continues to grow, leading to the emergence of new, crowd-sourced pathway collections. These collections will not only be readily extendable to new species, they will hopefully lead to a deeper understanding of their unique biology and biochemistry.
Disclosures
The authors have nothing to disclose.
Acknowledgements
The authors wish to thank the Canadian Institutes of Health Research (CIHR) and Genome Alberta, a division of Genome Canada, for financial support.
Materials
| Name | Company | Catalog Number | Comments |
| Computer with colour screen | N/A | N/A | >20 inches or >50 cm |
| Internet connection | N/A | N/A | >5 mbps |
| Modern web browser | N/A | N/A | Google Chrome (v. 31 and above), Internet Explorer (v. 9 and above), Safari (v. 7 and above), Opera (v. 15 and above) and Firefox (v. 23 and above) |
References
- Michal, G. On representation of metabolic pathways. Biosystems. 47 (1-2), 1-7 (1998).
- Kanehisa, M., Sato, Y., Kawashima, M., Furumichi, M., Tanabe, M. KEGG as a reference resource for gene and protein annotation. Nucleic Acids Res. 44 (D1), D457-D462 (2016).
- Karp, P., Riley, M., Paley, S. The MetaCyc Database. Nucleic Acids Res. 30 (1), 59-61 (2002).
- Kelder, T., et al. WikiPathways: building research communities on biological pathways. Nucleic Acids Res. 40 (Database issue), D1301-D1307 (2011).
- Croft, D., et al. The Reactome pathway knowledgebase). Nucleic Acids Res. 42 (Database issue), D472-D477 (2014).
- Karp, P. D., et al. Pathway Tools version 13.0: integrated software for pathway/genome informatics and systems biology. Brief Bioinform. 11 (1), 40-79 (2010).
- Van Iersel, M. P., et al. Presenting and exploring biological pathways with PathVisio. BMC Bioinformatics. 9, 399(2008).
- Demir, E., et al. The BioPAX community standard for pathway data sharing. Nat. Biotechnol. 28 (9), 935-942 (2010).
- Shannon, P., et al. Cytoscape: A Software Environment for Integrated Models of Biomolecular Interaction Networks. Genome Res. 13 (11), 2498-2504 (2003).
- Salomonis, N., et al. GenMAPP 2: new features and resources for pathway analysis. BMC Bioinformatics. 8, 217(2007).
- Elliott, B., et al. PathCase: pathways database system. Bioinformatics. 24 (21), 2526-2533 (2008).
- Hu, Z., et al. VisANT 3.0: new modules for pathway visualization, editing, prediction and construction. Nucleic Acids Res. 35 (Web Server), W625-W632 (2007).
- Jewison, T., et al. SMPDB 2.0: Big Improvements to the Small Molecule Pathway Database. Nucleic Acids Res. 42 (D1), D478-D484 (2013).
- Pon, A., et al. Pathways with PathWhiz. Nucleic Acids Res. 43 (W1), W552-W559 (2015).
- Sajed, T., et al. ECMDB 2.0: A richer resource for understanding the biochemistry of E. coli. Nucleic Acids Res. 44 (D1), D495-D501 (2015).
- Wishart, D., Mandal, R., Stanislaus, A., Ramirez-Gaona, M. Cancer Metabolomics and the Human Metabolome Database. Metabolites. 6 (1), 10(2016).
- Altschul, S. F., Gish, W., Miller, W., Myers, E. W., Lipman, D. J. Basic local alignment search tool. J. Mol. Biol. 215 (3), 403-410 (1990).
- Le Novere, N., et al. The Systems Biology Graphical Notation. Nat. Biotechnol. 27 (8), 735-741 (2009).
- Hucka, M., et al. The systems biology markup language (SBML): a medium for representation and exchange of biochemical network models. Bioinformatics. 19 (4), 524-531 (2003).
Reprints and Permissions
Request permission to reuse the text or figures of this JoVE article
Request PermissionExplore More Articles
This article has been published
Video Coming Soon
Copyright © 2025 MyJoVE Corporation. All rights reserved