
A subscription to JoVE is required to view this content. Sign in or start your free trial.
Method Article
Using a Virtual Store As a Research Tool to Investigate Consumer In-store Behavior
In This Article
Summary
This paper describes the use of a desktop virtual store to create virtual shopping environments to investigate in-store consumer behavior. A description of the protocol to build and run experiments, example results from an experiment concerning store layout, and important considerations when conducting virtual store experiments are presented.
Abstract
People's responses to products and/or choice environments are crucial to understanding in-store consumer behaviors. Currently, there are various approaches (e.g., surveys or laboratory settings) to study in-store behaviors, but the external validity of these is limited by their poor capability to resemble realistic choice environments. In addition, building a real store to meet experimental conditions while controlling for undesirable effects is costly and highly difficult. A virtual store developed by virtual reality techniques potentially transcends these limitations by offering the simulation of a 3D virtual store environment in a realistic, flexible, and cost-efficient way. In particular, a virtual store interactively allows consumers (participants) to experience and interact with objects in a tightly controlled yet realistic setting. This paper presents the key elements of using a desktop virtual store to study in-store consumer behavior. Descriptions of the protocol steps to: 1) build the experimental store, 2) prepare the data management program, 3) run the virtual store experiment, and 4) organize and export data from the data management program are presented. The virtual store enables participants to navigate through the store, choose a product from alternatives, and select or return products. Moreover, consumer-related shopping behaviors (e.g., shopping time, walking speed, and number and type of products examined and bought) can also be collected. The protocol is illustrated with an example of a store layout experiment showing that shelf length and shelf orientation influence shopping- and movement-related behaviors. This demonstrates that the use of a virtual store facilitates the study of consumer responses. The virtual store can be especially helpful when examining factors that are costly or difficult to change in real life (e.g., overall store layout), products that are not presently available in the market, and routinized behaviors in familiar environments.
Introduction
It is undeniable that understanding consumers' in-store behavior is of critical importance to achieve effective retail marketing. To aid in this understanding, advanced virtual reality technology, known as the virtual store, can enable studies of consumer behavior using computationally created virtual environments. The virtual-store approach uses a virtual reality system to generate realistic and immersive three-dimensional virtual store environments in which people can interact with the objects in the store. In such virtual store environments, people experience artificially created sensory experiences. Virtual store environments can be either realistic representations of store environments that exist in reality, or imaginary store environments. In addition, the virtual store can be seen as an intermediate tool between traditional consumer research (i.e., text-based surveys, focus groups, or lab experiments), controlled field experiments (i.e., in mock store environments), and field studies (i.e., video captures, personal observations, or tests of product sales promotion)1.
Virtual reality applications have considerable research history. As early as 1965, Sutherland2 described his "ultimate display" concept, which includes a virtual world that provides sound and tactile feedback. Originally, attention was mainly focused on the technological hardware, but as this does not provide insights into the effects of virtual reality systems, attention has shifted to the human experience3,4. The sense of "presence," of being in the computer-generated world, has consequently become a key to virtual-reality experiences5,6. Presence has been defined as the "subjective experience of being in an environment, even when one is physically situated in another".7 From this point of view, "sense of presence" can be retrieved from a participant and refers to the extent to which a person perceives him/herself to be in an environment. Alternatively, Slater8 has distinguished between the concepts of presence and immersion, called "place illusion" (PI) and "plausibility illusion" (Psi). PI relates to having a sensation of being in a real place. It is assessed by a set of valid actions or responses that participants can perform to change their perceptions or the environment (e.g., moving the head and eye to change the gaze direction or grasping some object to move it). PI is high when a similar set of responses to change perceptions are required in the virtual reality system compared to the response expected in an equivalent physical environment. Psi accounts for what is perceived in the virtual reality, referring to the illusion that it is actually occurring. A vital component that can lead to Psi is for the virtual reality to provide the illusion that events in the virtual environment over which a participant does not have direct control refer directly to him/herself. Psi can be measured by tracing any actions or responses that people manifest in response to changes in the virtual reality that originated from outside. For example, if people's heart rates increase when they see an avatar in the virtual environment, this can represent a similar reaction to the real world. Thus, this virtual reality system provides high Psi.
The virtual store technology has been introduced in business and academics to serve several purposes. It can be used as a managerial aid, for instance to assist category managers of companies in developing a shelf plan for their products. Virtual stores also have their use in clinical settings, to measure emotional responses to food for patients with an eating disorder1 or as a screening tool for mild cognitive impairment9. A more common use of virtual stores in research, however, is to assess consumer in-store behavior and consumer responses to changes in the store environment, such as price changes10,11,12, different setups of point-of-sale displays13, different packaging options14, different nutritional labels on the backsides of product packages15, and stock levels16. In addition, the virtual store is currently used to help create and test public health interventions to stimulate healthier food choices among children17. Due to various benefits stated previously, virtual store technology and hardware are in rapid development. Therefore, this paper will focus on the human experience and describe the essential elements of studies using virtual reality in general. All essential information obtained from the current virtual store system will be demonstrated.
Currently available virtual store systems can be briefly categorized as: 1) non-immersive (e.g., desktop), 2) semi-immersive (e.g., projection, CAVE-systems), and 3) fully-immersive (e.g., head-mounted displays). Each system likely brings different levels of immersion, presence, PI, and Psi depending upon the support system. However, because the measures of immersion, presence, PI, and Psi are bound to the specific sensorimotor contingencies that each system supports, a comparison of these indicators across different systems has been deemed impossible8. In recent years, desktop virtual stores have received more attention and have been used increasingly in research. Even though the virtual store has been regarded as a promising tool for in-store consumer behavior research, expertise on how to use such a virtual store is required to ensure the timely and correct preparation and implementation of experiments. However, up to now, reported studies that comprehensively describe the procedure to conduct virtual store experiments are very scarce. Therefore, this work aims to describe a protocol for conducting consumer research with the desktop virtual store, which is of vital importance.
Generally, research with a virtual store requires: 1) equipment to display the virtual environment, 2) an editor program to enable researchers to build the virtual environment, 3) a virtual representation of the studied object (e.g., several elements of a store and products), 4) a consumer interface to navigate the virtual environment and make choices, 5) procedures for running the data collection itself, and 6) a data management system that facilitates data storage and analysis. Most of these will likely be managed by a virtual shop company and a programmer. Researchers should know: 1) how to create a retail store for an experiment in an editor program, 2) how to run data collection with the consumer interface, and 3) how to organize all outputs in the data management program and export outputs to be put into a statistical program. The current paper will address this information by giving detailed protocol steps for conducting experiments with the desktop virtual store. Additionally, advantages and limitations of using the virtual store in consumer research will be discussed. The detailed protocol described in this paper can be used to help researchers start and conduct virtual store research.
The desktop virtual store used in this paper requires hardware (i.e., personal computers (PC), liquid-crystal display (LCD) screens, a three-dimensional (3D) space navigator, a mouse, and a keyboard) and software (i.e., to design a shop and to shop like a consumer in a 3D virtual store). This particular system has been used in prior studies14,18.
Protocol
The protocol adheres to the "Generic Protocol Food Choice Simulator," which complies with the Netherlands Code of Conduct for Scientific Practice and has been approved by the Social Sciences Ethics Committee of Wageningen University.
1. Setting Up the Virtual Store Equipment
- Prepare a sufficiently spacious location for the virtual store display. Prepare all equipment for both the virtual store and the data management program.
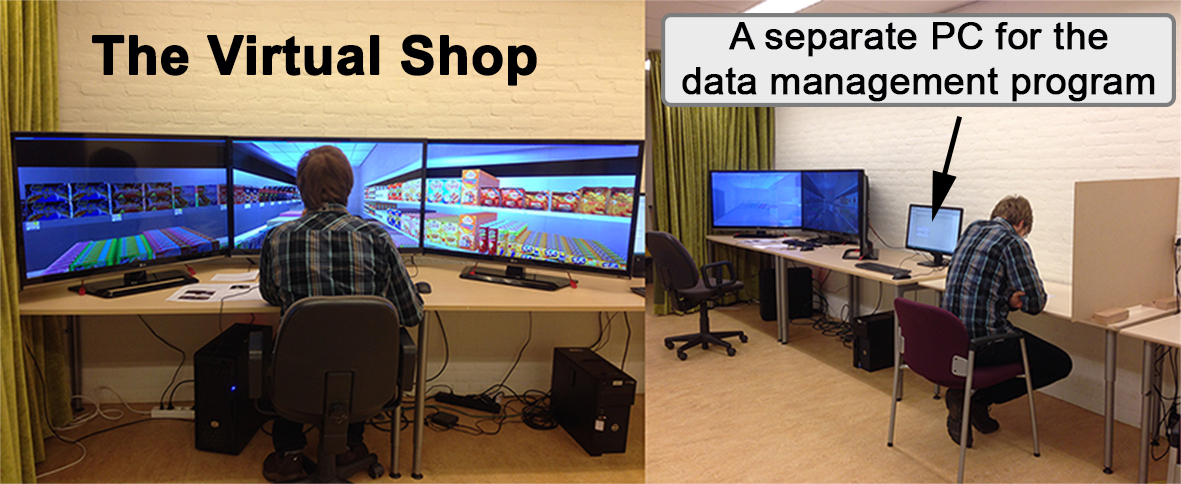
Note: The equipment includes two computers (PCs; 1 virtual store PC with a high-capacity memory card for displaying the virtual store, and 1 PC for the data management program), three 42 inch LCD screens, a computer screen for displaying the data management program, connecting cables, electronic sockets, a 3D space navigator, 2 mice, and 2 keyboards. - Connect all the equipment together, as demonstrated in Figure 1.
- Connect one PC to a computer screen, a keyboard, and a mouse to use the data management program.
- Place 3 LCD screens next to each other and adjust the left and right screens to give a 180° field-of-view of the virtual store that appears on the screens.
- Connect the virtual store PC with the 3 LCD screens, the 3D space navigator, a mouse, and a keyboard. Connect the virtual store PC with the data management PC.
- Turn both PCs on and adjust the screen resolution of the virtual store PC to "extend multiple display." Set the left screen to be the main display.

Figure 1: The virtual store setup. The virtual store uses one PC equipped with three 42 inch LCD screens that render 180° visibility. A separate PC is added to accommodate the data management program. This PC enables a research coordinator to monitor the progress and to start new virtual environments without interrupting participants. Please click here to view a larger version of this figure.
2. Building Virtual Stores for Experiments
- Open the virtual store builder interface (called the editor) by double-clicking on the "VirtualShop_Editor.exe" icon on the desktop.
- Open a store template that is suitable for the study by clicking "File" and clicking "open." Select the desired store template, "Name.ShopConfig" (e.g., Supermarket001.ShopConfig).
- Modify the store regarding the experimental conditions.
Note: Before modifying the store, a plan of the virtual store should be made based on the research questions and objectives of the study. This includes the type, placement, and number of shelves; the location of product categories on these shelves; and the type and location of products within the product categories.- Replace existing products with products of interest, where needed.
- Use the right mouse button and move the mouse to zoom in and out to product shelf. And use the left mouse button and move the mouse to change the viewpoint.
- Click on the icons on the left menu bar to change the view of the virtual store (i.e., left yellow face = front view, top yellow face = top view, right yellow face = side view, and all lateral yellow faces = home view (looking from the top-left of the store)).
- Double-click on a shelf or product and click on the icons on the left menu bar to change the view of this shelf or product.
- Double-click on a shelf of interest and click on the "yellow spot" in the left menu bar to select the isolation mode.
Note: The isolation mode enables the researcher to isolate a shelf with products and to filter out other objects from the screen. This is helpful when filling the shelfs. - Double-click on an existing product and subsequently press the "Delete" button on the keyboard to delete this product.
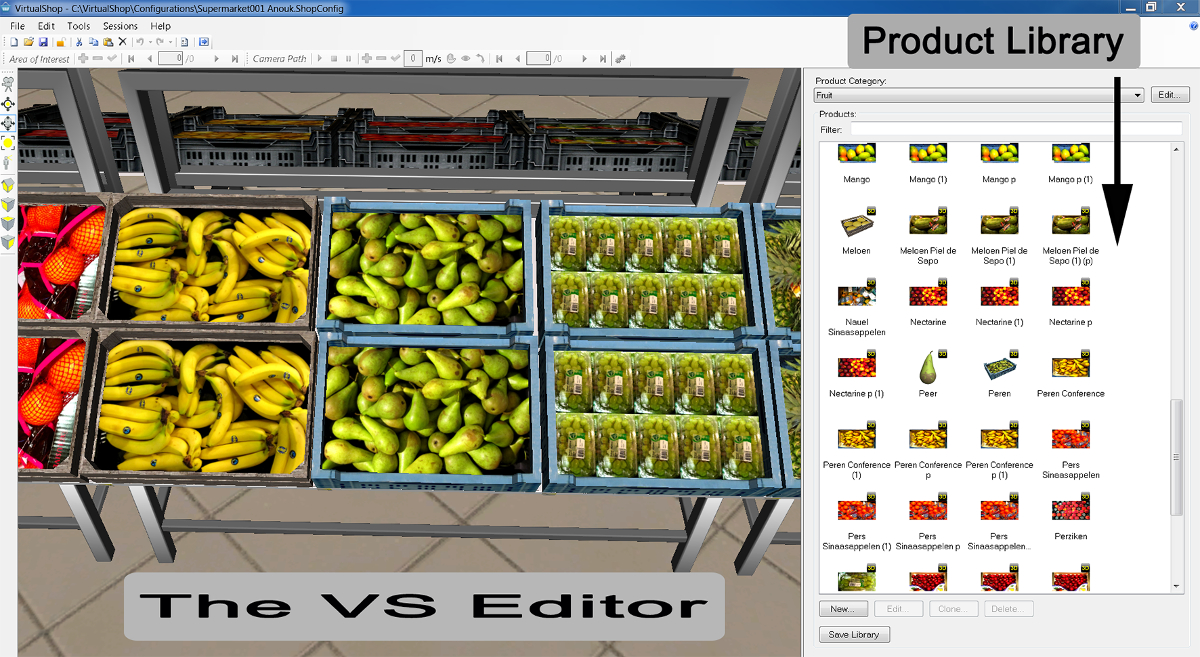
- Click on the "blue arrow" in the menu bar to open the product library (see Figure 2). Afterwards, click "Product Category" and then select the product category of interest (e.g., fruit).
- Drag a selected product (e.g., a tray of apples) by holding the left mouse button and place the product on the desired shelf.
- Add or replace all the products to match the research interests by repeating the steps from 3.1.1-3.1.4.
- Relocate entire shelves.
- Double-click a shelf that needs to be relocated. Move the shelf to the desired location by left-clicking the entire shelf and dragging the shelf to a new location.
- Rotate the shelf (if necessary) by holding down the "Ctrl" key and left-clicking the shelf. Turn or move the shelf to the desired angle by moving the mouse.
- Relocate all necessary shelves to match research interests by repeating steps 2.3.2.1 and 2.3.2.2.
- Replace existing products with products of interest, where needed.

Figure 2: The virtual shop editor and examples of products in the product library. The editor has a drag-and-drop interface to allow researchers to easily select products from the library and directly place them on the shelves. In addition, a pop-up window can be used to either add or edit a product by clicking on a product in the library. Please click here to view a larger version of this figure.
- Save the completed store configuration by using a file name that is non-descriptive of the research condition. Click "File" → "save as" → "Name.ShopConfig" → "save."
Note: It is also possible to build a store from an empty store template. Start by selecting and adding shelves and products from the product library to the empty store. The same procedure from steps 3.1 and 3.2 can be applied. - Build a separate store for a practice session and build more stores according to the experimental conditions, such as supermarkets with different store layouts, following steps from 2.1-2.4.
Note: The example study uses a pharmacy as a practice store. - Ask the program creator (see the Table of Materials/Reagents for contact details) to create new walking paths and decision points for participants if the store layouts are different than the existing store templates.
Note: Shopping paths and decision points are available for the existing store templates. It is also possible to allow participants to walk freely in the store, without predetermined shopping paths.
3. Preparing the Data Management Program to Record Data
- Double-click on the data management program icon on the desktop to start the program.
- Open the "Virtual Shop Exp_StartUp" project to create a new project. Select "Open" on the pop up window → "Virtual Shop Exp_StartUp" → "Virtual Shop Exp_StartUp.vop."
- Click on "Set up project" and select "Live Observation" as an observation source. Select "Continuous Sampling" as an observation method and select "Open ended observation" as an observation duration.
- Add input variables that represent the experimental conditions (e.g., the store layout and shopping motivation), if desired.
- Click on "Set up" in the top menu bar and then click on "Independent Variable." Click on "Add variable" to add more user-defined variables.
- Fill in necessary details, such as variable name, variable type, predefined value, and so on.
- Save the project by clicking on "File" → "Save as." Name the project, "Name of project.vop" and click "Save."
4. Participant Selection Criteria
- Recruit participants without eye disorders, such as color blindness.
5. Preparation for the Experiment
- Prepare all the documents needed to carry out the experiments.
- Invite a participant to the experiment room. Provide a consent form and request that the participant reads and signs the form prior to the study.
- Provide experimental instructions that the participant must follow. See Supplements 1 and 2.
Note: Participants should be informed that visiting a virtual store can lead to virtual reality sickness19, and they should be urged to report it to the study coordinator when they start experiencing symptoms. If a participant expresses that he/she is experiencing virtual reality sickness, participation in the experiment should be stopped. - Seat the participant in front of the middle LCD screen, at a short distance from the middle screen (~60 cm). Adjust the chair until the participant's eye level matches the position of the screens.
6. Running a Practice Test
- Inform the participant that he/she will be trained in a practice session to control and get familiar with the virtual store. Encourage the participant to ask questions when he/she does not fully understand the instructions.
- Open the virtual store for a practice session.
- Start the virtual shop program by double-clicking on the VirtualShop_Uviewer icon on the desktop. Click "Begin" to enter the store.
- Press the " ` " key on the top-left of the keyboard to open the menu bar of the virtual shop program.
- Select "SpaceNav" in an "Input" box to choose the type of walking behavior that allows the participants to look and to decide their walking direction freely.
Note: "SpeceNav" allows participants to look freely through the virtual environment, in any direction, using the 3D space navigator. It also enables participants to decide their own walking direction. Nevertheless, it restricts participants to following predetermined walking lines. - Select the "Name of a practice store" in the ShopConfig box and type the "Name of environment" to specify the store environment, such as the Practice Store [e.g., Pharmacy 001].
- Click on "Reload shop" to open the practice store, and a "Begin" box will subsequently appear.
- Provide the mouse, 3D space navigator, and keyboard to the participant. Ensure that the front side of the 3D space navigator faces the participant to enable the correct navigation direction.
- Provide instructions on how to maneuver in the virtual store and instructions for the practice session to the participant. The instruction assigns two practice tasks that request that the participant searches for specific products and selects and/or returns some products.
Note: Examples of instructions on how to maneuver in the virtual store and instructions for the practice session are shown in Supplementary Files 1 and 2, respectively. A practice session should include all tasks that a participant may need to perform during the main test. - Allow the participant to freely practice until he/she feels familiar with the virtual store. Ensure that the participant understands clearly how to maneuver in the virtual store before starting the main study. Correct or clarify if the participant has made any mistakes.
- Remind the participant to check the shopping cart (by pressing "F1") before ending the task. Eventually, remind the participant to end the shopping task by pressing "Esc" and then clicking on "Restart."
Note: It is not necessary to close the virtual shop program because it is faster to load the shop for the main test via an opened interface.
7. Running the Main Test
- Move the participant to another area while the virtual store is prepared for the main test. Inform the participant of the tasks that will follow.
Note: Depending on the research objectives, this can include a task to manipulate an independent factor outside the virtual store (in the extensive example, this is a memory task to manipulate shopping motivation), a shopping task (in the virtual store), and a shopping evaluation task (questionnaire). - Administer a task to manipulate an independent variable outside the virtual store when relevant to the study objectives. For example, ask participants to describe in detail a recent shopping situation in which they had either hedonic or utilitarian shopping motivations (see Supplementary File 3).
- Prepare the virtual store for the main study.
- Click on "Begin" to enter the store and press the " ` " button on the top-left of the keyboard to open the menu bar of the virtual shop program.
- Load the virtual store and select the virtual environment (walking path), according to the experimental conditions.
- Keep "SpaceNav" at the box of the Input to obtain the same type of walking behavior as in the practice session.
- Select the "Name of store condition" in the ShopConfig box and type the "Name of store environment" in the environment box, such as "Supermarket001 [Supermarket001]."
- Click on "Reload shop" to open the store for the main test; the "Begin" box will appear.
- Open the data management program on another computer (in which the data management program is installed). Record the data by double-clicking on the data management program icon on the desktop.
- Open the project by double-clicking on the "Name of project.vop" that the researcher has previously saved when preparing the data management program.
- Create a new observation by clicking on "Observe" in the top menu bar and then clicking on "Observation" and "New." Name the observation (e.g., Sample 1) and click "OK."
- Start recording by pressing the red circle button and fill in user-defined variables, such as an experimental condition (e.g., store layout = 1 and shopping motivation = 1 (utilitarian motivation)). Click "OK".
Note: The recording button will change from a circle shape (record) to a square shape (stop). - Ensure that the program starts recording data.
- Ensure that the "Status data plugin" and "Status event plugin" windows show green checkmarks.
- Ensure that "time" is elapsing.
- Ensure that the number of "sample" column in the "Status data plugin" window is growing (shown in Figure 3).

Figure 3: An example of the observation window that signals the recording of data. When the data management program is recording data, the "Status data plugin" window and the "Status event plugin" show a green mark. Also, time should be elapsing and the number of samples should be growing. Please click here to view a larger version of this figure.
- Move the participant from the area in which they have been provided with instructions and (optional) a task to manipulate an out-of-store variable, such as shopping motivation, back to the virtual store after he/she finishes the manipulation task.
- Seat the participant in front of the middle LCD screen and at a short distance from the middle screen (~60 cm). Adjust the chair until the participant's eye level matches the position of the screens.
- Provide the mouse, 3D space navigator and keyboard to the participant. Ensure that the front side of the 3D space navigator faces the participant to enable the correct navigation direction.
- Provide instructions on how to maneuver in the virtual store (see Supplement 1), shopping task instructions, and a shopping list for the main study (see Supplement 4).
- Instruct the participant to press "begin" to start visiting the store. Subsequently, leave the participant alone to shop without interruption.
- Check the data management program on another computer and ensure that the data is recording by checking the "Status data plugin" and the "Status event plugin"; these windows should show an increasing number of samples and events.
- Wait until the participant finishes shopping in the virtual store. Remind the participant to check the shopping cart (by pressing "F1") and to press "Esc" to complete the shopping task.
Note: It is very important to press "Esc" to mark the end of the shopping trip and to obtain a correct measurement of the shopping duration. - Press the "stop" button of the data management program on the other computer to stop recoding (the square button will change back to a circle ).
Note: Two small windows-"Please wait for receiving Event data to finish" and "Please wait for receiving external data to finish"-will pop up during the termination. These windows will close automatically after 2-3 s. - Ask the participant to move to another area and ask him/her to fill out a questionnaire measuring, for example, the participant's shopping experiences, perceptions about the store, and willingness to revisit the store.
- Return to the data management program and click on the "Visualize" button to check the recorded data; the graph and data of bought products should be shown, and examples of visualized data are shown in Figure 4.

Figure 4: The visualization window displayed in the data management program. The orange bar represents the entire shopping time, since the participant entered the store until he/she pressed "Esc" to indicate the end of the shopping trip. The green bar denotes the time spent on the examined products. These outputs can be converted into tables that are easy to use in combination with SPSS or other statistical programs. Please click here to view a larger version of this figure.
- Debrief and give a reward (e.g., a snack product or monetary payment) after the participant finishes.
- Reload a practice store for a new participant by following steps 5.2.3-5.2.4.
- Press F9 to close the virtual store after the last participant has finished.
- Save the data as frequently as possible to avoid data loss.
8. Export the Data
- Export the data of shopping-related behavior.
- Set up a filter to select the data of shopping-related behavior.
- Click "Data Profile" under the "Analyses" folder on the left menu column; the window will show the data components and the main diagram of the data profile filter.
- Select the "Nest over Behaviors" box under the "Select Intervals" heading; the box of Nested Behaviors will appear.
- Select all the behaviors of interest (e.g., shopping duration, products picked up, products bought, and products returned) and click "OK."
- Drag the "Nested Behaviors" box and drop it between the "Start" and "Results" boxes.
- Ensure that all boxes are connected with arrows (see Figure 5) and that the "Results" box shows the correct number of observations.
Note: If the boxes are not automatically connected, a researcher can connect them by clicking the mouse on one box, holding, and making a line to the next box.
- Click on "Behavior Analyses" under the "Analyses" folder and then click "New Behavior Analysis" to open the table of behavior-related results.
- Click on "Calculate" on the top left of the menu bar to extract the results. Ensure that the shopping behaviors per participant are shown in separate rows.
Note: A researcher can change the format of the presented results via a "Setting display." - Click the "Export" button to export the data. Name the exported file "Name.xlsx."
Note: This file will be saved in the "Export" folder of the data management program folder.
- Set up a filter to select the data of shopping-related behavior.

Figure 5: Data profile filter scheme for exporting shopping-related behavior. The data profile filter allows researchers to select and export the data of interest. For example, this scheme opts for shopping-related behaviors (e.g., shopping duration, number of products examined, number of product purchased, and number of products returned). Please click here to view a larger version of this figure.
- Export the movement-related data.
- Set up a filter to select the movement-related data.
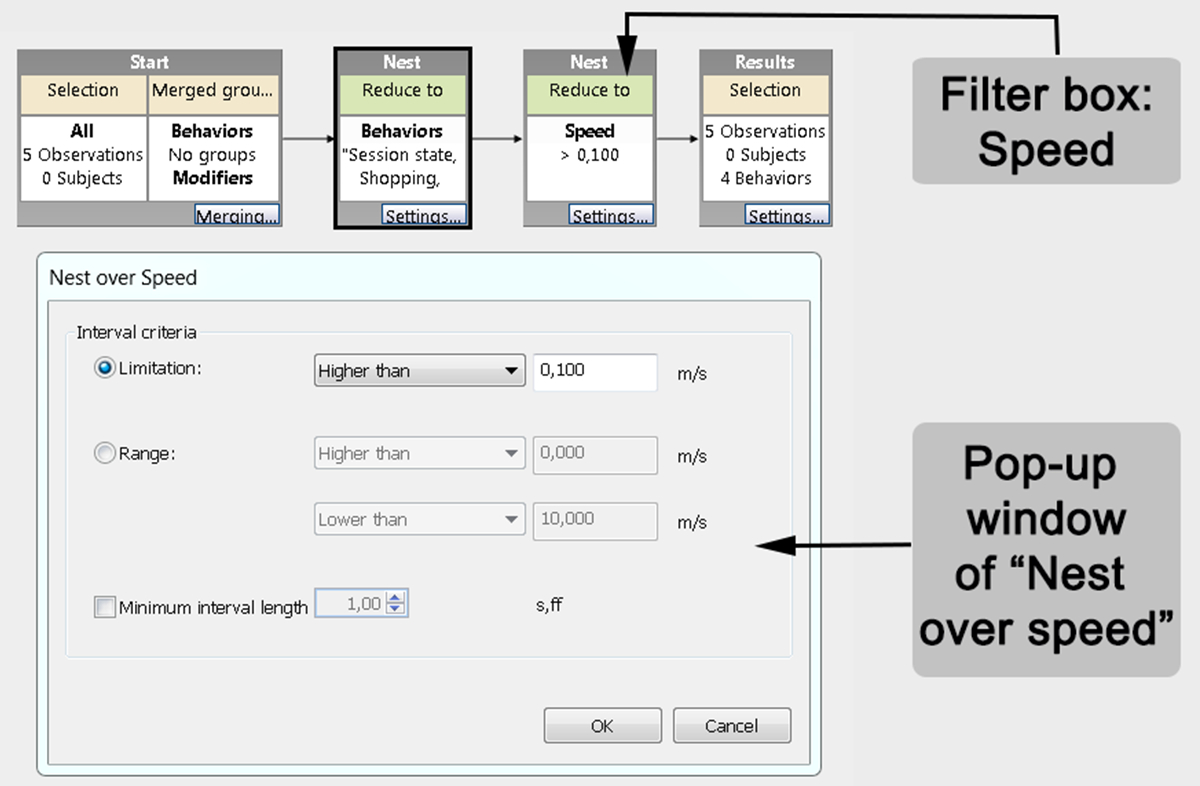
- Click "Data Profile" under the "Analyses" folder on the left menu column. Select the "Nest over Speed" box under the "Select Intervals with External Data" heading; the "Nested Speed" box will appear.
- Set the Interval criteria to "Limitation" → "Higher than" → "0.100 meter per second (m/sec)" and then click "OK."
Note: This filter will export only the data (e.g., walking speed and time) that occurs when the participant moves in the store. - Drag the "Nested Speed" box and drop it between the "Nested behaviors" and "Results" boxes.
- Ensure that all boxes are connected (i.e., "Start" box → "Nested behaviors" box → "Nested Speed" box → "Results" box (shown in Figure 6) and that the "Results" box shows the correct number of observations.
- Export the walking time.
- Click "Behavior Analyses" under the "Analyses" folder and then click "New Behavior Analysis" to open the table of behavior-related results.
- Click "Calculate" on the top left of the menu bar to extract the results. Ensure that the shopping behaviors per individual are shown in separate rows.
Note: The results should show a lower shopping duration compared to step 8.1.3 because the shopping duration in this part accounts for the time that a participant has walked in the store. These results exclude the time for product examination and for picking up products. - Click the "Export" button to export the data. Name the exported file, "Name.xlsx," with a name that differs from the first exported shopping-related data; this file will also be saved in the "Export" folder of the data management program folder.
- Export the walking speed.
- Click "Numerical Analyses" under the Analyses folder and then click "New Numerical Analysis" to open the table of movement-related results.
- Click "Calculate" on the top left of the menu bar to extract the results. Ensure that the movement-related results, such as speed per participant, are shown in separate rows.
- Click the "Export" button to export the data. Name the exported file "Name.xlsx;" this file will be saved in the "Export" folder of the data management program folder.
- Set up a filter to select the movement-related data.

Figure 6: Data profile filter scheme for exporting movement-related behavior. This scheme filters the movement-related behaviors (e.g., moving speed and moving time) that occur when participants move in the store (speed >0.100 m/s). The behaviors and times when participants stand still are filtered out. Please click here to view a larger version of this figure.
Results
The virtual store displayed using a PC with three 42-in LCD screens has been applied to examine the effects of supermarket layout on consumer shopping behavior (e.g., total shopping time, movement duration and speed, total number of products examined, and total number of products purchased) and perceived shopping experience. The virtual store enables the researcher to flexibly modify the attributes of store shelves (i.e., shelf length and shelf orientation) and to examin...
Discussion
The virtual store is one of the more advanced computer technologies that have been developed to create virtual environments in which people can experience and react to close-to-reality objects. Generally, the desktop virtual store consists of user-friendly interfaces that require a short time to understand. However, a number of critical points need to be accounted for. First, clear research objectives are needed beforehand to specify the starting points when building the virtual store. This includes a plan about the prod...
Disclosures
The authors have nothing to disclose.
Acknowledgements
The authors would like to acknowledge the Royal Thai government, the European Regional Development Fund, and the Dutch provinces Gelderland and Overijssel (Grant number 2011P017004) for financial support. The content of the paper reflects only the views of the authors. The authors also appreciate help from Andrea Poelstra of GreenDino and Tobias Heffelaar of Noldus Information Technology for their valuable input on technical topics.
Materials
| Name | Company | Catalog Number | Comments |
| Virtual Supermarket Software | GreenDino BV | http://www.greendino.nl/virtual-labs.html | This software consists of editor, product library and consumer interface. |
| Data Management Software: Observer XT | Noldus Information Technology | http://www.noldus.com/human-behavior-research/products/the-observer-xt | This software records observational data and facilitates the exportation of researcher-specified data sets using filters |
| 3D SpaceNavigator | 3Dconnexion | http://www.3dconnexion.eu/index.php?id=26&redirect2=www.3dconnexion.eu | A 3D SpaceNavigator allows participants to walk and make turns in the virtual store. In addition, it can be used by participants to adjust their eye-level during a shopping trip. |
| 3D moddeling software (e.g. Blender or 3DS Max) | Blender Foundation / Autodesk | https://www.blender.org/ http://www.autodesk.nl/products/3ds-max/overview | In case 3D models need to be made or adjusted 3D modeling software is needed. Many objects can be found online under different licencing agreements. |
| Contract Reseach | Wageningen Univeristy and Research | http://www.wur.nl/en/Expertise-Services/Research-Institutes/Economic-Research.htm | The socio-economic research institute (Wageningen Economic Research) with experience in conducting the consumer research with the virtual store. |
References
- Gorini, A., Griez, E., Petrova, A., Riva, G. Assessment of the emotional responses produced by exposure to real food, virtual food and photographs of food in patients affected by eating disorders. Ann Gen Psychiatry. 9 (1), 30-39 (2010).
- Sutherland, I. E. The ultimate display. Proceedings of the IFIP Congress. 65 (2), 506-508 (1965).
- Steuer, J. Defining virtual reality: Dimensions determining telepresence. J. Commun. 42 (4), 73-93 (1992).
- Witmer, B. G., Singer, M. J. Measuring presence in virtual environments: A presence questionnaire. Presence. 7 (3), 225-240 (1998).
- Baños, R. M., Botella, C., Garcia-Palacios, A., Villa, H., Perpiña, C., Alcañiz, M. Presence and Reality Judgment in Virtual Environments: A Unitary Construct. Cyberpsychol Behav. 3 (3), 327-335 (2004).
- Lessiter, J., Freeman, J., Keogh, E., Davidoff, J. A cross-media presence questionnaire: The ITC-Sense of Presence Inventory. Presence-Teleop Virt. 10 (3), 282-297 (2001).
- Witmer, B. G., Singer, M. J. Measuring presence in virtual environments: A presence questionnaire. Presence. 7 (3), 225-240 (1998).
- Slater, M. Place illusion and plausibility can lead to realistic behaviour in immersive virtual environments. Phil. Trans. R. Soc. B. 364 (1535), 3549-3557 (2009).
- Zygouris, S., et al. Can a virtual reality cognitive training application fulfill a dual role? Using the virtual supermarket cognitive training application as a screening tool for mild cognitive impairment. J. Alzheimers Dis. 44 (4), 1333-1347 (2015).
- Waterlander, W. E., Mhurchu, C. N., Steenhuis, I. H. M. Effects of a price increase on purchases of sugar sweetened beverages. Results from a randomized controlled trial. Appetite. 78, 32-39 (2014).
- Waterlander, W. E., Steenhuis, I. H., de Boer, M. R., Schuit, A. J., Seidell, J. C. The effects of a 25% discount on fruits and vegetables: Results of a randomized trial in a three-dimensional web-based supermarket. Int J Behav Nutr Phys Act. 9 (1), 11-22 (2012).
- Waterlander, W. E., et al. Study protocol: combining experimental methods, econometrics and simulation modelling to determine price elasticities for studying food taxes and subsidies (The Price ExaM Study). BMC Public Health. 16 (1), 601-614 (2016).
- Kim, A. E., et al. Influence of Point-of-Sale Tobacco Displays and Graphic Health Warning Signs on Adults: Evidence From a Virtual Store Experimental Study. Am J Public Health. 104 (5), 888-895 (2014).
- van Herpen, E., Immink, V., van Den Puttelaar, J. Organics unpacked: The influence of packaging on the choice for organic fruits and vegetables. Food Qual Prefer. 53, 90-96 (2016).
- Ducrot, P., et al. Impact of Different Front-of-Pack Nutrition Labels on Consumer Purchasing Intentions: A Randomized Controlled Trial: A Randomized Controlled Trial. Am J Prev Med. 50 (5), 627-636 (2015).
- van Herpen, E., Pieters, R., Zeelenberg, M. When demand accelerates demand: Trailing the bandwagon. J Consum Psychol. 19 (3), 302-312 (2009).
- Berneburg, A. Interactive 3D simulations in measuring consumer preferences: Friend or foe to test results. J. interact. advert. 8 (1), 1-13 (2007).
- van Herpen, E., van den Broek, E., van Trijp, H. C., Yu, T. Can a virtual supermarket bring realism into the lab? Comparing shopping behavior using virtual and pictorial store representations to behavior in a physical store. Appetite. 107, 196-207 (2016).
- Khan, V. -. J., Nuijten, K. C., Deslé, N. Pervasive Application Evaluation within Virtual Environments. Proc. PECCS. , 261-264 (2011).
- Rebelo, F., Duarte, E., Noriega, P., Soares, M. M., Karwowski, W., Soares, M. M., Stanton, N. A. Virtual reality in consumer product design: Methods and applications. Human factors and ergonomics in consumer product design. , 381-402 (2011).
- Ruppert, B. New directions in the use of virtual reality for food shopping: Marketing and education perspectives. J Diabetes Sci Technol. 5 (2), 315-318 (2011).
- Waterlander, W., Mhurchu, C. N., Steenhuis, I., Xinxing, T. The use of virtual reality in studying complex interventions in our every-day food environment. Virtual reality-Human computer interaction. , 231-260 (2012).
- Waterlander, W. E., Jiang, Y., Steenhuis, I. H. M., Mhurchu, C. N. Using a 3D virtual supermarket to measure food purchase behavior: A validation study. J Med Internet Res. 17 (4), (2015).
- Mikkelsen, B., Høeg, E., Mangano, L., Serafin, S. The Virtual Foodscape Simulator-gaming, designing and measuring food behaviour in created food realities. Proc Meas Behav 2016. , (2016).
Reprints and Permissions
Request permission to reuse the text or figures of this JoVE article
Request PermissionThis article has been published
Video Coming Soon
Copyright © 2025 MyJoVE Corporation. All rights reserved