Method Article
Dissection of Local Ca2+ Signals in Cultured Cells by Membrane-targeted Ca2+ Indicators
In This Article
Summary
Here we present a protocol for Ca2+ imaging in neurons and glial cells, which enables the dissection of Ca2+ signals at subcellular resolution. This process is applicable to all cell types that allow the expression of genetically encoded Ca2+ indicators.
Abstract
Calcium ion (Ca2+) is a universal intracellular messenger molecule that drives multiple signaling pathways, leading to diverse biological outputs. The coordination of two Ca2+ signal sources—“Ca2+ influx” from outside the cell and “Ca2+ release” from the intracellular Ca2+ store endoplasmic reticulum (ER)—is considered to underlie the diverse spatio-temporal patterns of Ca2+ signals that cause multiple biological functions in cells. The purpose of this protocol is to describe a new Ca2+ imaging method that enables monitoring of the very moment of “Ca2+ influx” and “Ca2+ release”. OER-GCaMP6f is a genetically encoded Ca2+ indicator (GECI) comprising GCaMP6f, which is targeted to the ER outer membrane. OER-GCaMP6f can monitor Ca2+ release at a higher temporal resolution than conventional GCaMP6f. Combined with plasma membrane-targeted GECIs, the spatio-temporal Ca2+ signal pattern can be described at a subcellular resolution. The subcellular-targeted Ca2+ indicators described here are, in principle, available for all cell types, even for the in vivo imaging of Caenorhabditis elegans neurons. In this protocol, we introduce Ca2+ imaging in cells from cell lines, neurons, and glial cells in dissociated primary cultures, and describe the preparation of frozen stock of rat cortical neurons.
Introduction
Ca2+ signals represent the elevation of the intracellular Ca2+ concentration. Ca2+ is the universal second messenger for eukaryotic cells. Using Ca2+, cells function via diverse intracellular signaling pathways and induce various biological outputs. For example, in neurons, synaptic vesicle release at the presynaptic terminal, gene expression in the nucleus, and induction of synaptic plasticity at the postsynapse are regulated by distinct Ca2+ signals that precisely activate the appropriate downstream enzymes at the right sites and with precise timing1.
Specific spatiotemporal patterns of Ca2+ signals activate the specific downstream enzymes. Ca2+ signals are generated by the coordination between two different Ca2+ sources: Ca2+ influx from the extracellular space and Ca2+ release from the endoplasmic reticulum (ER), which serves as an intracellular Ca2+ store. The meaningful spatiotemporal Ca2+ signaling pattern to induce a specific cell function is also supported by nanodomains of 10–100 µM Ca2+ generated in the vicinity of Ca2+ channels on the plasma membrane or ER membrane2. Importantly, the source of Ca2+ signals is one of the most critical factors determining the downstream biological output. In neurons, Ca2+ influx and Ca2+ release have opposite effects on the clustering of gamma-aminobutyric acid (GABA)A receptors (GABAAR) at the GABAergic synapses, which is responsible for the inhibition of neuronal excitability3. Ca2+ influx accompanied by massive neuronal excitation induces the dispersion of synaptic GABAAR clusters, whereas persistent Ca2+ release from the ER promotes the clustering of synaptic GABAARs. Other groups have also reported that the tuning direction of growth cones is critically dependent on the source of the Ca2+ signal: Ca2+ influx induces repulsion, while Ca2+ release guides the attraction of the neuronal growth cone4. Therefore, to fully understand the Ca2+ signaling pathways underlying specific cellular outputs, it is important to identify the source of Ca2+ signals by describing Ca2+ signals at the subcellular resolution.
In this protocol, we describe a Ca2+ imaging method to report Ca2+ signals at the subcellular resolution, which allows the estimation of the Ca2+ signal sources (Figure 1). Ca2+ microdomains just beneath the plasma membrane are successfully monitored by genetically encoded Ca2+ indicators (GECIs) targeted to the plasma membrane via the attachment of the plasma membrane-localization signal Lck within Src kinase to the N-termini of GECIs5. To detect the Ca2+ signal pattern in the vicinity of the ER at a better spatial and temporal resolution, we recently developed OER-GCaMP6f, in which GCaMP6f6 targets the ER outer membrane, using the ER transmembrane protein. OER-GCaMP6f can sensitively report Ca2+ release from the ER at a better spatiotemporal resolution than conventional nontargeted GCaMP6f in COS-7 cells7 and HEK293 cells8, by avoiding the diffusion of Ca2+ and GECIs. We also confirmed that the spontaneous Ca2+ elevation in cultured hippocampal astrocytes reported by OER-GCaMP6f showed a different spatiotemporal pattern compared to that monitored by plasma membrane-targeted GCaMP6f (Lck-GCaMP6f)7,9, indicating that Ca2+ imaging with OER-GCaMP6f in combination with Lck-GCaMP6f contributes to the dissection of Ca2+ signals at the subcellular resolution to identify their sources.
Presently, we detail the protocol for the Ca2+ signal dissection in HeLa cells and neuron-astrocyte mixed cultures plated on glass coverslips. The Ca2+ imaging technique with GECIs indicated here, Lck-GCaMP6f, plasma-membrane-targeted RCaMP210 (Lck-RCaMP2), and OER-GCaMP6f (Figure 1) are applicable to all cells in which these GECIs can be expressed.
Protocol
All the experiments described here were approved by the RIKEN safety committee and animal experiment committee, according to the guideline issued by the Japanese Ministry of Education, Culture, Sports, Science, and Technology.
1. Preparation of Cells
- Preparation of poly(ethyleneimine)-coated coverslips
NOTE: Poly(ethyleneimine) (PEI) coating is recommended for the glass apparatus, as it allows neurons and astrocytes to attach tightly to the coverslips without preventing their development. However, other coating methods (e.g., poly-ornithine, poly L-lysine, laminin coating) are also available, if necessary, for glass-bottom dishes.- Place an 18 mm-diameter glass coverslip in each well of a 12-well plate. Prepare 0.04% PEI solution (12.5 mL/12-well plate) using sterilized water.
- Add 1 mL of 0.04% PEI solution to each well. Ensure that there are no bubbles underneath the coverslips.
- Incubate the plates in a CO2 incubator overnight at 37 °C.
- The next day, wash the coated coverslips 3x with 1 mL of sterilized water. Remove the PEI solution with an aspirator, add 1 mL of sterilized water to each well, and shake the 12-well plate so that the PEI solution between the coverslip and the plate can be washed out thoroughly. As the remaining PEI is toxic for cells, ensure that the water after the final wash is aspirated completely.
- Dry and sterilize the coverslips inside the hood with ultraviolet (UV) light for at least 15 min. The PEI-coated dish can be stored at 4 °C for up to 2 months. Illuminate the dishes with UV light for 15 min just before use.
- Add 5 mL of sterile distilled water in the space between the wells to prevent evaporation of the culture medium.
- Plating cell lines
NOTE: This protocol provides just one example for transfection into cells from mammalian cell lines, such as HeLa cells and COS-7 cells. Users can apply other transfection protocols that are optimized for their experiments. In this section, we will describe the HeLa cell culture protocol, which is also applicable to COS-7 cells.- On the day before the transfection, culture the cells in a 10 cm culture dish until they attain 70%–90% confluence.
- Prewarm the culture medium (see Table of Materials) to 37 °C.
- Wash the cells 2x with phosphate-buffered saline without Ca2+ and Mg2+ (PBS [-]).
- Aspirate the PBS(-), add 1 mL of 0.5% trypsin-ethylenediaminetetraacetic acid (EDTA) solution, and incubate the cells at 37 °C for 90 s until they attain a round shape.
- Add 9 mL of prewarmed culture medium to stop the trypsinization. Dilute the cells with culture medium at a ratio of 1:6.
- Seed 1 mL of the diluted cells on PEI-coated coverslips in the 12-well plates.
- Preparation of hippocampal neuron-astrocyte mixed culture from rats or mice
NOTE: Sections 1.3 and 1.4 must first be reviewed and approved by an Institutional Animal Care and Use Committee and must follow officially approved procedures for the care and use of laboratory animals. The flowchart of the neuronal culture protocol is shown in Figure 2.- Prepare all reagents under the laminar flow hood. Place Dulbecco’s modified Eagle’s medium (DMEM) into two 100 mm culture dishes (approximately 20 mL/dish) that are in an icebox.
- Prepare 50 mL of the dissection medium composed of DMEM and 20 mM 4-(2-hydroxyethyl)-1-piperazineethanesulfonic acid (HEPES) (see Table of Materials) and dispense the medium into three 60 mm culture dishes (approximately 7 mL/dish) and eight 35 mm culture dishes (approximately 2 mL/dish). Place the dishes in another icebox.
- Prepare 50 mL of the incubation saline, composed of Hanks’ balanced salt solution supplemented with 20 mM HEPES (see Table of Materials), and place 8 mL of the saline in a 15 mL conical tube on ice.
- Prepare the plating medium with minimum essential medium (MEM) supplemented with B-27, glutamine, and penicillin-streptomycin (see Table of Materials). Maintain this medium at room temperature (20–28 °C).
- Sterilize the surgical instruments with 70% ethanol.
- Place a paper towel in a glass jar with a lid and 1 mL of isoflurane. Let the isoflurane evaporate for 1 min.
- Place a pregnant rat or a mouse in the jar prepared according to step 1.3.6 and keep the animal in the jar until it is deeply anesthetized (approximately 30 s to 1 min).
- Take the anesthetized animal out of the jar and disinfect the animal and the dissection equipment by spraying them with 70% ethanol. Cut the ventral midline with standard dissecting scissors and tweezers and extract the uterus from the pregnant rat or mouse.
- Extract E18–19 embryos from the uterus of an anesthetized female rat or mouse, using delicate dissecting scissors, and place the extracted embryos with a ring forceps into ice-cold DMEM in a 10 cm dish for cold anesthesia.
- Decapitate the embryo with fine dissection scissors and place the head in ice-cold DMEM in a 10 cm dish.
- Extract the brain from each embryo with a 13 cm curved Semken forceps and forceps with fine tips. Keep the brain in the ice-cold dissection medium in a 60 mm dish.
- Remove the hippocampi, using two forceps with fine tips, in the ice-cold dissection medium in 35 mm dishes and maintain the isolated tissue in the incubation saline placed in a 15 mL conical tube on ice.
- Wash the hippocampi with incubation saline and incubate with trypsin (1.25 mg/mL) and DNase I (0.25 mg/mL) in the incubation saline for 5 min at 37 °C. The recommended incubation volume is 2.7 mL of the incubation saline, 150 µL of 20x stock trypsin, and 150 µL of 20x stock DNase (see Table of Materials).
- Wash the hippocampi 3x with ice-cold incubation saline.
- Aspirate the incubation saline and add 1 mL of the plating medium containing DNase I (10 µL of stock solution; see Table of Materials). Suspend the tissue by pipetting no more than 20x and measure the density of viable cells, using a cell counter and Trypan blue assay.
- Dilute the hippocampal cells to a density of 1.4 x 10⁵ viable cells/mL for rats and 2.5 x 10⁵ viable cells/mL for mice. Seed 1 mL of the diluted cell suspensions onto the PEI-coated coverslips in 12-well culture plates.
- Maintain the cells at 37 °C in a CO2 incubator for 2–3 days.
- Remove the plating medium. Do not let the cells dry out. Gently and quickly add the prewarmed maintenance medium (see Table of Materials).
- Preparation of rat cortical neuron-astrocyte mixed culture and frozen cells, and the revival of frozen cultures
NOTE: A cryopreservation method for cortical cells was described previously11. Here, a modified protocol in which cortical cells can be stored at -80 °C for at least 3 months is provided. The flowchart for this protocol is shown in Figure 2.- Prepare DMEM, dissection medium, incubation saline, and plating medium as indicated in steps 1.3.1–1.3.4, and the Table of Materials.
- Prepare the wash medium constituted of DMEM, heat-inactivated fetal bovine serum, and penicillin-streptomycin (see Table of Materials), if necessary.
- Extract E18–19 embryos from the uterus of an anesthetized female rat or mouse, using delicate dissection scissors, and use ring forceps to place each extracted embryo into ice-cold DMEM for cold anesthesia.
- Remove the brains from the embryos and keep them in ice-cold dissection medium. Remove the cortexes and maintain them in the incubation saline placed in a 15 mL conical tube on ice.
- Wash the cortexes with incubation saline and incubate the cortexes with trypsin (1.25 mg/mL) and DNase I (0.25 mg/mL) in incubation saline for 5 min at 37 °C. The recommended incubation volume for 12 cortexes is 5.4 mL of incubation saline, 300 µL of 20x stock trypsin, and 300 µL of 20x stock DNase I.
- Wash the cortexes 3x with ice-cold incubation saline.
- Remove the supernatant and add 2 mL of plating medium supplemented with 150 µL of DNase I stock. Dissociate the cells by pipetting less than 20 strokes, and filter the cells using a cell strainer with a pore size of 70 µm.
- Wash the cell strainer with 20 mL of the plating medium for plating. For the preparation of frozen cell stock, wash the cells with 20 mL of the wash medium (see Table of Materials)
- Measure the density of the viable cells, using a cell counter and the Trypan blue method.
- Dilute the cortical cells to a density of 1.4 x 10⁵ viable cells/mL with the plating medium and add 1 mL of the diluted cell suspension to PEI-coated coverslips in the 12-well culture plates.
- Maintain the cells at 37 °C in a CO2 incubator for 2–3 days and change the culture medium to the maintenance medium.
- After step 1.4.9, prepare the frozen cortical cell stock by centrifuging the cells at 187 x g for 3 min, using a swing rotor.
- Aspirate the supernatant and add the cryopreservation medium (see Table of Materials) kept at 4 °C, to obtain a cell density of 1 x 10⁷ cells/mL. Aliquot 1 mL of the cell suspension into cryogenic tubes.
- Place the tubes in a cell freezing container with a freezing rate of -1 °C/min, until a temperature of -80 °C is reached, and transfer the freezing container to a -80 °C freezer. The cells can be stored for at least 3 months at -80 °C.
- To revive frozen cells, prewarm the wash medium (approximately 13 mL for each cryogenic tube) and maintenance medium for frozen cortical cells (see Table of Materials).
- Thaw the frozen cells rapidly at 37 °C in a water bath.
- Dilute the thawed cells gently with prewarmed wash medium. Centrifuge the cells at 187 x g for 3 min, using a swing rotor.
- Suspend the pellet in 1 mL of wash medium and measure the viable cell density.
- Dilute the cells with the maintenance medium for frozen cortical cells to yield a cell density of 3.0 x 10⁵ viable cells/mL, and seed 1 mL of the cell suspension in the PEI-coated 12-well plates.
2. Expression of Membrane-targeted GECIs
- Transfection of cells
- Add 250 ng of the GECI plasmid (i.e., Lck-GCaMP6f, Lck-RCaMP2, or OER-GCaMP6f with CMV promoter)7,8,9 to 100 µL of the reduced serum medium (see Table of Materials) per well. For the cotransfection of Lck-RCaMP2 and OER-GCaMP6f, use 250 ng of each plasmid in 100 µL of reduced serum medium in each well.
- Add 0.5 µL of transfection reagent (see Table of Materials) per well into the plasmid-reduced serum medium mixture. For the cotransfection of Lck-RCaMP2 and OER-GCaMP6f, add 0.5 µL of transfection reagent per well.
- Incubate the mixture for 30 min at room temperature (20–28 °C).
- Add 100 µL of the mixture to each coverslip in a drop-wise manner.
- Incubate the cells for 48–72 h in a CO2 incubator at 37 °C to allow the expression of the GECIs.
- Transfection and adeno-associated virus infection of hippocampal or cortical neurons
NOTE: Transfection for 3–5 days in vitro (DIV) results in a higher transfection rate for neurons. Transfection at 6–8 DIV is preferred for the optimal expression of GECIs in astrocytes. For the expression of GECIs in dissociated culture neurons after 9 DIV, the infection of the adeno-associated virus (AAV) vectors provides a better expression efficacy. AAV vectors for the expression of Lck-GCaMP6f, Lck-RCaMP2, and OER-GCaMP6f under the EF1a promoters were prepared as described previously, using HEK293 cells12 (see Table of Materials).- For transfection 3–8 days after plating, label two tubes, one for plasmid DNA and the other for transfection reagent.
- Add 50 µL of reduced serum medium (see Table of Materials) per well to each tube.
- Add 0.5 µg of plasmid DNA per coverslip and 1 µL of supplement accompanied by transfection reagent for neurons (see Table of Materials) per well to the plasmid DNA tube. For the cotransfection of Lck-RCaMP2 and OER-GCaMP6f, 0.5 µg of each plasmid and 1 µL of supplement are mixed in 50 µL of reduced serum medium per well.
- Add 1 µL of transfection reagent (see Table of Materials) per well in the transfection reagent tube. The same amount of transfection reagent is used for cotransfection.
- Vortex both tubes for 1–2 s.
- Add the transfection reagent mixture (from step 2.2.4) to the DNA mixture (from step 2.2.3). Mix by pipetting gently and incubate the mixture (100 µL per coverslip) for 5 min at room temperature.
- Load this mixture onto the cells in a drop-wise manner.
- Incubate the cells in a CO2 incubator for 2–3 days until the marker proteins are expressed.
- For AAV infection, add 3 µL of AAV per well to the mixed neuron-astrocyte culture. Mix gently by rocking the dish. For the double infection of Lck-RCaMP2 and OER-GCaMP6f, 3 µL of each AAV is introduced per well. In case the numbers of cells expressing GECIs are insufficient, the optimal AAV amount for infection should be determined.
- Maintain the culture for 1–2 weeks until the GECIs are expressed.
3. Ca2+ Imaging
- Simultaneous imaging of cells expressing Lck-RCaMP2 and OER-GCaMP6f
NOTE: To simultaneously record the Lck-RCaMP2 and OER-GCaMP6f signals, image-splitting optics are required. The optics enable the separation of RCaMP2 and GCaMP6f and their projection onto the same photographic frame of the camera (Figure 3A). Simultaneous imaging also requires (1) light sources that can simultaneously emit excitation light in the blue (450–490 nm) and green (500–560 nm) spectra, (2) double-band filter and dichroic mirror sets in the microscope, and (3) emission filters for RCaMP2 and GCaMP6f. For details, refer to the Table of Materials.- Turn on the imaging devices and computers at least 30 min before the recording. Prewarm the microscope heating chamber to 37 °C. Set up the image-splitting device, filters, and light source. Align the image-splitting optics so that the same field of view appears on the camera. Choose the appropriate objective lens (see Table of Materials).
- Mount the coverslip containing the cells transfected with Lck-RCaMP2 and OER-GCaMP6f in the recording chamber, add the appropriate imaging medium or buffer (400 µL for 18 mm coverslips) in the chamber, and place it on the microscope stage. Place a lid on the recording chamber to avoid the evaporation of the medium.
- Locate the cells expressing both Lck-RCaMP2 and OER-GCaMP6f by fluorescent imaging. Minimize the excitation light intensity to prevent photobleaching and phototoxicity.
- Remove the lid and start a time-lapse recording at 10 Hz. During this recording, add the agonist to the chamber to evoke Ca2+ responses (e.g., histamine for HeLa cells, ATP for COS-7 cells).
- Save the time-lapse data in the hard disk drive (HDD).
- Analyze the data using image analysis software.
- Recording spontaneous activities of astrocytes expressing Lck-RCaMP2 and OER-GCaMP6f
NOTE: Without image-splitting optics, the Ca2+ signals at the plasma membrane and those around the ER can be monitored in the same cell. Here, the sequential recording of Lck-RCaMP2 and OER-GCaMP6f in the same astrocytes is described. An oil-immersion objective with a numerical aperture larger than 1.3 is highly recommended for spontaneous Ca2+ activity.- Turn on the microscope, camera, light source, and the microscope heating chamber at least 30 min before recording.
- Mount the coverslip containing the cells transfected with Lck-RCaMP2 and OER-GCaMP6f in the recording chamber and add 400 µL of the imaging medium. Place a lid on top of the chamber.
- Choose the filter set for GCaMP6f and the light source (blue excitation light, e.g. 470– 490 nm; see Table of Materials). Locate the astrocytes expressing OER-GCaMP6f.
- Choose a filter set and the light source for RCaMP2 (green excitation light, e.g., 510–560 nm; see Table of Materials) and confirm whether Lck-RCaMP2 is expressed in the same astrocytes. Avoid long exposure to the light source to prevent photobleaching.
- Record time-lapse images of Lck-RCaMP2 at 2 Hz for 2 min. Save the imaging data on the HDD.
- Change the filter set to that for GCaMP6f. Record time-lapse images of OER-GCaMP6f in the same field of view, at 2 Hz for 2 min. Save the data on the HDD.
- Analyze the data using the image analysis software.
- Recording spontaneous neuronal activity and induced Ca2+ elevation in neurons
NOTE: The microscope setup for neuronal imaging is the same as that described in section 3.2. Here, the imaging of spontaneous Ca2+ elevation due to Lck-GCaMP6f and Ca2+ elevation induced by mGluR activation due to OER-GCaMP6f is described.- To record spontaneous neuronal activity, mount the coverslip containing the cells expressing Lck-GCaMP6f in the recording chamber and add 400 µL of imaging medium. Place a lid on top of the chamber.
- Set the filter and the light source (blue excitation, e.g. 470–790 nm; see Table of Materials) to those for GCaMP6f. Find the neurons expressing Lck-GCaMP6f and showing spontaneous activity.
- Acquire images at 2 Hz or faster. Save the data on the HDD.
- Analyze the data using the image analysis software.
- To record induced Ca2+ elevation, mount the coverslips containing the cells expressing OER-GCaMP6f with 400 µL imaging medium. Place a lid on top of the chamber.
- Using the filter set for GCaMP6f, find the neurons expressing OER-GCaMP6f.
- Remove the lid. Start the time-lapse recording at 2 Hz or faster. During the recording, add the agonists for a Gq-protein-coupled receptor (e.g., mGluR5 agonist [RS]-3,5-dihydroxyphenylglycine [DHPG]) to evoke a Ca2+ release from the ER.
- Save the time-lapse images on the HDD and analyze the data.
Results
Lck-RCaMP2 and OER-GCaMP6f were expressed in HeLa cells, and both signals were recorded simultaneously using image-splitting optics, 24 h after transfection (Figure 3A and Video 1). The images were acquired at 10 Hz. Histamine (His, 1 µM), which induces Ca2+ release from the ER, was added during the recording. Upon the application of His, the signal intensity of Lck-RCaMP2 and OER-GCaMP6f increased, as shown by the pseudocolor display of ΔF/F0, which represents the change from the initial fluorescence intensity (Figure 3B). The time courses of Ca2+ elevation (ΔF/F0) reported by Lck-RCaMP2 and OER-GCaMP6f were compared in the same region of interest (ROI) (Figure 3C). The ΔF/F0 values were normalized to their peak values to enable the time course comparison between the two different GECIs, which have different expression levels and distributions. Both sensors reported an oscillation-like Ca2+ elevation. Lck-RCaMP2 and OER-GCaMP6f showed the same time course for Ca2+ elevation in two cells among the five cell types examined (Figure 3C, ROI 1 and 3). However, Ca2+ elevations shown by Lck-RCaMP2 remained at a higher level compared to that shown by OER-GCaMP6f (Figure 3C, ROI 2, 4, and 5). The results indicate that the Ca2+ elevation is prolonged in the vicinity of the plasma membrane, while it is terminated earlier around the ER, which is the source of this Ca2+ signal induced by His stimulation.
Spontaneous Ca2+ signals from astrocytes in the neuron-astrocyte mixed culture from rat hippocampi (Figure 4A) and cortexes (Figure 4B) were shown by Lck-RCaMP2 and OER-GCaMP6f (Figure 4, Video 2, Video 3, Video 4, and Video 5). Cortical cultures were revived from the frozen stock that was prepared as described in this protocol. Lck-RCaMP2 and OER-GCaMP6f signals were sequentially recorded at 2 Hz from the same cells. Three ROIs were selected in the area that showed Ca2+ elevation by each GECI, and the time course of ΔF/Fbase (i.e., the fluorescence intensity) changed from the average fluorescence intensity during the entire recording period (Fbase). When the baseline fluorescence is stable and Ca2+ elevations are less frequent, Fbase becomes a useful baseline to detect Ca2+ elevation events. Spontaneous Ca2+ elevations were visible only at the astrocytic process, not at the cell body. This result is consistent with the previous reports on astrocytic spontaneous Ca2+ signals by other GECIs visualized in vitro13 and in vivo14. In both hippocampal and cortical astrocytes, Ca2+ elevations shown by Lck-RCaMP2 (top) were more frequent than those shown by OER-GCaMP6f. This result is consistent with our previous demonstration that Ca2+ elevations in astrocytes due to Lck-GCaMP6f were more frequently detected than those due to OER-GCaMP6f7 and suggests that this notion is also applicable at the single-cell level.
Spontaneous Ca2+ elevations by Lck-GCaMP6f in immature rat hippocampal neurons (10 DIV) were seen at 2 Hz (Figure 5A and Video 6). The time courses of ΔF/F0 in five different ROIs suggest that these Ca2+ elevations are locally confined to the subcellular domains. Figure 5B (Video 7) shows the Ca2+ responses in mature mouse hippocampal neurons (30 DIV) infected with OER-GCaMP6f-expression AAV vectors. Neurons were stimulated with 100 µM DHPG, which is the agonist for metabotropic glutamate receptors, inducing Ca2+ release. DHPG-induced Ca2+ release due to OER-GCaMP6f was detected.
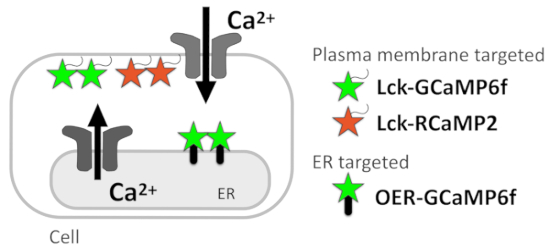
Figure 1: Diagram showing membrane-targeted GECIs. Schematic diagram of plasma membrane-targeted GECIs (Lck-GCaMP6f and Lck-RCaMP2) and outer ER membrane-targeted GCaMP6f (OER-GCaMP6f).
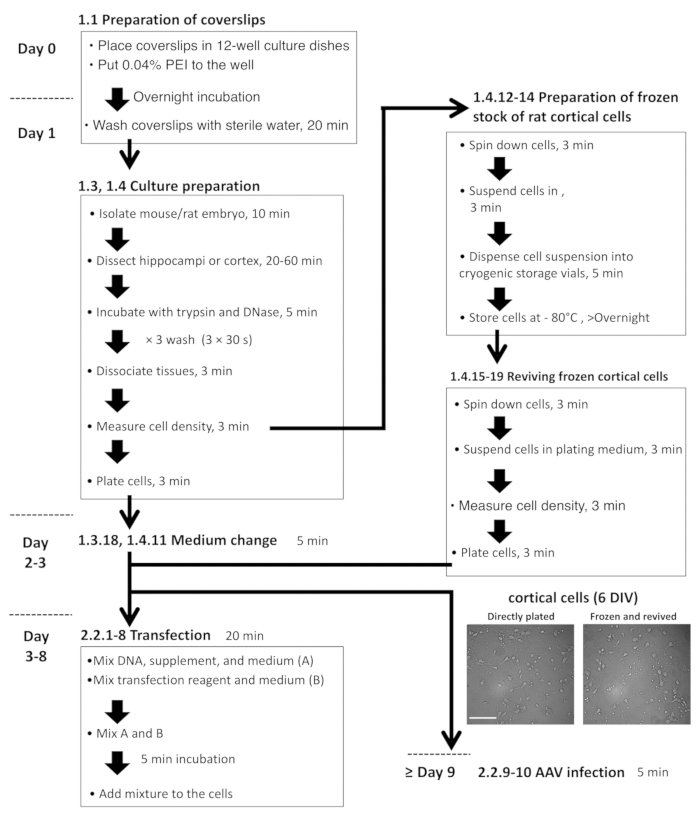
Figure 2: Flowchart for hippocampal and cortical cell preparation, plasmid transfection, and AAV infection. The microscopic images are representative, freshly plated DIV-6 cortical cells (left) and revived cells from the frozen stock (right). Scale bar = 100 µm. Please click here to view a larger version of this figure.
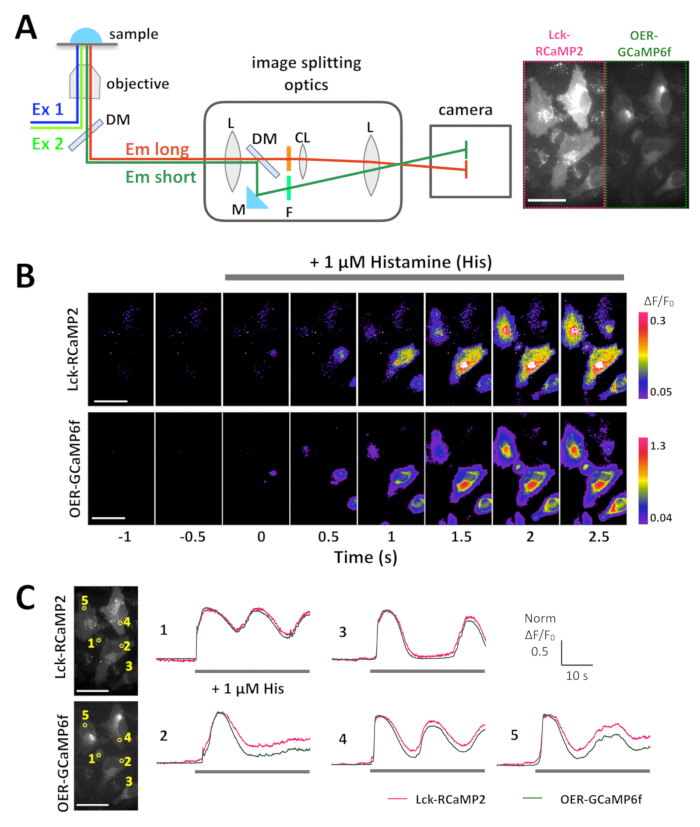
Figure 3: Example of the simultaneous imaging of Lck-RCaMP2 and OER-GCaMP6f in HeLa cells. (A) Schematic representation of signal separation with image-splitting optics. The same field of view for Lck-RCaMP2 and OER-GCaMP6f is simultaneously projected on the camera. A representative recording acquired at 10 Hz by a CMOS camera is provided in Video 1, and one frame of this recording is shown in panel A (right). (B) Pseudo-color images of ΔF/F0 for Lck-GCaMP2 (top) and OER-GCaMP6f (bottom). Histamine (His, 1 µM) was added at 0 s. (C) Representative normalized ΔF/F0 time course of Lck-GCaMP2 (magenta) and OER-GCaMP6f (green). Data were normalized to the maximum ΔF/F0 value for each plot. The gray bars indicate the timing of His application. Data were analyzed with a custom-made software TI Workbench15. Scale bar = 50 µm (microscopic image). Please click here to view a larger version of this figure.
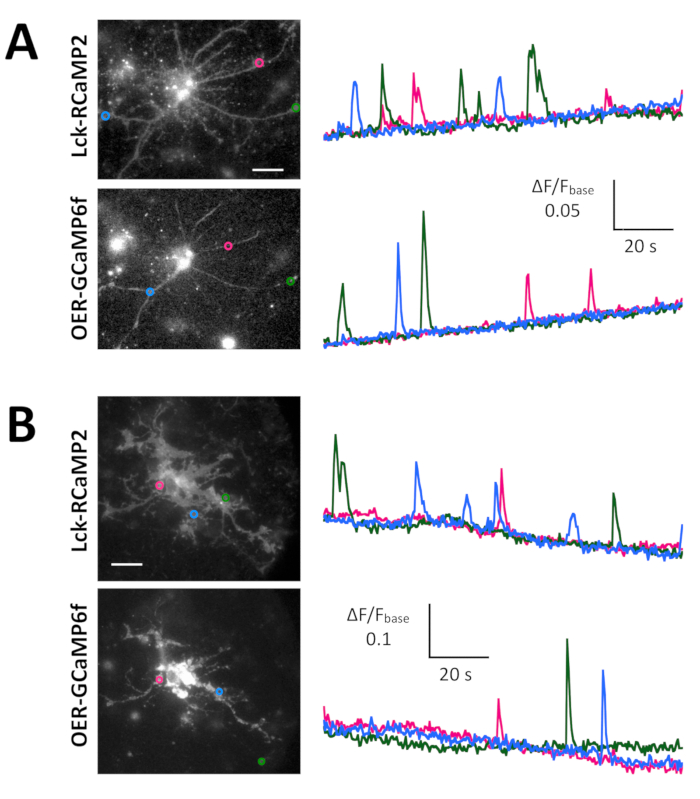
Figure 4: Spontaneous Ca2+ elevation in astrocytes monitored for Lck-RCaMP2 and OER-GCaMP6f expression. (A) Representative hippocampal and (B) cortical astrocytes transfected with Lck-RCaMP2 (top) and OER-GCaMP6f (bottom). Cortical cells were revived from frozen stock cultures. Lck-RCaMP2 and OER-GCaMP6f images were sequentially acquired in the same cell, at 2 Hz, with an EM-CCD camera. The plots on the left show the time courses of ΔF/Fbase measured in the ROIs indicated in the microscopic image. Data were analyzed with TI Workbench. Actual movies are provided in Video 2, Video 3, Video 4, and Video 5. The scale bar = 20 µm (microscopic image). The baseline drift suggests the changes in the global Ca2+ level in the cell. Please click here to view a larger version of this figure.
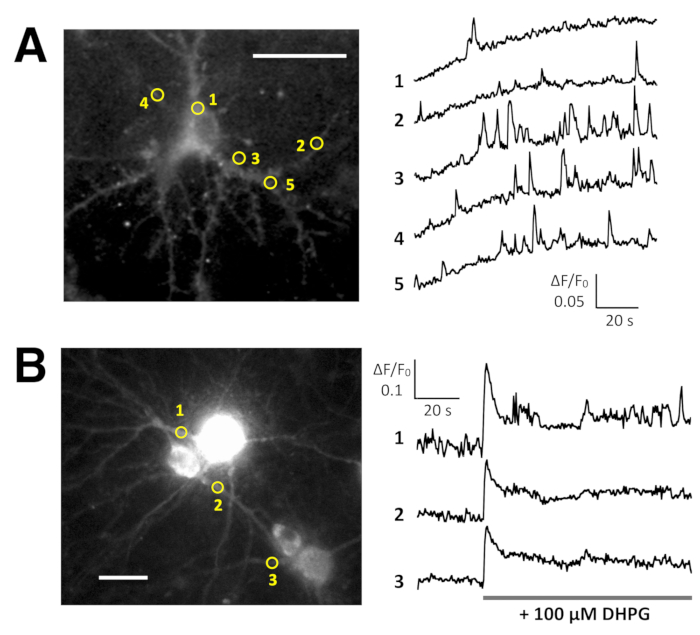
Figure 5: Examples of Ca2+ imaging in neurons with Lck-GCaMP6f and OER-GCaMP6f. (A) Representative rat hippocampal neurons expressing Lck-GCaMP6f at DIV 10 (left) and plots showing the time courses of ΔF/F0 measured in the ROIs (yellow circles) have been indicated in the image (right). The numbers in the time course correspond to the ROI numbers in the image. Note that the temporal pattern of Ca2+ elevation is different among the various regions of interest. The baseline drift suggests the increase in the global Ca2+ level in this neuron. (B) An example of mature mouse hippocampal neurons (DIV 30) infected with OER-GCaMP6f expression AAV vectors (left). The time course plot of ΔF/F0 measured shows the Ca2+ response to 100 µM (RS)-3,5-dihydroxyphenylglycine (DHPG) applied at the timing shown by the gray bar. Yellow circles show the position of ROIs where the time course was obtained. The images were acquired at 2 Hz with a cooled-CCD camera (panel A) or an EM-CCD camera (panel B) and analyzed with TI Workbench. Scale bar = 20 µm (microscopic image). Please click here to view a larger version of this figure.
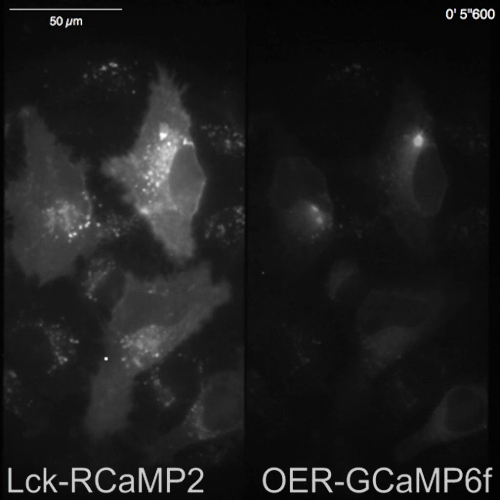
Video 1: Example of simultaneous imaging of Lck-RCaMP2 and OER-GCaMP6f in HeLa cells. Representative recording acquired at 10 Hz and presented in Figure 3. Scale bar = 50 µm. Please click here to download this video.
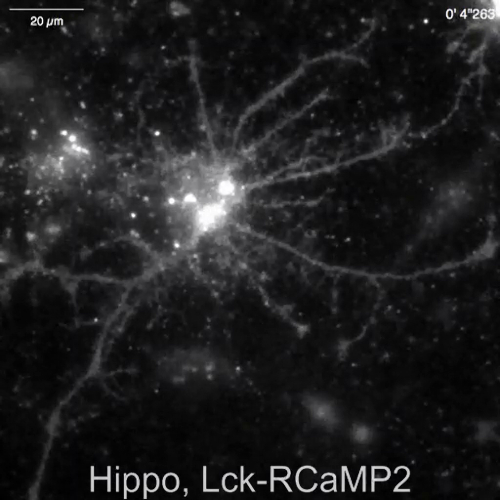
Video 2: Spontaneous Ca2+ transient observed in Lck-RCaMP2 in hippocampal astrocyte. Representative recording acquired at 2 Hz (Figure 4A), recorded in the same field of view as Video 3. Scale bar = 20 µm. Please click here to download this video.
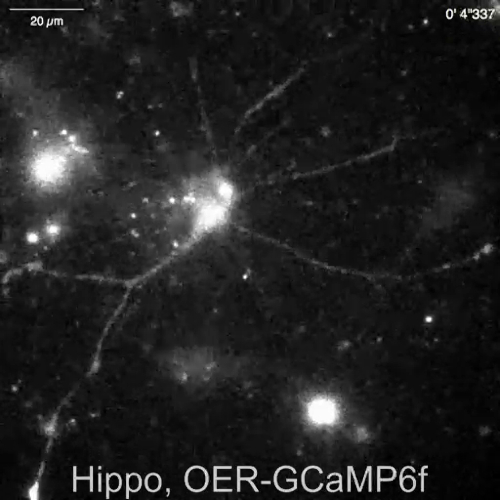
Video 3: Spontaneous Ca2+ transient observed in OER-GCaMP6f in a hippocampal astrocyte. Representative recording acquired at 2 Hz (Figure 4A), in the same field of view as Video 2. Scale bar = 20 µm. Please click here to download this video.
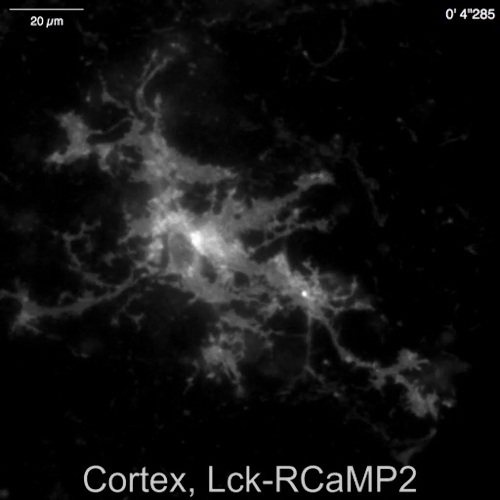
Video 4: Spontaneous Ca2+ transient observed in Lck-RCaMP2 in a cortical astrocyte Representative recording acquired at 2 Hz (Figure 4B), recorded in the same field of view as Video 5. Scale bar = 20 µm. Please click here to download this video.
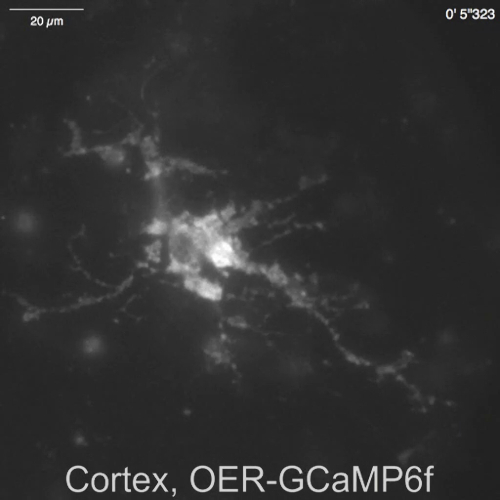
Video 5: Spontaneous Ca2+ transient observed in OER-GCaMP6f in a cortical astrocyte. Representative recording acquired at 2 Hz (Figure 4B), in the same field of view as Video 4. The scale bar = 20 µm. Please click here to download this video.
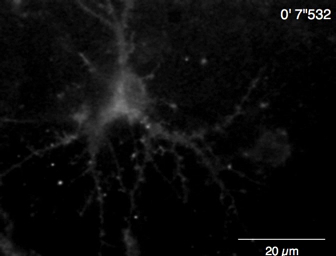
Video 6: Example of Ca2+ imaging in a rat hippocampal neuron (DIV 10) by Lck-GCaMP6f. Example of neuronal Ca2+ signals recorded at 2 Hz (Figure 5A). Scale bar = 20 µm. Please click here to download this video.
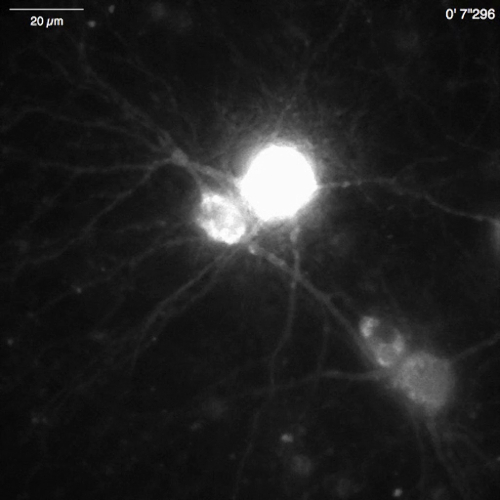
Video 7: Ca2+ release in a mouse hippocampal neuron (DIV 30) expressing OER-GCaMP6f. Example of neuronal Ca2+ signals recorded in a mouse hippocampal neuron infected with OER-GCaMP6f expression AAV vectors (Figure 5B). The neuron was stimulated with 100 µM dihydroxyphenylglycine (DHPG) applied at 30 s to evoke Ca2+ release from the ER. Scale bar = 20 µm. Please click here to download this video.
Discussion
Diverse biological outputs are initiated by Ca2+ signals. Ca2+ is a versatile intracellular signaling messenger. Decoding Ca2+ signals to evoke specific outputs has been a fundamental biological question, and Ca2+ imaging techniques to describe the diversity of Ca2+ signals are required. The presently detailed protocol enables the detection of distinct Ca2+ signals at the plasma membrane and ER (Figure 3 and Figure 4) and local Ca2+ microdomains inside a cell (Figure 4 and Figure 5). This contributes to describing the diversity of intracellular Ca2+ signals. The temporal resolution of Ca2+ signals was also improved by targeting GECIs in the plasma membrane and ER because it can avoid the effect of a three-dimensional diffusion of the Ca2+ and GECIs themselves, and it has the potential to detect the very moment of Ca2+ influx or Ca2+ release, which occurs on the membrane.
The protocol has some limitations. Users should keep in mind that the detected signals are the summation of “the moment of Ca2+ influx or release” and “Ca2+ diffused out from the original Ca2+ source”, especially for large Ca2+ signals. For example, although His stimulation in HeLa cells evokes Ca2+ release from the ER, its resultant Ca2+ signals are detected not only by ER-targeted OER-GCaMP6f but also by plasma-membrane-targeted Lck-RCaMP2 (Figure 3). Another limitation is that the spatiotemporal pattern of Ca2+ signals may not be the only determinant of the output of Ca2+ signals. The distribution of downstream effector proteins (such as Ca2+-dependent kinases and phosphatases) may also be a determining factor2. To completely decode the intracellular Ca2+ signals, analysis of downstream enzyme behavior, which is not covered in this protocol, is absolutely necessary.
One of the most critical aspects for successful Ca2+ imaging is the imaging setup and image acquisition conditions, as well as for other live-imaging studies. We previously showed that Ca2+ responses in the cell are highly dependent on the duration and intensity of excitation and on image acquisition conditions, including exposure time and acquisition frequency16. Excitation illumination power is the most critical factor, as it can cause light toxicity and photobleaching of GECIs. The recording conditions of exposure time, recording frequency, excitation light intensity, and duration of recording should be optimized according to the purpose of the experiment. We recommend reducing the exposure time and the excitation light intensity as much as possible to avoid photobleaching and phototoxicity to the cell. The recording frequency and the duration of recording should be sufficient to cover the Ca2+ elevation events of interest but should be kept as low as possible to avoid photobleaching and phototoxicity also. We recommend determining the recording frequency and the duration first and optimizing the light intensity and the exposure time so that the photobleaching of the GECIs is minimized. Another important factor is the expression level of the GECIs. GECIs have a Ca2+-buffering effect as they are Ca2+-binding proteins. Therefore, the overexpression of GECIs results in the buffering of Ca2+, which is physiologically necessary for the cells. The amount of GECI expression should be minimized to avoid imaging cells expressing high amounts of GECIs.
In conclusion, the dissection of Ca2+ signals at a subcellular resolution is one of the most important steps for decoding intracellular Ca2+ signals that determine the output biological phenomenon. This protocol provides a new method for the dissection of Ca2+ signals to describe the diversity among these signals. Presently, this technique is limited for in vitro experiments. However, Lck-GCaMP6f is already being used for in vivo Ca2+ imaging in mice17, and OER-GCaMP6f was confirmed to monitor Ca2+ signals in vivo in the VD motor neurons in C. elegans7. Therefore, targeting GECIs in the subcellular compartment has the potential to be expanded to in vivo imaging in the future, thus enabling Ca2+ dissection in vivo.
Disclosures
The authors have nothing to disclose.
Acknowledgements
This work is supported by the following grants: the Japan Science and Technology Agency (JST)/ Precursory Research for Embryonic Science and Technology (PRESTO) (JPMJPR15F8, Japan); the Japan Society for the Promotion of Science (JSPS)/Grants in Aid for Scientific Research (KAKENHI) (JP18H05414, JP17H05710, JP16K07316), Takeda Foundation. The authors thank Haruhiko Bito (University of Tokyo) for providing RCaMP2 and Arthur J.Y. Huang and Thomas McHugh (RIKEN CBS) for providing AAV vectors and for instructions regarding AAV preparation. The authors would also like to thank editors at the Journal of Visualized Experiments for their help with video filming and editing.
Materials
| Name | Company | Catalog Number | Comments |
| (RS)-3,5-Dihydroxyphenylglycine (DHPG) | Tocris | #0342 | |
| 0.5% DNase I stock solution | Sigma-Aldrich | #11284932001 | Prepare 0.5% DNase I (w/v) in Hanks' Balanced Salt Solution supplemented with 120 mM MgSO4. Prepare 160 µL aliquots and store at -30 °C. |
| 0.5% Trypsin-EDTA solution | Thermo Fisher Scientific | #25300054 | |
| 100 mM L-glutamine (×100 stock) | Thermo Fisher Scientific | #25030081 | Preparing small aliquots of 250-750 µL and store at -30 °C. |
| 100 mM Sodium pyruvate (×100 stock) | Thermo Fisher Scientific | #11360070 | Aliquots (10 mL) can be stored at -20 °C. After thawing, the solution can be maintained at 4 °C for 2 months. |
| 12-Well multiwell culture plates with low-evaporation lid | Falcon | #353043 | Low-evaporation lid is critical for culturing neuron-glia mixed culture. For cell line cells, alternative culture dishes can be used. |
| 18 mm diameter circular coverslips | Karl Hecht "Assistent" | #41001118 | Thickness 1, 18 mm diameter circular coverslips; alternative coverslips can be used. |
| 1 M HEPES | Thermo Fisher Scientific | #15630080 | pH 7.2-7.6 |
| 2.5% Trypsin stock solution (×20 stock) | Sigma-Aldrich | #T4674 | Prepare 150 µL aliquot and store at -30 °C. |
| 50% Poly(ethyleneimine) (PEI) solution | Sigma-Aldrich | #P3143 | Prepare 2% (V/V) PEI stock solution (×50) with distilled water sterilized by filtration. Store stock solution at -30 °C after preparing small aliquots of 250-750 µL. Prepare 0.04% PEI solution with distilled water on the day of coverslip coating. |
| 70% Ethanol | Kept in a spray bottle to be used for surface disinfection. | ||
| Adeno-associated virus (AAV) for Lck-GCaMP6f, Lck-RCaMP2, and OER-RCaMP2 expression under the direction of the EF1a promoter | AAV can be prepared using AAV Helper Free System (Agilent Technologies) and HEK293 cells, or alternative methods. pAAV.EF1a.Lck-GCaMP6f, pAAV.EF1a.Lck-RCaMP2, and pAAV.EF1a.OER-GCaMP6f are available upon request. | ||
| B-27 supplement (×50 stock) | Thermo Fisher Scientific | #17504044 | This can be replaced by B-27 plus supplement (Thermo Fisher Scientific; #A3582801) or MACS NeuroBrew-21 (Miltenyi Biotec, Bergisch Gladbach, Germany; #130-093-566). |
| B57BL/6 | Japan SLC, Inc. | ||
| Camera for microscopic image recording | The following cameras were available for use: cooled-CCD camera (e.g., Hamamatsu Photonics, OECA-ER), EM-CCD camera (e.g., Hamamatsu Photonics, ImagEM; Andor, iXon) or CMOS camera (e.g., Hamamatsu Photonics ORCA-Flash4.0) | ||
| Cell freezing container | Sarstedt K.K. | #95.64.253 | Alternative cell freezing container can be used. |
| Cell strainer | Falcon | #352350 | |
| CO2 incubator | Maintain at 37 °C, 5% CO2. | ||
| Cryogenic tube | Corning | #430661 | Alternative cryogenic tubes can be used. |
| Cryopreservation medium | Zenoaq | "CELLBANKER1" | |
| Culture medium (for HeLa cells) | Dulbecco's modified Eagle's medium (DMEM) supplemented with 10% heat-inactivated fetal bovine serum, and penicillin-streptomycin solution (final concentration: Penicillin 100 U/mL and Streptomycin 100 µg/mL) | ||
| Dissection medium | One milliliter of 1 M HEPES (final concentration 20 mM) to 49 mL DMEM | ||
| DMEM | Nacalai | #08456-65 | Alternative DMEM can be used. |
| DMEM | Nacalai | #08456-65 | Low glucose |
| DNA transfection reagent | Sigma-Aldrich | #6366244001 | "X-tremegene HP DNA transfection reagent" Alternative transfection reagents can be used. |
| Glass jar with a lid | 500 mL jar (for mouse) or 1,500 mL jar (for rat) to anesthetize the animal | ||
| HBSS | Thermo Fisher Scientific | #14170161 | HBSS free of calcium and magnesium |
| Heat inactivated bovine serum | Thermo Fisher Scientific | #10100147 | |
| HeLa cells | RIKEN BioResource Center | #RCB0007 | |
| Histamine | Sigma-Aldrich | #H7125 | |
| Image analysis software | Such as Metamorph (Molecular Devices), ImageJ (NIH), and TI Workbench14 (custom made) | ||
| Image splitting optics | Hamamatsu Photonics | #A12801-01 | W-view GEMINI |
| Image splitting optics dichroic mirror | Semrock | #FF560-FDi01-25×36 | For separation of green fluorescent protein/red fluorescent protein (GFP/RFP) signal |
| Image splitting optics emission filters | Semrock | #FF01-512/25-25, #FF01-630/92-25 | For emission of GFP/RFP signal, respectively |
| Imaging medium and buffer | Use optimal medium or buffer for the experiment. When medium is used, medium without phenol red is desirable to reduce background fluorescence. Add 20 mM HEPES to maintain pH outside of CO2 incubator. | ||
| Incubation saline | Add 1 mL of 1 M HEPES (20 mM) to 49 mL HBSS | ||
| Inverted fluorescence microscope | Such as IX73 (Olympus) or Eclipse TI (Nikon Instech) | ||
| Isoflurane | Pfizer | Used for anesthesia | |
| Maintenance medium (for 4 × 12 well dishes) | 48.5 mL Neurobasal-A medium supplemented with 1 mL B-27, 500 µL of L-glutamine stock and 25 µL Penicillin-Streptomycin solution. | ||
| Maintenance medium for frozen cortical cells (for 1 × 12 well dishes) | 12.2 mL Neurobasal plus medium supplemented with 250 µL B-27, 125 µL of L-glutamine stock and 6.2 µL Penicillin-Streptomycin solution. | ||
| MEM (Minimum Essential Medium) | Thermo Fisher Scientific | #11090-081 | |
| Microscope filter set for GCaMP6f imaging | Appropriate filter for GFP (excitation, 480 ± 10 nm; emission, 530 ± 20 nm) | ||
| Microscope filter set for RCaMP2 imaging | Appropriate filter for RFP (excitation, 535 ± 50 nm; emission, 590 nm long pass) | ||
| Microscope filter sets for double imaging of RCaMP2 and GCaMP6f | Semrock | #FF01-468/553-25, #FF493/574-FDi01-25×36, #FF01-512/630-25 | Dual excitation filter, Dual dichroic mirror, and emission filter for GFP/RFP imaging. |
| Microscope heating system | A heating system to maintain cells at 37 °C during the imaging. To avoid drift caused by thermal expansion, heating systems covering the entire microscope itself (e.g., Tokai Hit, Thermobox) are recommended. | ||
| Microscope light source for excitation | Mercury lamp (100 W), xenon lamp (75 W), Light-emitting diode (LED) illumination system (e.g., CoolLED Ltd., precisExcite; Thorlabs Inc., 4-Wavelength LED Source; Lumencor, SPECTRA X light engine). In case of mercury lump and xenon lamp, use ND filter to reduce the excitation intensity. | ||
| Microscope objective lens | Plan-Apochromat oil immersion objective with numerical aperture higher than 1.3 is highly recommended for the recording of spontaneous Ca2+ activity in neurons and astrocytes. | ||
| Neurobasal plus medium | Thermo Fisher Scientific | #A3582901 | |
| Neurobasal-A Medium | Thermo Fisher Scientific | #10888022 | Neurobasal plus medium (Thermo Fisher, A3582901) can be used instead of Neurobasal-A medium. |
| PBS(-): Phosphate-buffered saline free of Ca2+ and Mg2+ | Fujifilm Wako Pure Chemical Cooperation | #164-23551 | The absence of Ca2+ and Mg2+ is critical not to inhibit the trypsin activity. An alternative to PBS(-) can be used. |
| PC and image acquisition software | Such as Metamorph (Molecular Devices); Micromanager; TI Workbench14. | ||
| Penicillin-Streptomycin solution | Thermo Fisher Scientific | #15140122 | Penicillin 10,000 U/mL and Streptomycin 10,000 µg/mL |
| Plasmid for Lck-GCaMP6f, Lck-RCaMP2, and OER-RCaMP2 expression under cytomegalovirus promoter 7-9 | Available upon request | ||
| Plating medium (for 4 × 12 well dishes) | 48 mL MEM supplemented with 1 mL B-27 supplement, 500 µL L-glutamine stock (final concentration: 2 mM), 500 µL of sodium pyruvate stock (1 mM) and 25 µL Penicillin-Streptomycin solution (penicillin 5 U/mL, streptomycin 5 µg/mL). This concentration of Penicillin-Streptomycin, which is 1/20 of the concentration recommended by the manufacturer, is critical for neuronal survival. | ||
| Recording chamber | Elveflow | Ludin Chamber | This recording chamber is for 18 mm diameter round coverslips. |
| Reduced serum media | Thermo Fisher | #11058021 | Opti-MEM |
| Stereomicroscope | Used to dissect hippocampi. Olympus SZ60 or equivalent stereomicroscopes are available. | ||
| Surgical instruments | Standard dissecting scissors to cut the abdomen of a mouse or a rat, tweezers to pinch the uterus, delicate dissecting scissors to cut the uterus and the head of embryo, ring forceps to pinch the embryos, 13 cm curved Semken forceps (Fine Science Tools #11009-13) to extract brains, 3 forceps with fine tips (Dumont Inox #5) | ||
| Transfection reagent for neuron | Thermo Fisher Scientific | #L3000008 | "Lipofectamine 3000" reagent. It is composed of the the "supplement (P3000)" that should be mixed with plasmid DNA in the step 2.2.3, and the "transfection reagent (lipofectamine 3000)" used in the step 2.2.4. |
| Trypan blue (0.4%) | Thermo Fisher Scientific | #15250061 | |
| Wash medium for frozen cortical cells | 25 mL DMEM, supplemented with 250 µL heat-inactivated fetal bovine serum + 12.5 µL Penicillin Streptomycin. | ||
| Wistar rats | Japan SLC, Inc | Pregnant rats (E18) |
References
- Clapham, D. E. Calcium signaling. Cell. 131 (6), 1047-1058 (2007).
- Bagur, R., Hajnoczky, G. Intracellular Ca(2+) Sensing: Its Role in Calcium Homeostasis and Signaling. Molecular Cell. 66 (6), 780-788 (2017).
- Bannai, H., et al. Bidirectional Control of Synaptic GABAAR Clustering by Glutamate and Calcium. Cell Reports. 13 (12), 2768-2780 (2015).
- Tojima, T., Hines, J. H., Henley, J. R., Kamiguchi, H. Second messengers and membrane trafficking direct and organize growth cone steering. Nature Reviews Neuroscience. 12 (4), 191-203 (2011).
- Shigetomi, E., Kracun, S., Sofroniew, M. V., Khakh, B. S. A genetically targeted optical sensor to monitor calcium signals in astrocyte processes. Nature Neuroscience. 13 (6), 759-766 (2010).
- Chen, T. W., et al. Ultrasensitive fluorescent proteins for imaging neuronal activity. Nature. 499 (7458), 295-300 (2013).
- Niwa, F., et al. Dissection of local Ca(2+) signals inside cytosol by ER-targeted Ca(2+) indicator. Biochemical and Biophysical Research Communications. 479 (1), 67-73 (2016).
- Vervliet, T., et al. Basal ryanodine receptor activity suppresses autophagic flux. Biochemical Pharmacology. 132, 133-142 (2017).
- Sakuragi, S., Niwa, F., Oda, Y., Mikoshiba, K., Bannai, H. Astroglial Ca2+ signaling is generated by the coordination of IP3R and store-operated Ca2+ channels. Biochemical and Biophysical Research Communications. 486 (4), 879-885 (2017).
- Inoue, M., et al. Rational design of a high-affinity, fast, red calcium indicator R-CaMP2. Nature Methods. 12 (1), 64-70 (2015).
- Quasthoff, K., et al. Freshly frozen E18 rat cortical cells can generate functional neural networks after standard cryopreservation and thawing procedures. Cytotechnology. 67 (3), 419-426 (2015).
- Boehringer, R., et al. Chronic Loss of CA2 Transmission Leads to Hippocampal Hyperexcitability. Neuron. 94 (3), 642-655 (2017).
- Arizono, M., et al. Receptor-selective diffusion barrier enhances sensitivity of astrocytic processes to metabotropic glutamate receptor stimulation. Science Signaling. 5 (218), ra27 (2012).
- Kanemaru, K., et al. In vivo visualization of subtle, transient, and local activity of astrocytes using an ultrasensitive Ca(2+) indicator. Cell Reports. 8 (1), 311-318 (2014).
- Inoue, T. TI Workbench, an integrated software package for electrophysiology and imaging. Microscopy (Oxford, UK). 67 (3), 129-143 (2018).
- Miyamoto, A., Bannai, H., Michikawa, T., Mikoshiba, K. Optimal microscopic systems for long-term imaging of intracellular calcium using a ratiometric genetically-encoded calcium indicator. Biochemical and Biophysical Research Communications. 434 (2), 252-257 (2013).
- Srinivasan, R., et al. New Transgenic Mouse Lines for Selectively Targeting Astrocytes and Studying Calcium Signals in Astrocyte Processes In Situ and In Vivo. Neuron. 92 (6), 1181-1195 (2016).
Reprints and Permissions
Request permission to reuse the text or figures of this JoVE article
Request PermissionThis article has been published
Video Coming Soon
Copyright © 2025 MyJoVE Corporation. All rights reserved