
A subscription to JoVE is required to view this content. Sign in or start your free trial.
Method Article
Applying an eMASS Customization Program as a Research Tool to Evaluate Consumer Benefits
In This Article
Summary
Presented here is a protocol to examine consumer responses toward mass customization in the context of online retailing. The protocol details the online survey procedure and how to analyze data using structural equation modeling and group differences using latent mean analyses.
Abstract
As many scholars and practitioners study personalization and relationship marketing, it is important to provide personalization such as mass customization through marketing technology. The purpose of this study is to examine how to conduct consumer research using an online survey and analysis of data. This study examines consumers' perceived benefits while customizing a product as well as emotional product attachment, attitudes toward a customization program, and loyalty intentions in the context of online retailing. In addition, this study investigates how consumer responses are different based on individual characteristics such as fashion innovativeness. An online survey company in South Korea recruited 290 female apparel shoppers who purchased apparel online. To enhance external validity, this study used an existing retail website with a well-established mass customization program. After completing the customization program, participants complete the online questionnaire. Structural equation modeling (SEM) and latent mean analyses (LMAs) are then performed for analyses. This study stresses the importance of testing measurement invariance for mean comparisons. Before the SEM and LMA, this study follows the hierarchy of invariance tests (configural invariance test, metric invariance test, and scalar invariance test), which are not considered by traditional approaches such as ANOVA. These statistical analyses provide applicability of the invariance test procedures and LMA to consumer behaviors. The conclusions of mean differences have integrity and validity because they are guided by a sophisticated statistical procedure to ensure measurement invariance.
Introduction
Mass customization refers to the ability of an e-retailer to tailor products, services, and the transactional environment to individual customers1. Today’s consumers are not satisfied with standard products, and many retailers have recognized this. Offering a mass customization option is one method to obtain customer loyalty and competitive advantages2. Mass customization as a marketing tactic allows consumers to create their own products based on particular needs and thus provides individualized products or services3. For example, consumers can not only purchase a pair of shoes that are mass produced, but they can also create a new and unique pair of shoes that are not available on regular retail websites by choosing the color, fabric, and other design components. As a result, consumers can purchase more favorable products, and their satisfaction with the customized product as well as brand loyalty increase4,5.
With increasing use of the internet, the mass customization process has become more rapid and efficient in terms of lowering production time and providing more design options with the same costs. Furthermore, retailers can obtain information regarding what their target customers prefer and thus build strong relationships with them6,7. As such, many industries (i.e., apparel, shoes, cars, and computers) have adopted customization programs. Although mass customization benefits both consumers and retailers, some retailers face challenges8. Therefore, there is a need to examine how consumers perceive benefits and how these benefits influence other shopping responses for long-term success.
Drawing on the hierarchy of effects (HOE) model from persuasion theories9, this study proposes that consumers process information based on cognition-affect-conation sequence. Specifically, this study examines (after creating a mass-customized product) whether perceived consumer benefits (cognition) influence loyalty intentions (conation) through product attachment and the attitude towards a mass customization program (affect). Based on motivation theory10, perceived benefits are divided into extrinsic and intrinsic benefits11.
Extrinsic benefit pertains to a consumer’s perceived value derived from using a product12 (thus, close in value to the product quality11), whereas intrinsic benefit indicates a pleasant experience when using a product11. In a mass customization context, extrinsic benefit is associated with the product a consumer creates, and intrinsic benefit is related to the customization experience that satisfies hedonic and experiential needs13,14. Prior research has found that consumers’ perceived benefits enhance emotional product attachment15 and positive attitudes toward a mass customization program16. Emotional product attachment refers to an emotional tie that consumers connect to a product17, which positively influences attitudes toward the customization program18 and loyalty intentions19. Furthermore, attitudes toward a customization program positively influence loyalty intentions20.
Lastly, this study examines how an individual characteristic (i.e., fashion innovativeness) influences consumer responses differently. Fashion innovativeness refers to the degree to which an individual’s innovative tendency influences adoption of a new fashion item21. Research findings show that consumers who desire to avoid conformity (i.e., highly fashion innovative consumers) are motivated to acquire unique products, indicating that mass customization may be an effective tactic to differentiate themselves from others22. Therefore, this study assumes that a greater number of positive responses will be generated for highly fashion innovative consumers.
Based on previous literature reviews, this study addresses the following research hypotheses. H1: Perceived benefits (a: extrinsic benefit, b: intrinsic benefit) of a mass customized product will positively influence emotional product attachment; H2: Perceived benefits (a: extrinsic benefit, b: intrinsic benefit) of a mass customized product will positively influence attitudes toward a mass customization program; H3: Emotional product attachment will positively influence attitudes toward a mass customization program; H4: Emotional product attachment will positively influence loyalty intentions; H5: Attitude toward a mass customization program will positively influence loyalty intentions; and H6: Compared to low fashion innovativeness, high fashion innovators will have more positive responses to (a) perceived benefits, (b) emotional product attachment, (c) attitudes, and (d) behavioral intentions.
To enhance external validity, this study uses an existing mass customization program. Potential participants in South Korea are recruited for this study and are asked to create their own trench coats using a program as if they had actually purchased the product. To explore the participants’ responses based on their customizing experiences, this study uses an online survey. Participants can access the questionnaire immediately after using the customization program online. After collecting data, the study uses single-group SEM to investigate the effects of consumer benefits on product attachment, attitude, and loyalty intentions. To examine the moderating roles of fashion innovativeness, the study uses LMAs.
Access restricted. Please log in or start a trial to view this content.
Protocol
This research was exempted from the IRB Review at Ewha Womans University and was assigned protocol number #143-18.
1. Recruitment of Participants
- Prepare to conduct an online survey.
NOTE: An online survey was conducted using a survey company in South Korea. The research company has the largest consumer panel with high response rates in Korea. Age and gender distributions in the panel reflect the state of the Korean population. The consumer panel has a high degree of reliability through the verification of real names. Since the research company manages the panel continuously with various innovative methods, the panel’s loyalty toward the research company is high; therefore, survey results obtained by the company are known to be highly reliable. - Recruit female consumers who have experience shopping for apparel online.
NOTE: Female consumers in Korea spend a high percentage of income on apparel shopping, and shopping behaviors occur mostly online23. Therefore, selecting this group as participants for this study is suitable. - Send an invitation email to the participants that includes information regarding the purpose of the study and assurance of the confidentiality of their responses.
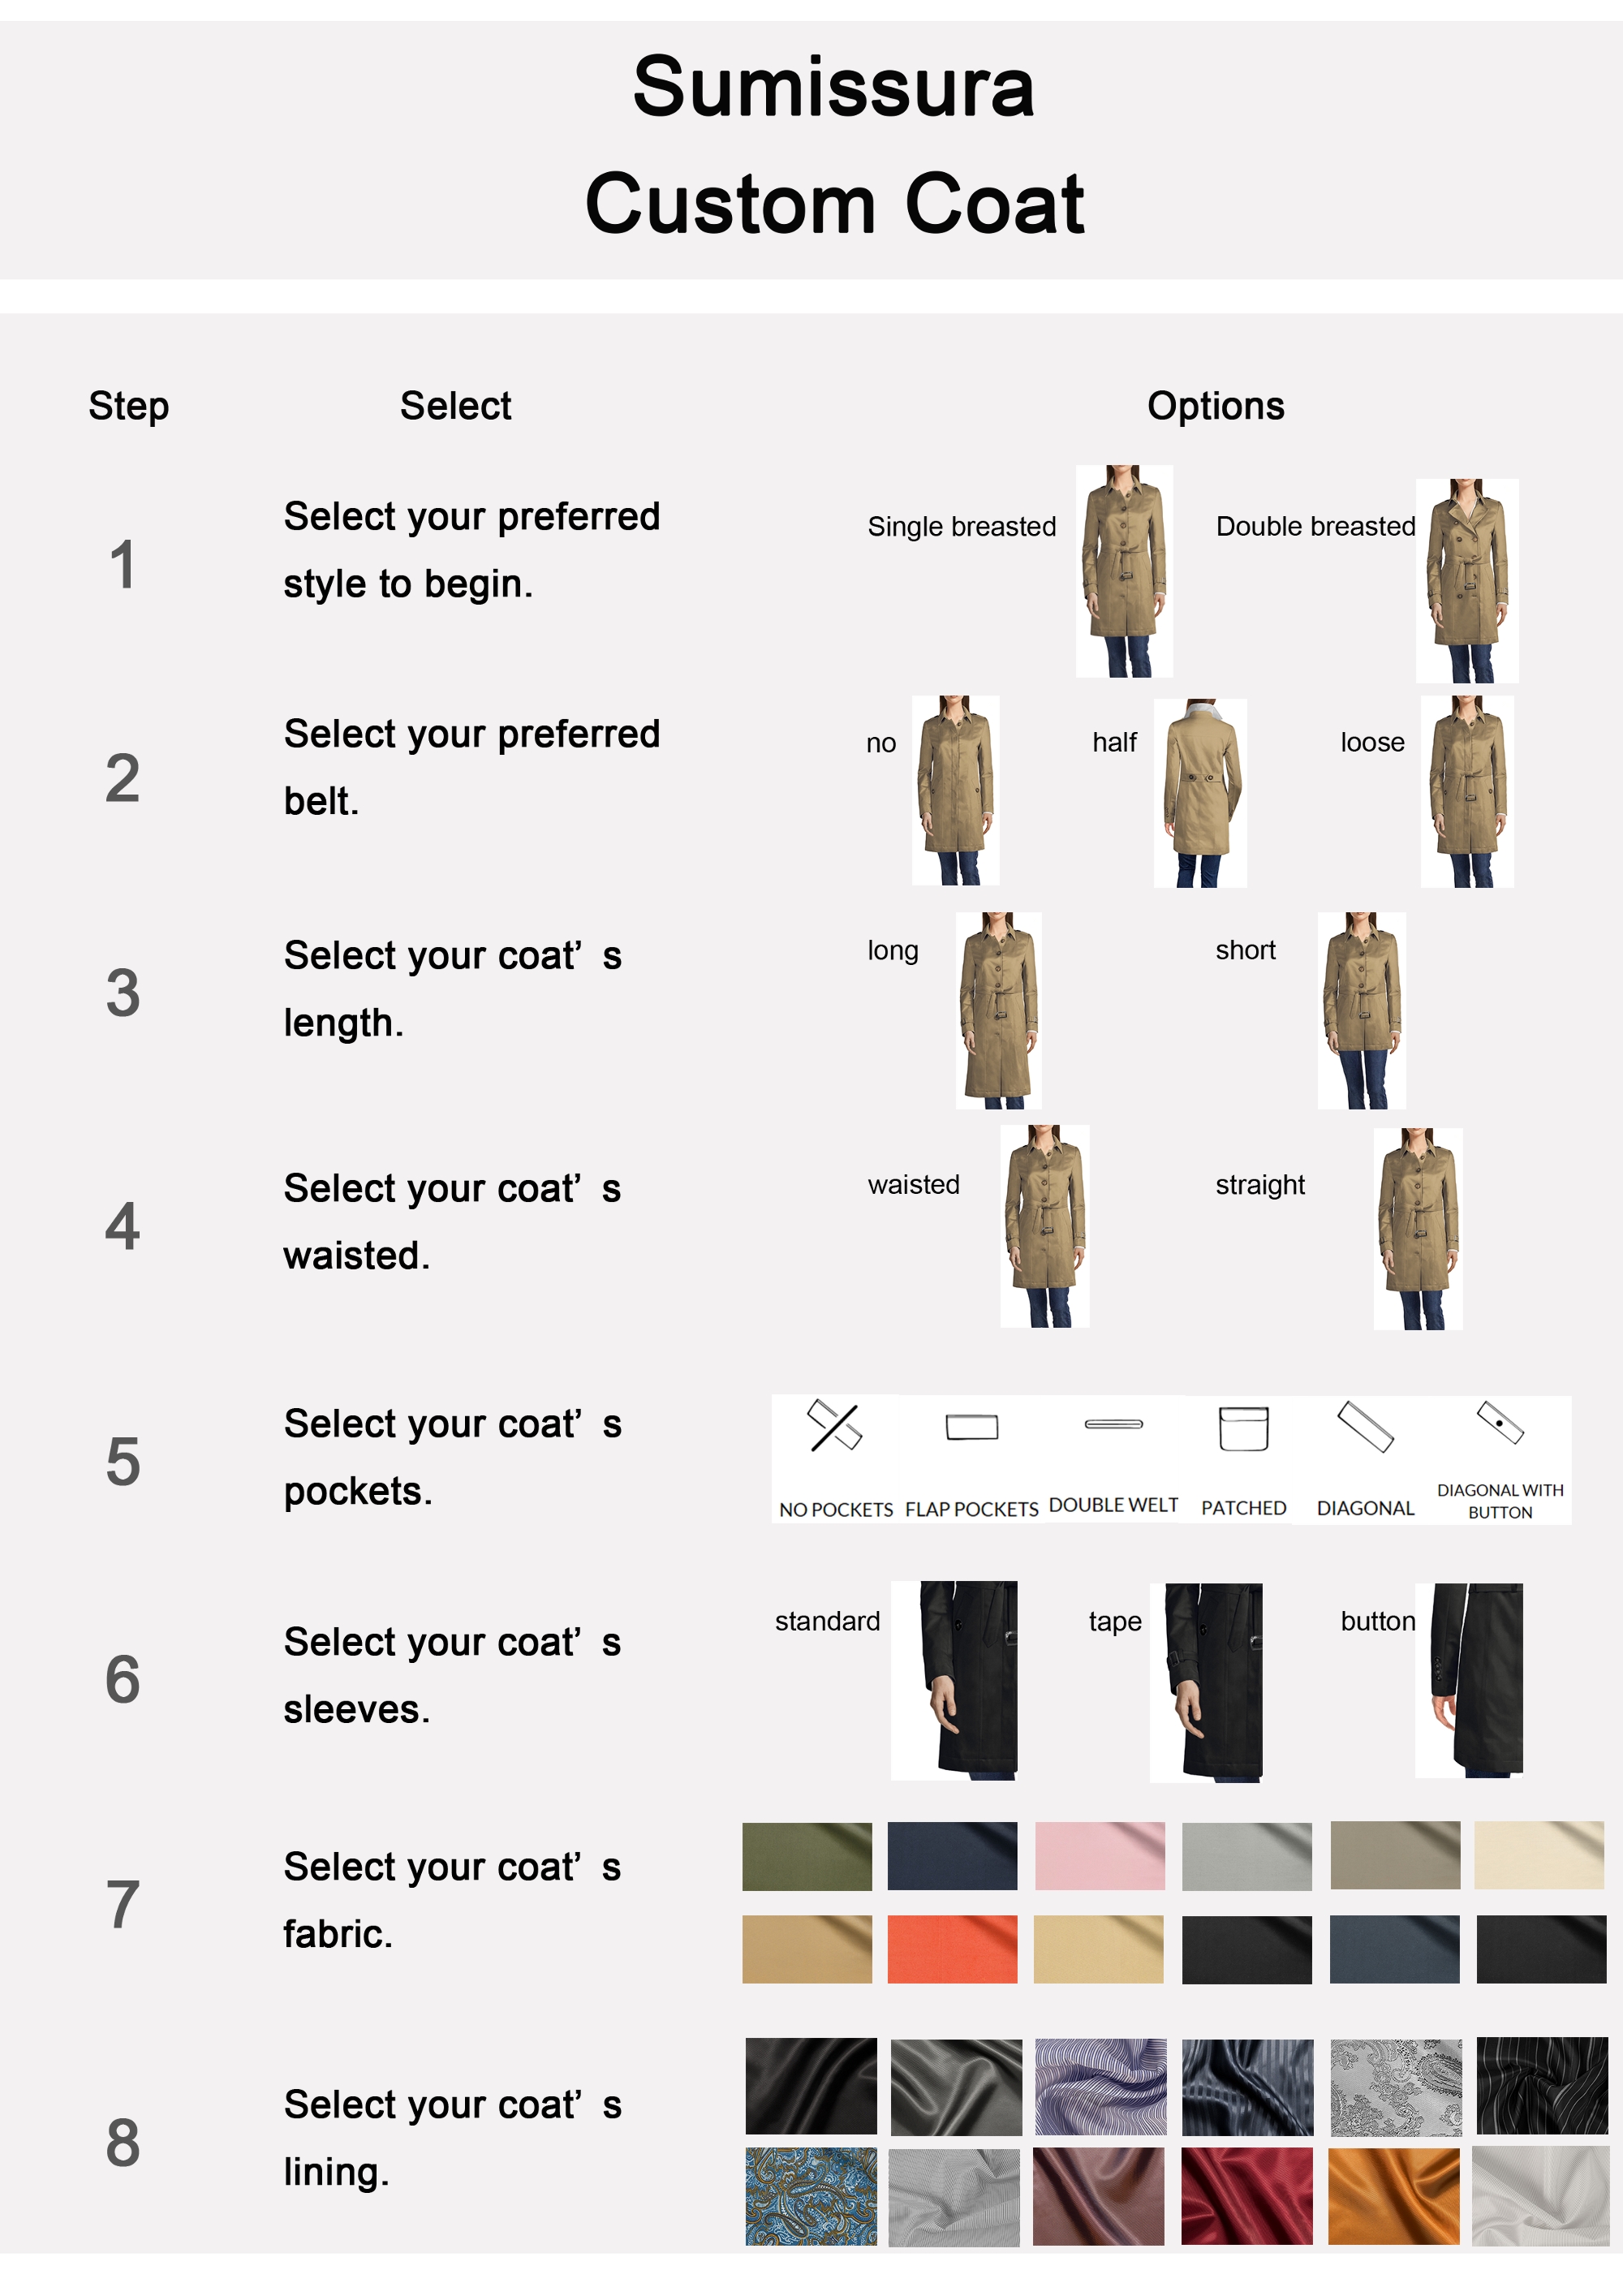
- Send guidelines to those who agree to take part in the survey showing how to create trench coats using the customization program (see Figure 1).
NOTE: To avoid potential situations in which participants may encounter difficulty using the customization program, a moderator from the research company sent the guidelines. Furthermore, the moderator called the participants and explained the customization procedure while participants reviewed the guidelines. - Ask the participants to capture a screenshot of the created trench coat and provide a price for the coat to ensure that they actually create a trench coat in the customization program.
- Send a link that is connected to the e-mass customization program in an existing shopping website when the participants understand the procedure.
- Provide the following scenario to the participants: “Please imagine that you are well-off enough to purchase likable clothing and have to purchase a trench coat to attend an important meeting. You want to create a unique trench coat. While browsing the internet, you come across the perfect apparel website that has a mass customization program”.
NOTE: This step is required to increase involvement levels and control product type and consumer perception of product price. - Allow participants 24 h to create a trench coat after reading the scenario.
NOTE: Participants are free to create a trench coat by choosing a preferred overall style, collar, coat lengths, sleeve length, pockets, fabric, and lining in the case that they will actually purchase it. If they have problems creating a coat in the customization program, they are allowed to call and ask the moderator at any time during the 24 h period. - Activate the survey link after 24 h so that participants who are ready to take the survey (i.e., those who have finished capturing the screenshot of the trench coat they created) can click on the survey link.

Figure 1: Directions for using the e-mass customization program. Participants of online survey read directions regarding how to create the trench coats using the customization program and follow steps 1–8. Please click here to view a larger version of this figure.
2. Survey Procedure
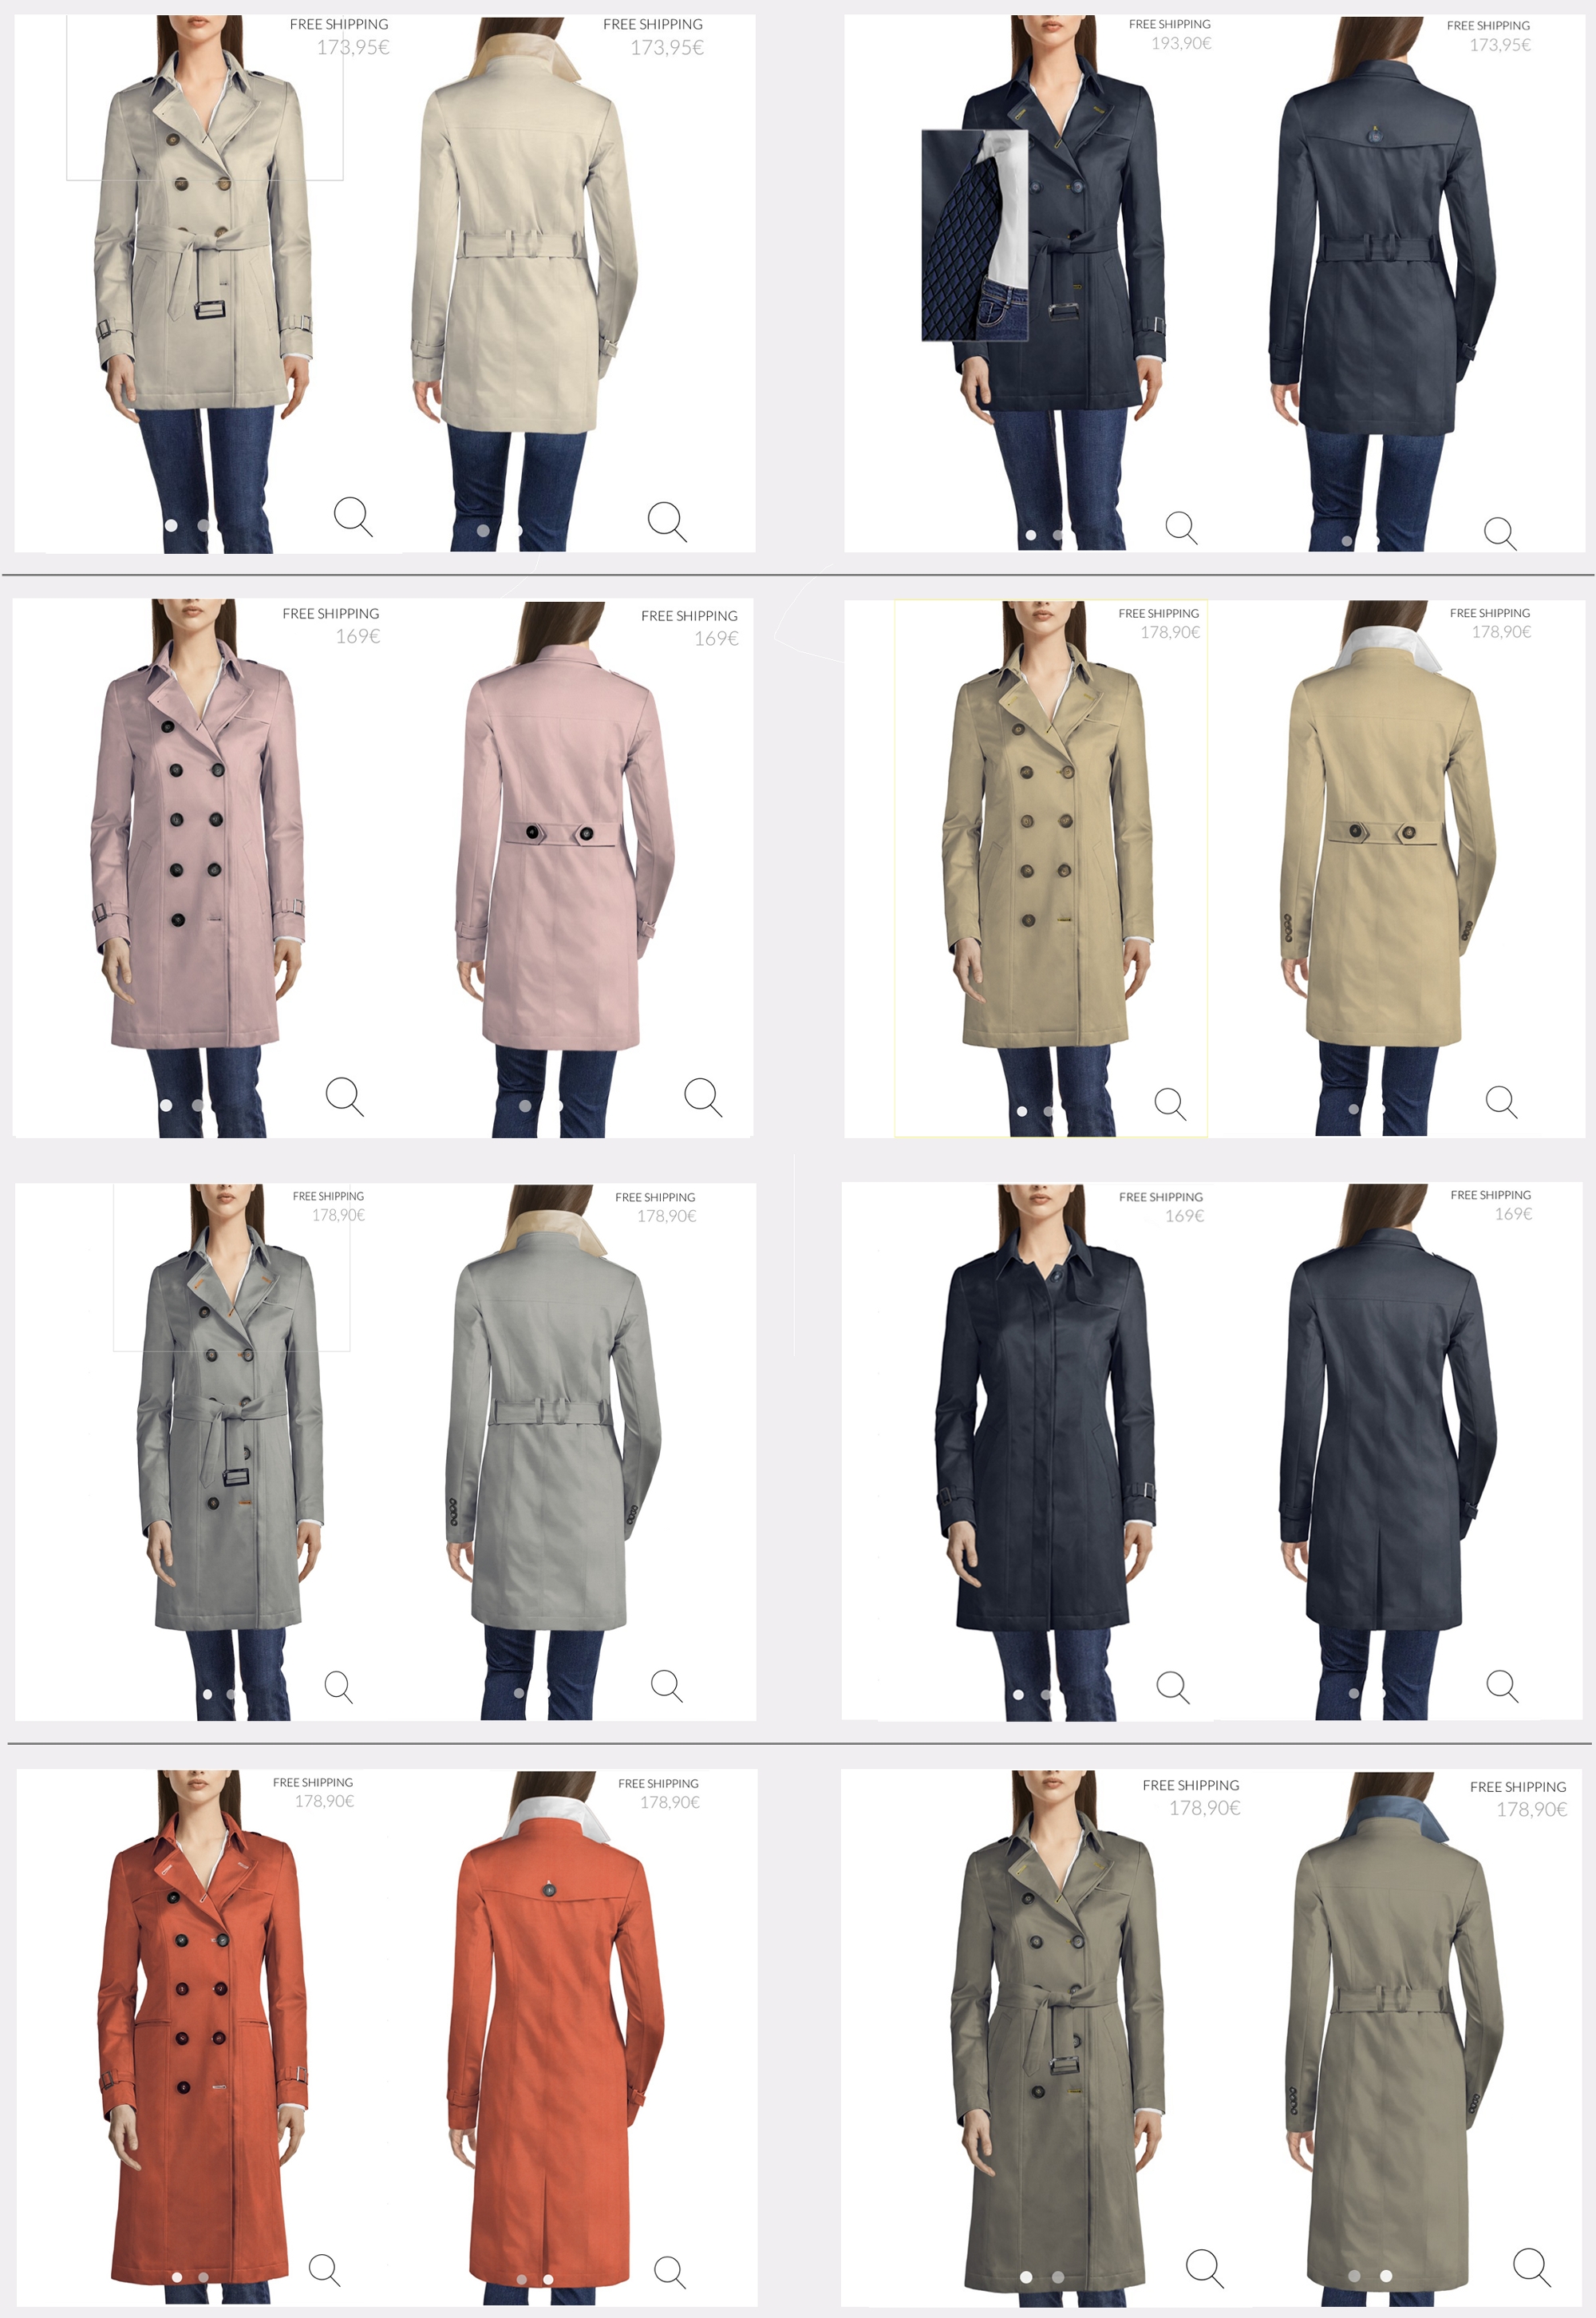
- Ask participants to upload the screenshot and price of the trench coat they created to the first page of the survey (see Figure 2).
NOTE: Only participants who upload the screenshot may access the questionnaire. - Ask participants to complete the online questionnaire regarding perceived benefits, emotional attachment to the customized product, attitude toward the customization program, loyalty intentions, and demographic questions (see Table 1).
- Give a reward to those who complete the survey.
NOTE: Here, participants received a reward of ₩10,000 (about US $10) for participation. Participants who quit the survey or fail to provide the screenshot and price received ₩1,000 (about US $1).

Figure 2: Examples of trench coats created using the e-mass customization program. Participants created trench coats by selecting a preferred collar, length, fabric, etc., followed by uploading a screenshot of the trench coat creation. Please click here to view a larger version of this figure.
| Extrinsic Benefit (Franke et al., 2009) |
| compared to the standard product, the customized product would ___________. |
| 1. Better satisfy my requirements |
| 2. Better meet my personal preferences |
| 3. More likely to be the best solution for me |
| Intrinsic Benefit (Franke and Schreier, 2010) |
| 1. I enjoyed this design activity very much |
| 2. I thought designing the product was quite enjoyable |
| 3. Designing this product was very interesting |
| Emotional Product Attachment (Thomson et al., 2005) |
| Compared to the standard product of this brand, my feeling toward its customized product can be characterized by ___________. |
| 1. Affection |
| 2. Connection |
| 3. Passion |
| 4. Captivation |
| Attitude toward a mass customization program (Li et al., 2001) |
| The mass customization program in this website was ___________. |
| 1. Unappealing e appealing |
| 2. Unpleasant e pleasant |
| 3. Unattractive e attractive |
| 4. Dislikable e likable |
| Loyalty Intentions (Kwon and Lennon, 2009) |
| 1. I would purchase a customized product in this customization program in the near future |
| 2. I would recommend this customization program to friends or relatives |
| 3. I would return to this website and customize a product in the near future |
| Product Involvement (Zaichkowsky, 1985) |
| To me, clothing is ___________. |
| 1. Unimportant e important |
| 2. Boring e interesting |
| 3. Unappealing e appealing |
| 4. Not needed e needed |
| 5. Unexciting e exciting6. Worthless e valuable |
| Fashion innovativeness (Park et al., 2007) |
| 1. In general, I am the last in my circle of friends to know the names of the latest new fashion (R) |
| 2. In general, I am among the last in my circle of friends to buy a new fashion item when it appears (R) |
| 3. Compared to my friends, I own new fashion items. |
| 4. I know the names of new fashion designers before other people do. |
| 5. If I heard that a new fashion item was available in the store, I would be interested enough to buy it. |
| 6. I will buy a new fashion item even if I have not seen it before. |
| (R) Reverse coded |
Table 1: Measurement scale. This table has been used previously29.
3. Data Preparation
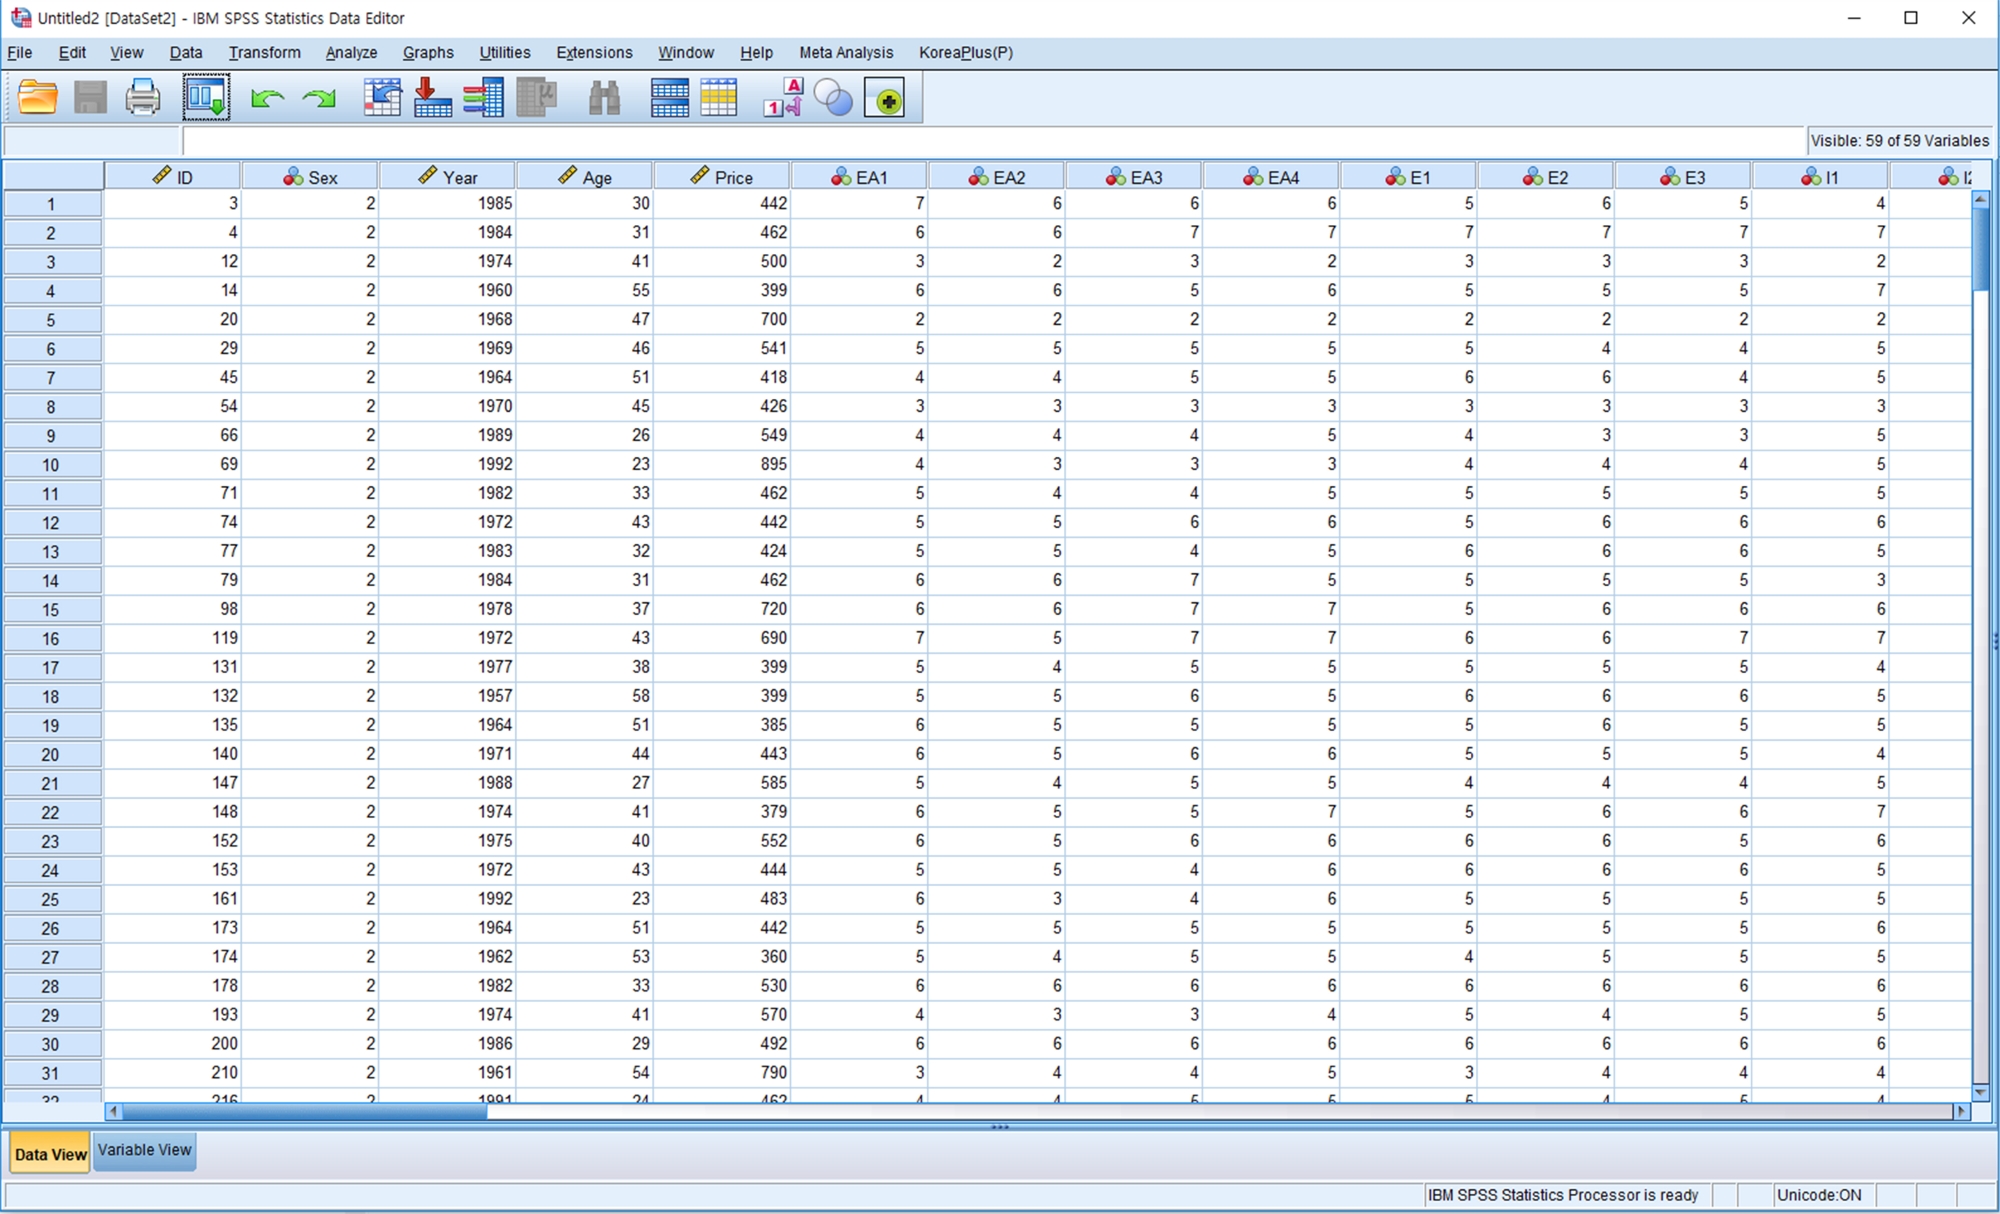
- Save the survey data in an SPSS file as “Data_TOTAL.sav” (see Figure 3), which contains all the responses of survey participants. Delete cases that include missing values. Use the cleaned data to conduct an SEM analysis.
- Separate the total data into two data files: high and low fashion innovative groups. Use a median split. Sum and average the scores of six items of fashion innovativeness, and calculate the median score of fashion innovativeness (med = 4.17).
NOTE: Median split is frequently used in psychology and marketing research, and using a median split for a continuous variable to examine group differences is valid24. - Click “Recode into Different Variables” under the “Transform” menu. Create a new variable, “fashion innovative group (FIG)”, by coding “1 (low fashion innovative group)” if the mean score is lower than the median (e.g., median = 4.17), or by coding “2 (high fashion innovative group)” if it is higher than the median (see Figure 4).
- Click “Split into files” under the “Data” menu, double-click the variable “fashion innovative group (FIG)” to move it to the “Split Cases by” field, and assign the “Output File Directory” location to save the files (see Figure 5).
- Save “1.sav” and “2.sav” in the assigned directory. Change the file names to “Data_low fashion innovativeness.sav” and “Data_high fashion innovativeness.sav” to use both for LMA.

Figure 3: Data_TOTAL. The data includes responses of all participants (n = 290) used for SEM analysis. Please click here to view a larger version of this figure.

Figure 4: Creating the new variable "fashion innovative group (FIG)". The new variable (FIG) was made by coding “1 (low fashion innovative group)” and “2 (high innovative group)”. Please click here to view a larger version of this figure.

Figure 5: Splitting the dataset into two data files. The total data file, "Data_TOTAL", was divided into "Data_low fashion innovativeness.sav" and "Data_high fashion innovativeness.sav" files for subsequent use in an LMA. Please click here to view a larger version of this figure.
4. Running a Confirmatory Factor Analysis (CFA)
- Conduct a single group CFA with the five-factor measurement model to confirm the convergent validity. Click “Select data file(s) | Data_TOTAL.sav”. Develop the measurement model based on the research questions.
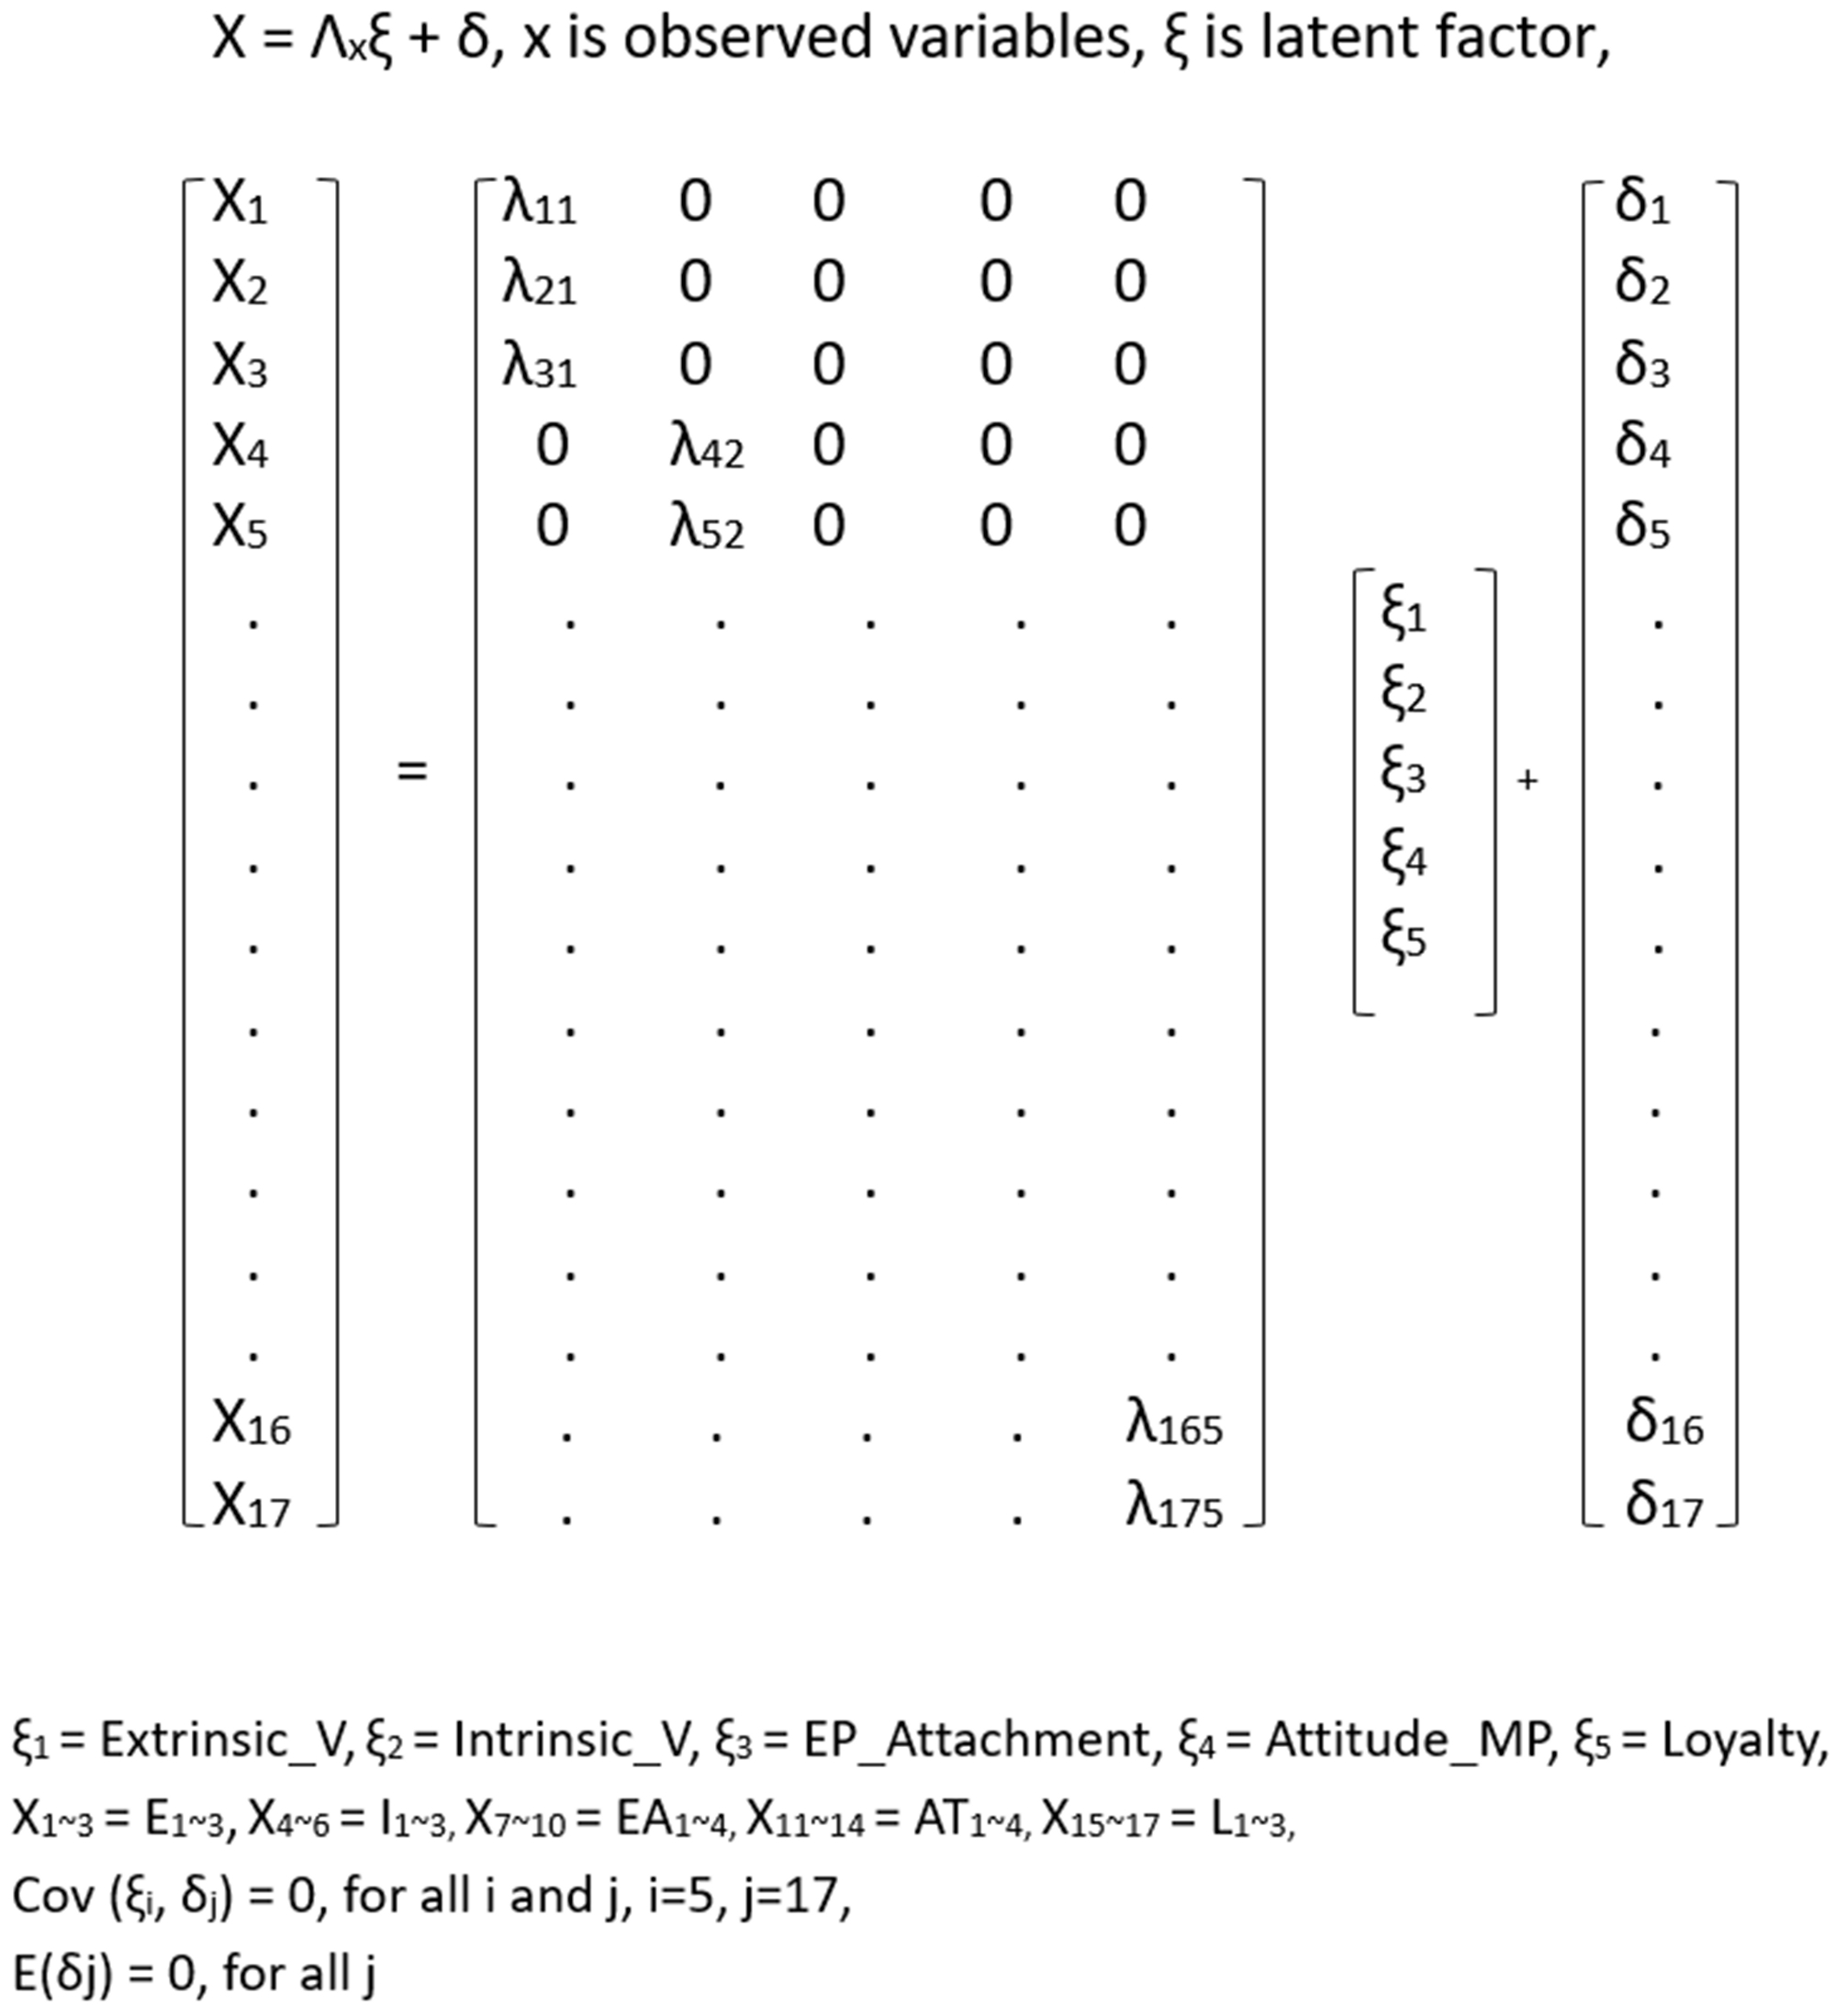
- The measurement model includes five latent variables (i.e., extrinsic benefit, intrinsic benefit, emotional product attachment, attitudes toward a mass customization program, and loyalty intentions) and 17 observed variables (three observed variables for extrinsic benefit, three for intrinsic benefit, four for emotional product attachment, four for attitudes toward a mass customization program, and three for loyalty intentions). Set variances of the latent variables as “1” (see Figure 6 and Figure 7). Click “Calculate estimates.”
- Check the fit indices of the measurement model from results of the single group CFA: goodness-of-fit index (GFI), adjusted goodness-of-fit index (AGFI), normed fit index (NFI), Tucker-Lewis index (TLI), comparative fit index (CFI), and root mean square error of approximation (RMSEA).

Figure 6: Model specification for confirmatory factor analysis. Please click here to view a larger version of this figure.

Figure 7: Measurement model for confirmatory factor analysis. The measurement model for CFA was created by using the AMOS program. Variance of latent variables were set as “1”. Please click here to view a larger version of this figure.
5. Running an SEM
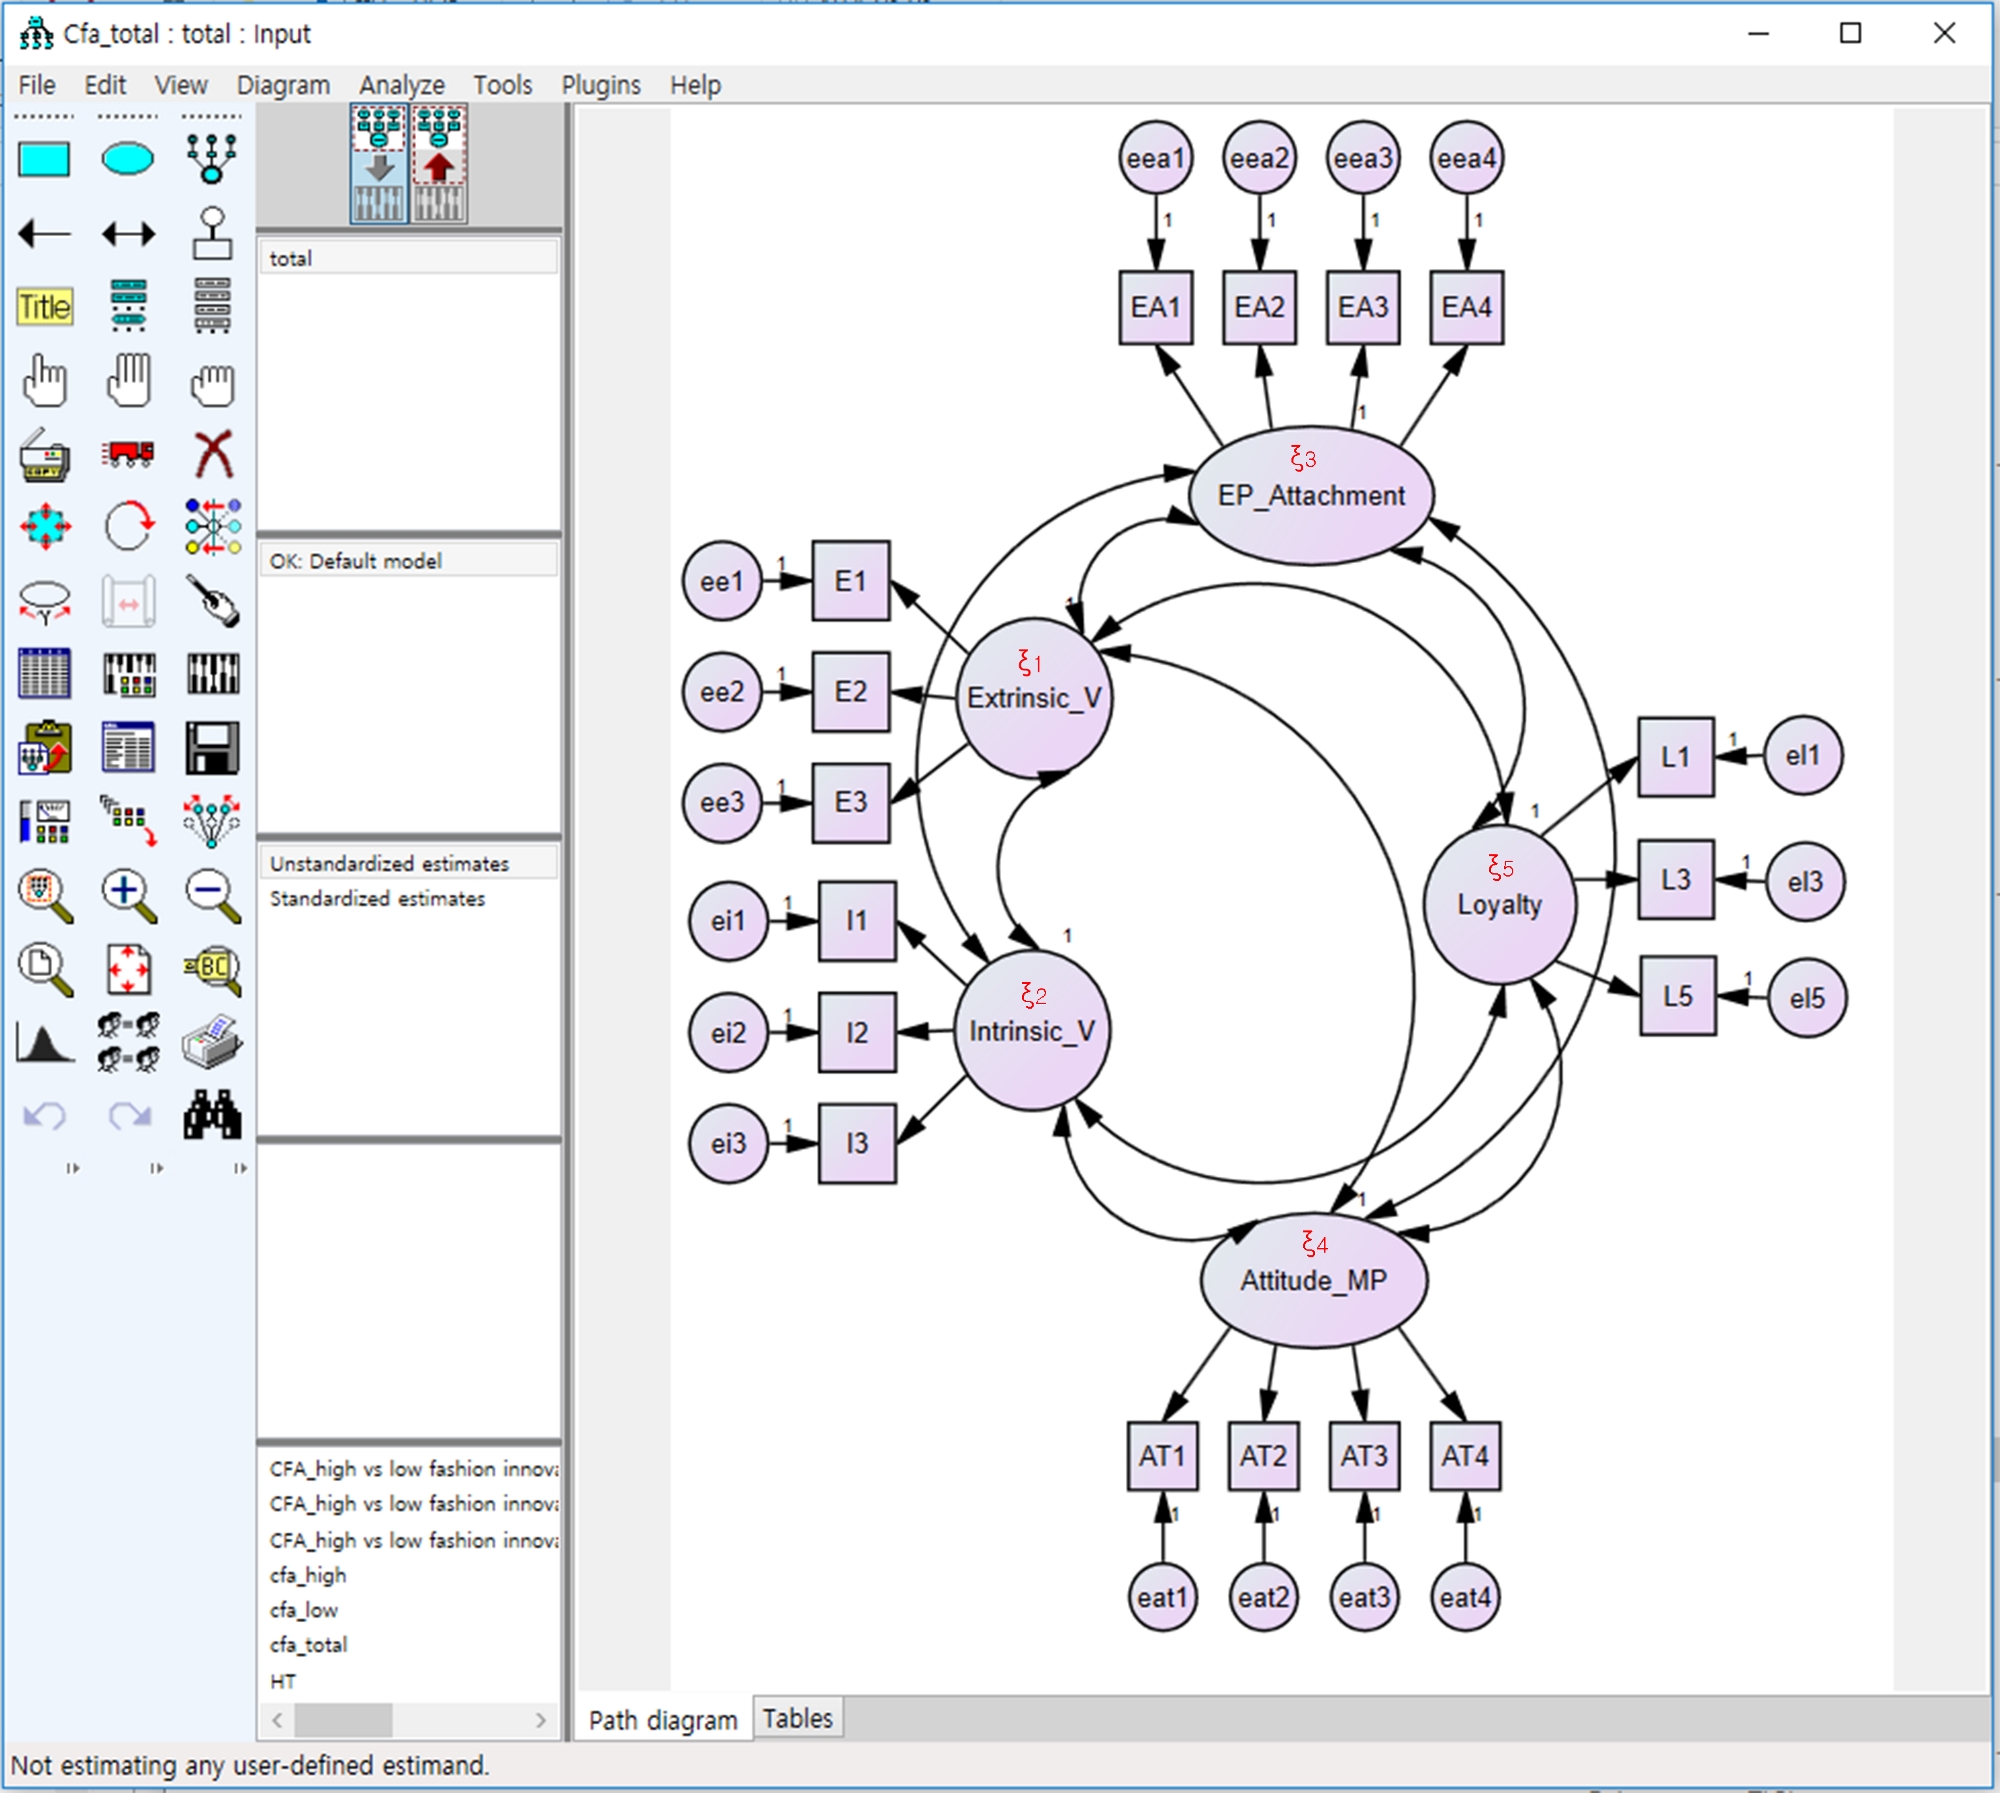
- To test the relationships among latent variables, conduct an SEM. Click “Select data file(s) | Data_TOTAL.sav”. Develop the SEM based on the research questions, including five latent variables and 17 observed variables.
- Draw arrows from “Extrinsic_V” and “Intrinsic_V” to “EP_Attachment” and “Attitude_MP,” as well as from “EP_Attachment” and “Attitude_MP” to “Loyalty.” Add three unobserved variables, namely “z1” as a predictor of “EP_Attatchment”, “z2” as a predictor of “Attitude_MP”, and “z3” as a predictor of “Loyalty” (see Figure 8, Figure 9). Click “Calculate estimates”. Check the “Estimates” and fit indices of the model.

Figure 8: Model specification for structural equation modeling. Please click here to view a larger version of this figure.

Figure 9: Structural equation modeling analysis. Please click here to view a larger version of this figure.
6. Conducting Invariance Tests for LMA
- To compare the high and low fashion innovative groups, conduct an LMA based on multi-group confirmatory factor analysis (MGCFA). Before the LMA, test configural invariance, metric invariance, and scalar invariance between both groups25.
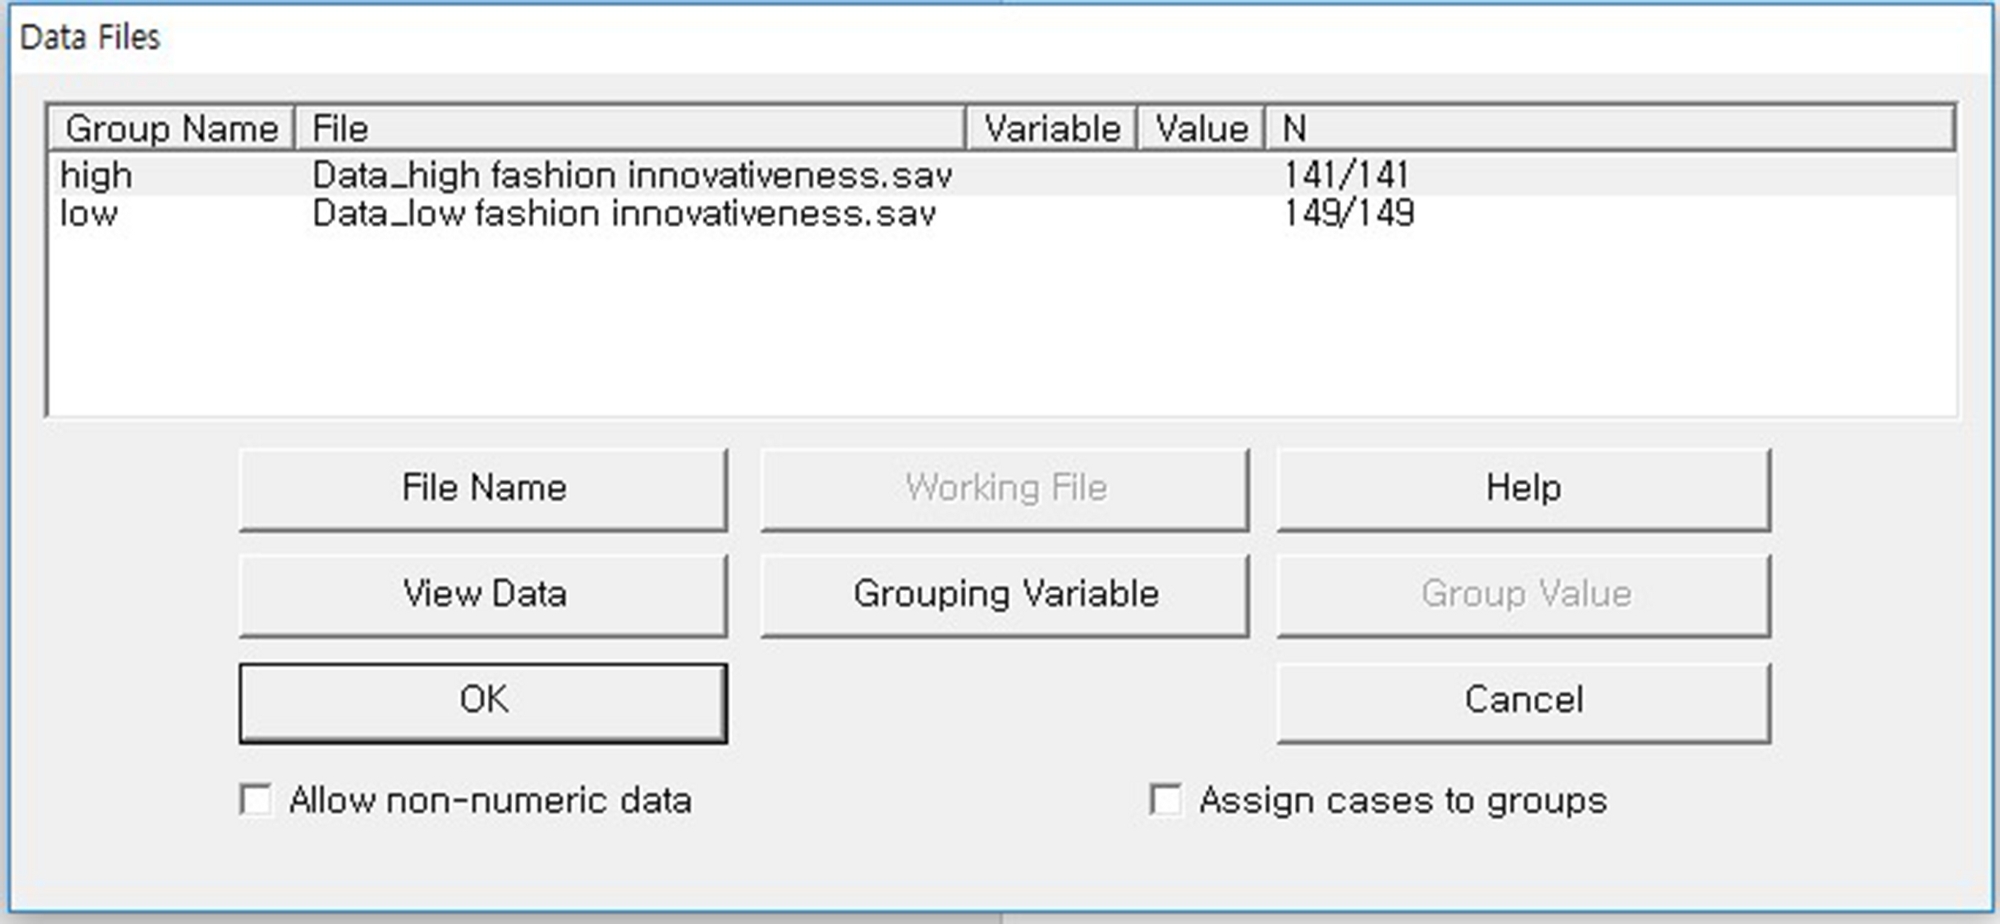
- Creating the multi-group measurement model: create the measurement model (i.e., the model for MGCFA) with two groups named “high” and “low” under “Manage Groups”. Select the data files for the groups in the following manner: “Data_low fashion innovativeness.sav” for the low fashion innovative group and “Data_high fashion innovativeness.sav” for the high fashion innovative group (see Figure 10).

Figure 10: Selecting data files for groups. The measurement model for MGCFA was created, and two data files (“Data_low fashion innovativeness.sav” and “Data_high fashion innovativeness.sav”) were uploaded. Please click here to view a larger version of this figure.
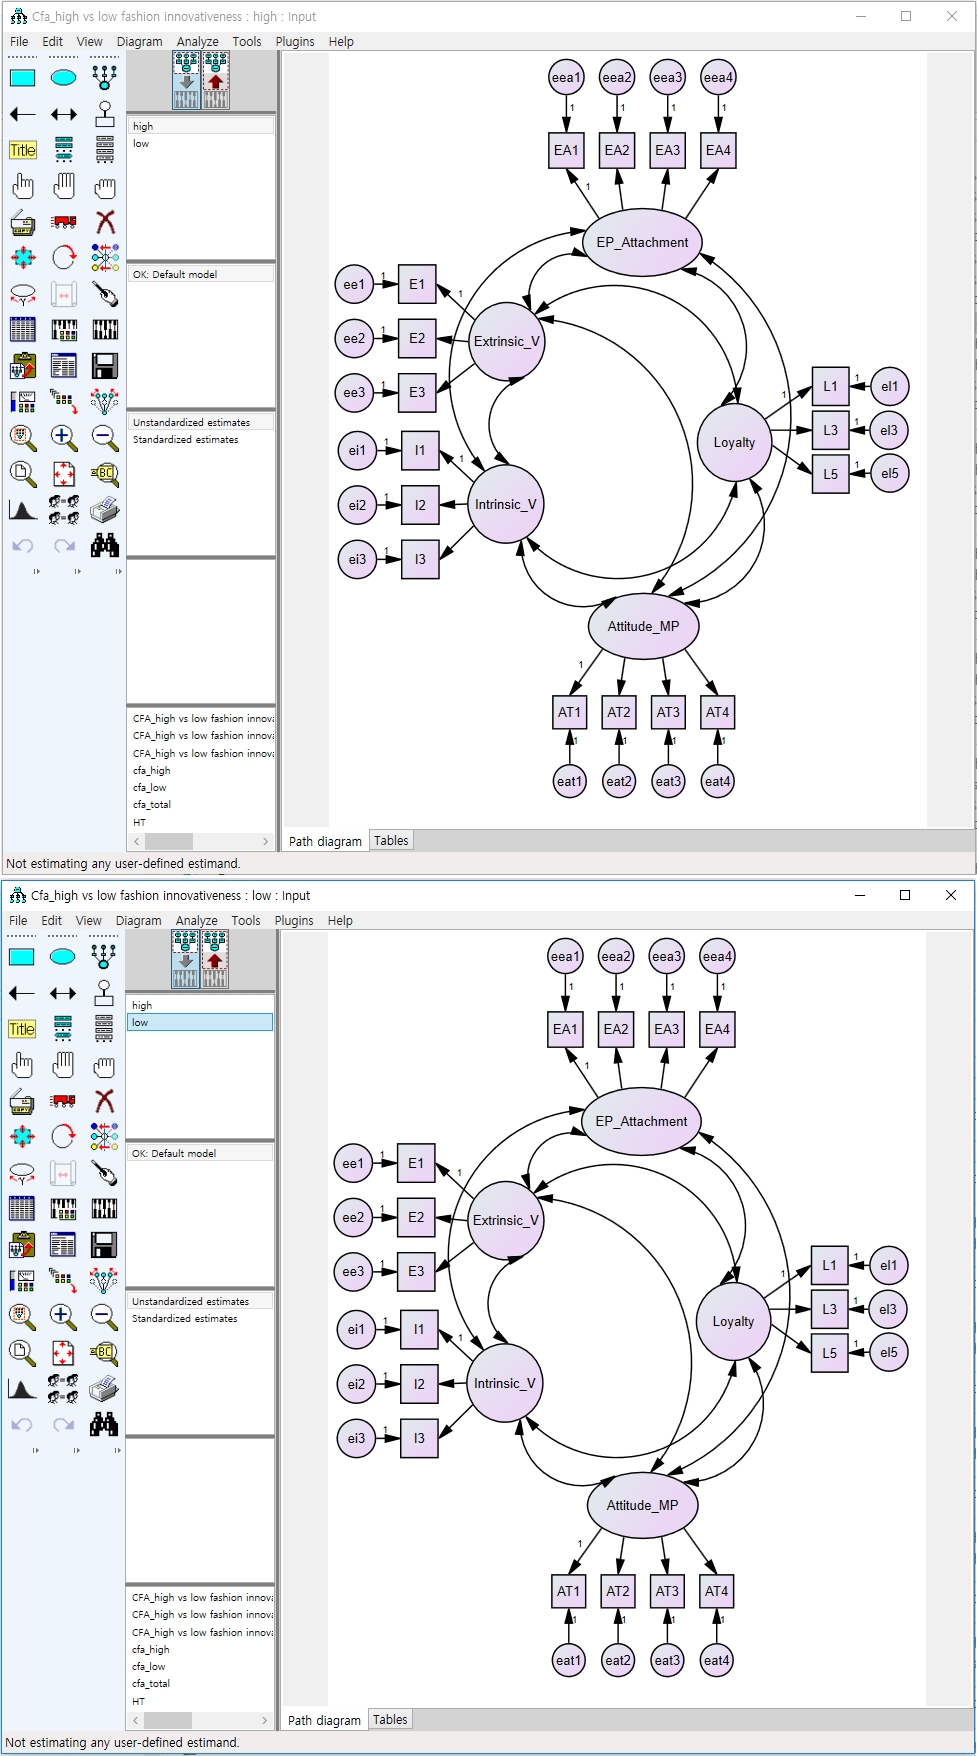
- Testing configural invariance
NOTE: If the structure of the measurement models in both groups have the same form (i.e., same dimensions and same patterns of fixed and non-fixed values), the configural invariance is satisfied (see Figure 11). If the fit of the measurement model is satisfactory, proceed to the next step for checking metric invariance26.- Perform the CFA with the previously proposed five-factor measurement model for each group. Click “Calculate estimates”. Check the “Estimates” and fit indices of both models. If the fit of both models is satisfactory and the factor coefficients are significant, proceed to the next step.
- Conduct MGCFA with the five-factor measurement model as a baseline model. Fix “1” for the factor coefficient from each latent variable to the first observed variable and let free the other factor coefficients. Click “Calculate estimates”.
- Check the “Estimates” of the two groups and fit indices of the model. If the fit of the model is satisfactory and the factor coefficients are significant, configural invariance is satisfied. Then, proceed to the next step involving the metric invariance test.

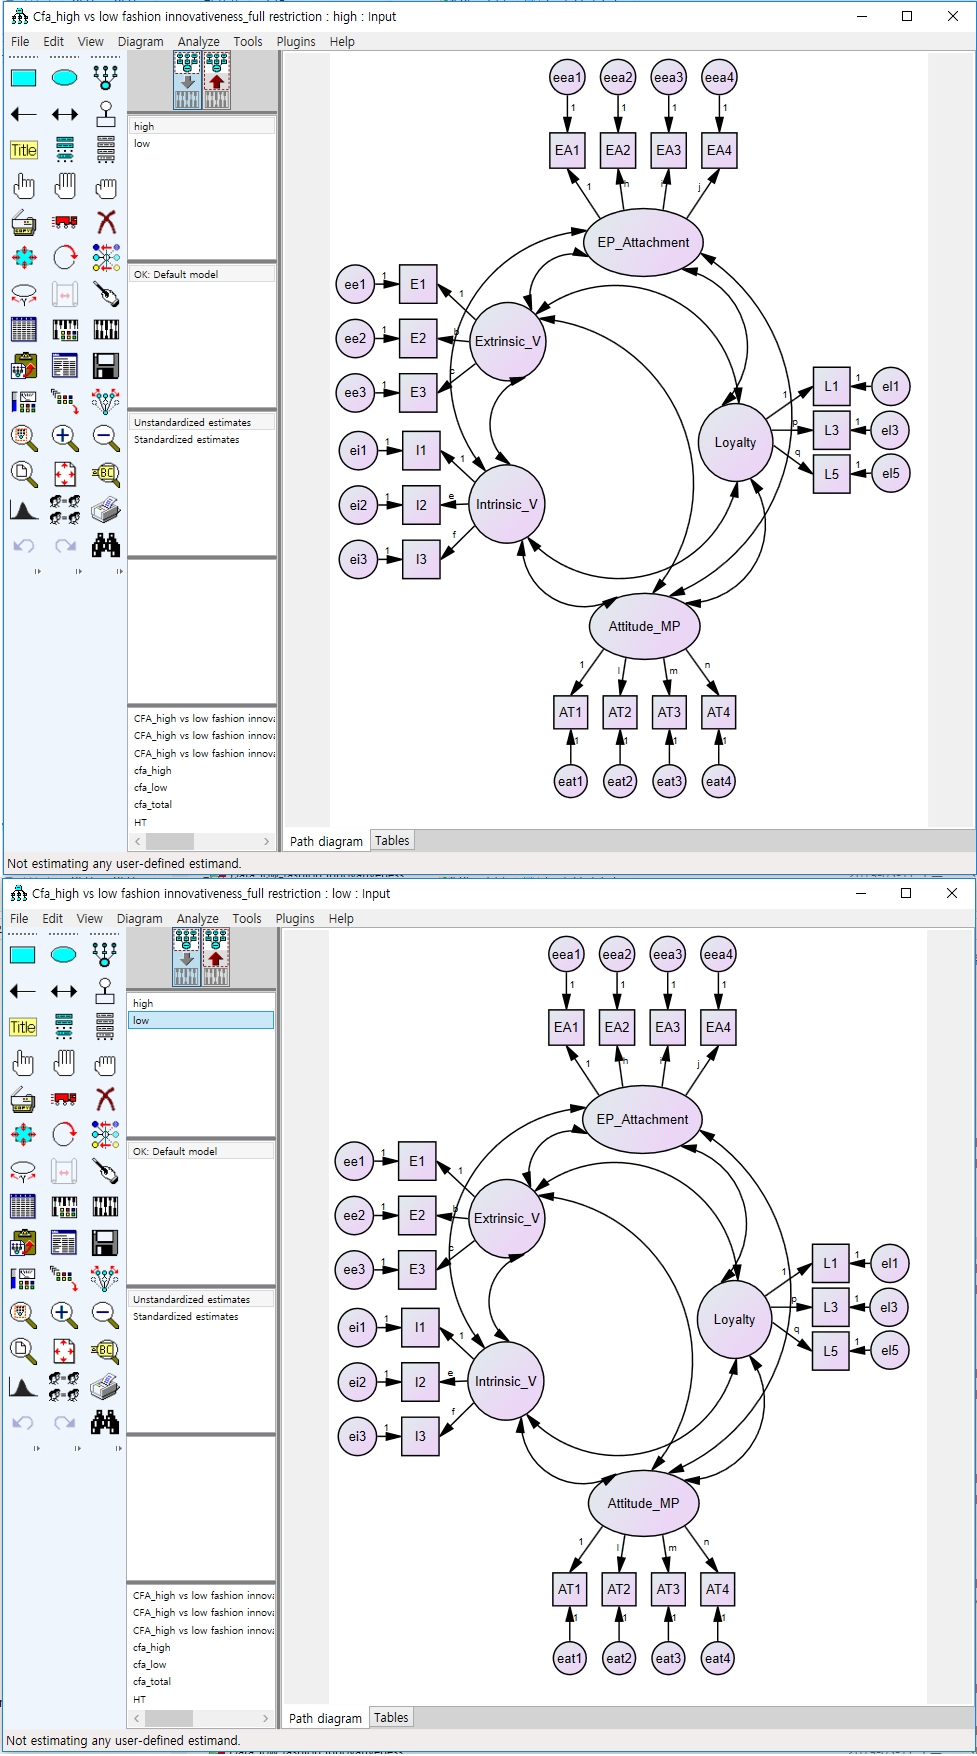
Figure 11: Equal dimensions and forms of the measurement models across two groups. (A) Model for the high fashion innovative group and (B) model for the low fashion innovative group. Please click here to view a larger version of this figure.
- Testing metric invariance
NOTE: The test of metric invariance evaluates whether the factor coefficients linking latent variables to observed variables are equal across groups.- For the test of metric invariance, fix the factor coefficients across groups. Enter the same name for the same coefficients across groups (e.g., “a” for Extrinsic_V | E2, “j” for EP_Attachment | EA4, see Figure 12). Click “Calculate estimates”. Check the “Estimates” of the two groups and fit indices of the model.
- Conduct a chi-square difference test by comparing the full metric invariance model (i.e., the model with fixed factor coefficients across groups) with the configural invariance model (i.e., the model with free factor coefficients across group). If the chi-square difference is non-significant, the metric invariance is satisfied. Then, proceed to the next step involving the scalar invariance test25,26,27.

Figure 12: Fixing the factor coefficients across groups. By entering same name for the same coefficients across groups, the factor coefficients were restrained. Please click here to view a larger version of this figure.
- Testing scalar invariance
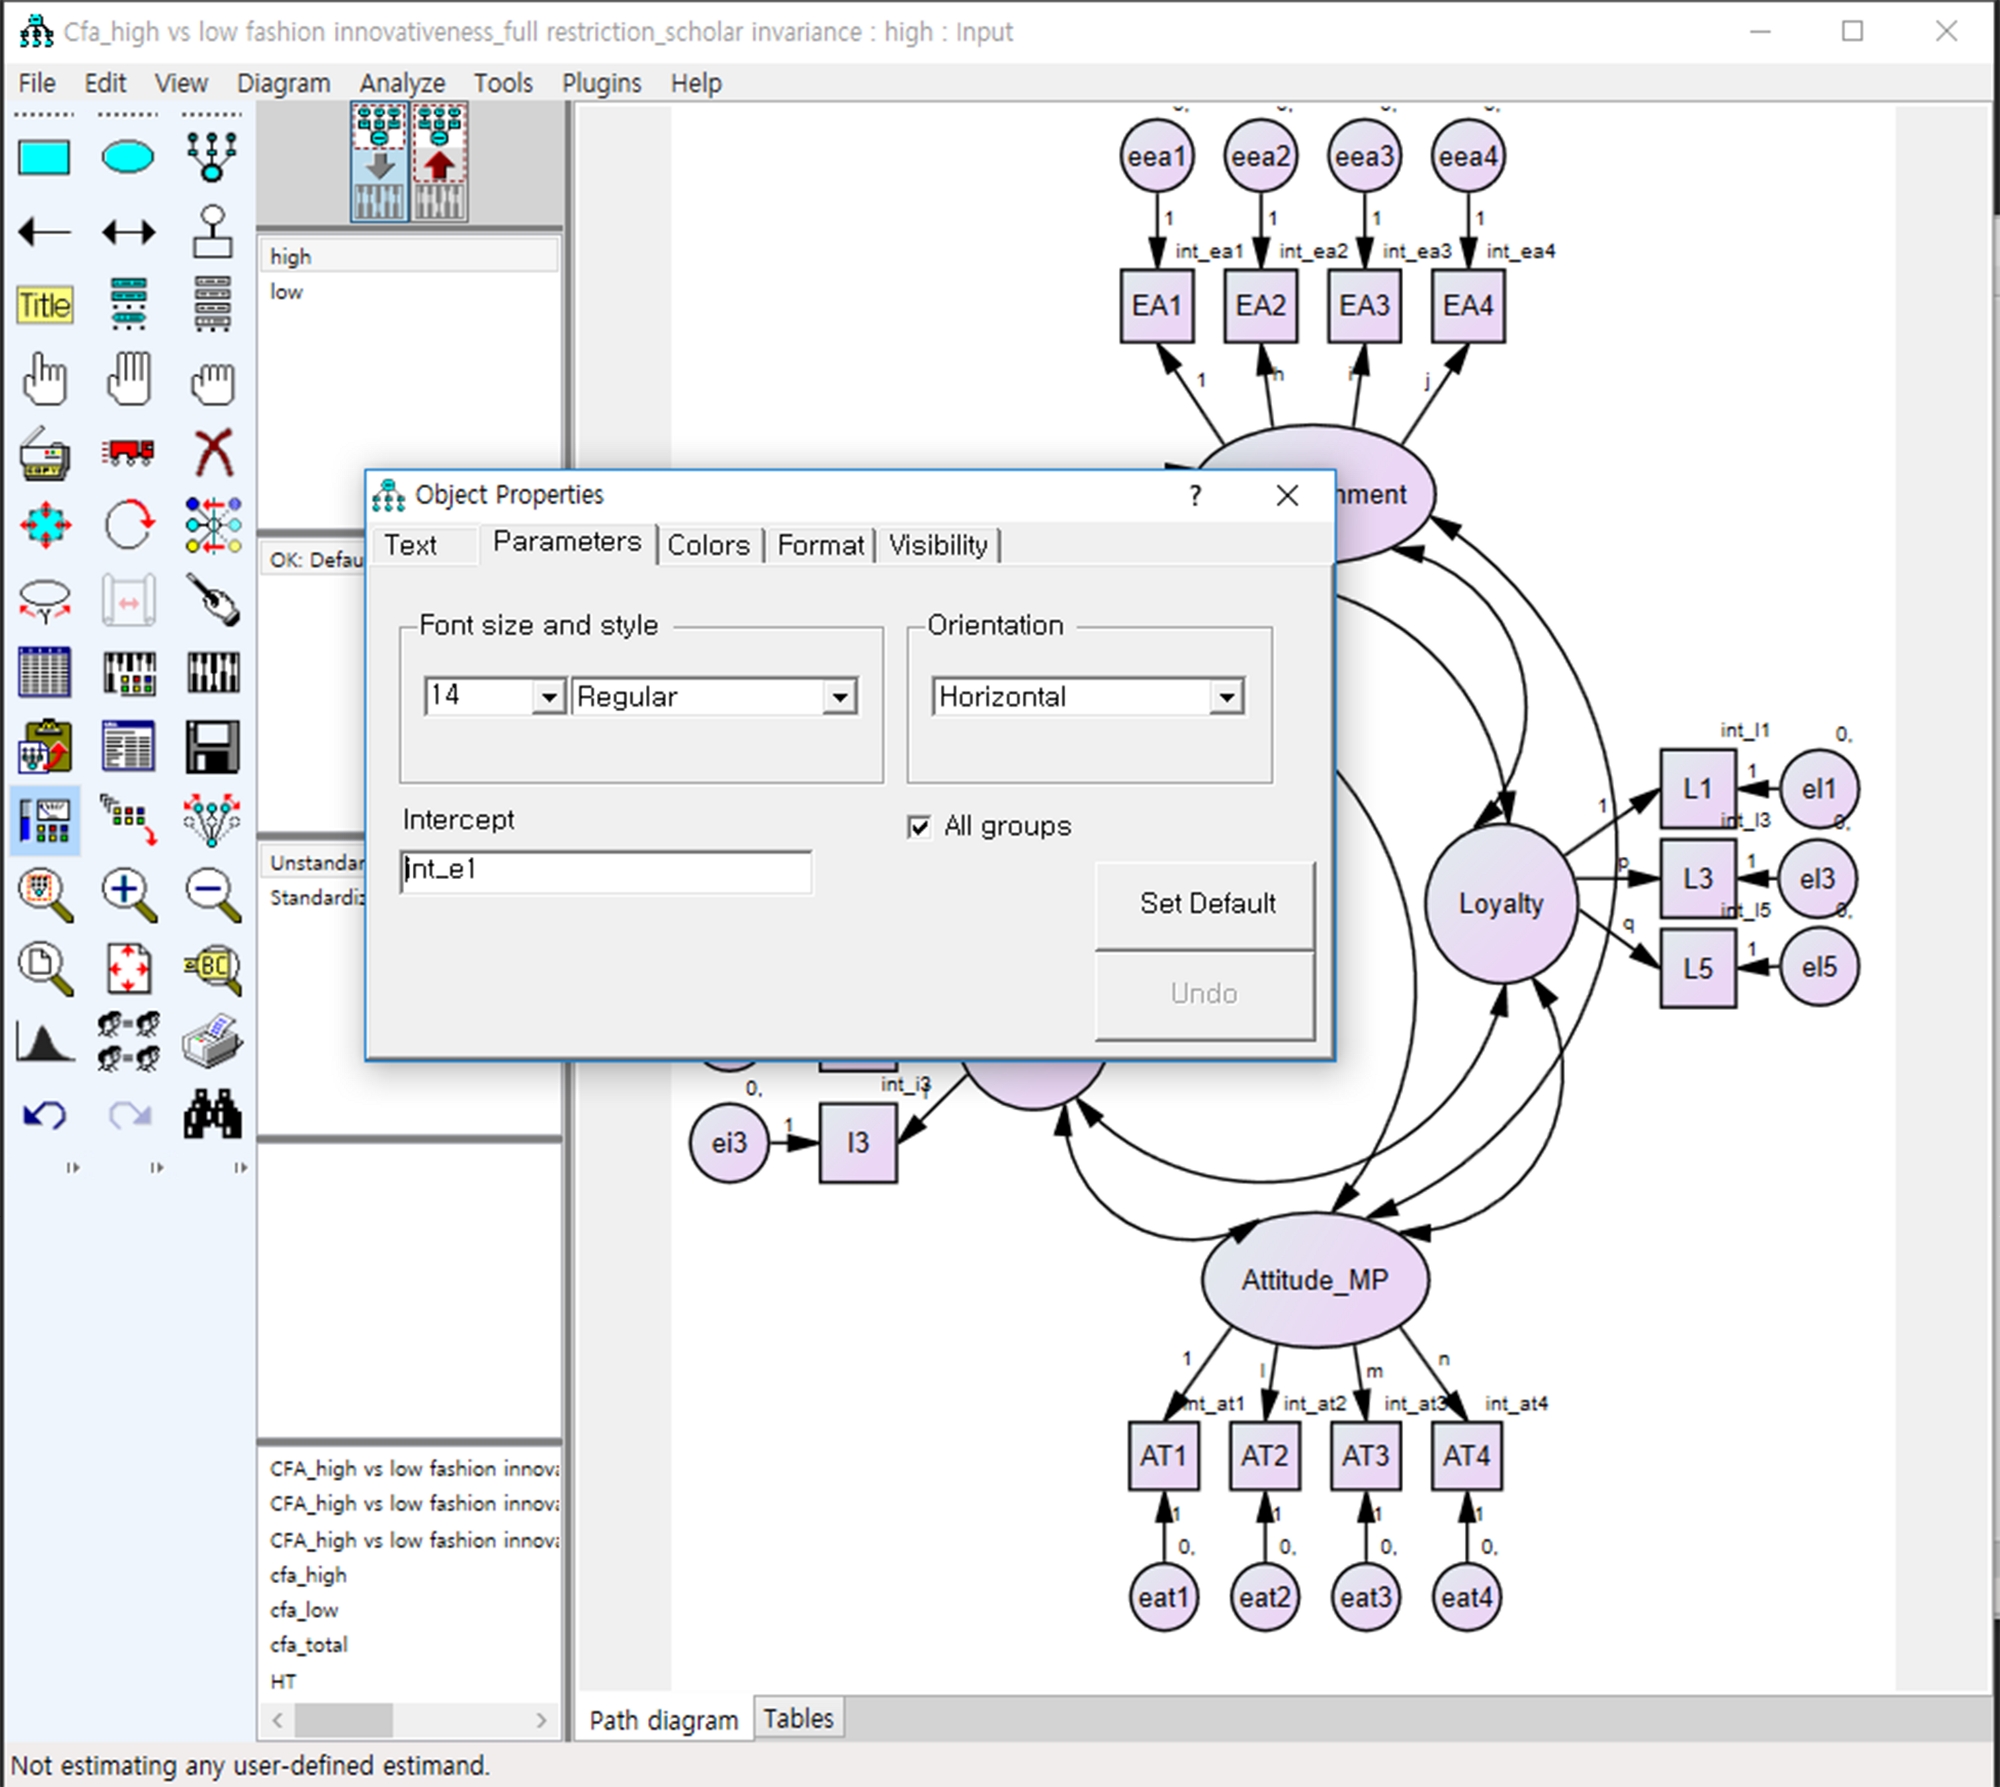
NOTE: Scalar invariance means that 1) the same values on the latent construct are associated with the same values on the observed variable and 2) the differences in the means of the observed variables are derived from the mean differences of the latent variables. To test scalar invariance, restrict the intercepts of observed variables so that they are equal across groups28.- Click “Analysis properties” under the “View” menu. Click the “Estimation” tab and check “Estimate means and intercepts”. Right-click each observed variable and choose “Object Properties”. Select the “Parameters” tab and enter the parameter names such as “int_e1” and “int_ea1” in the intercept text boxes (see Figure 13).
- Conduct a chi-square difference test by comparing the full metric/full scalar invariance model (i.e., the model with fixed intercepts of observed variables and fixed factor coefficients across groups) with the full metric invariance model (i.e., the model with fixed factor coefficients across group). If the chi-square difference is non-significant, the full metric/full scalar invariance is satisfied.
NOTE: Here, a specific hierarchy (configural invariance test, metric invariance test, scalar invariance test) is used. Once each invariance test is satisfied, conduct the LMA by using the finally selected model (i.e., the full metric/full scalar invariance model).

Figure 13: Entering parameter names in the intercept text box.
Please click here to view a larger version of this figure.
7. Running a LMA
- Conduct an LMA by utilizing the full scalar/full metric invariance model27,28. To compare the means of latent variables, fix the means of latent variables in one group and let them be free in the other group.
- Estimate the mean differences across groups by fixing one of means to zero for a reference group, then estimating the mean values for the other group. Thus, fix the means of all the latent variables in the low fashion innovative group at zero. It is important to ensure that the means of latent variables in the high fashion innovative group are free and their variances in both groups are free (see Figure 14).
- Click “Calculate estimates”. Check the “Estimates” of the two groups and fit indices of the model.
- Click “View text” and check the means of latent variables in the high fashion innovative group under “Estimates” (see Figure 15).

Figure 14: Setting the latent variable means and variances. (A) High fashion innovative group and (B) low fashion innovative group. Please click here to view a larger version of this figure.

Figure 15: Output for latent means analysis. Please click here to view a larger version of this figure.
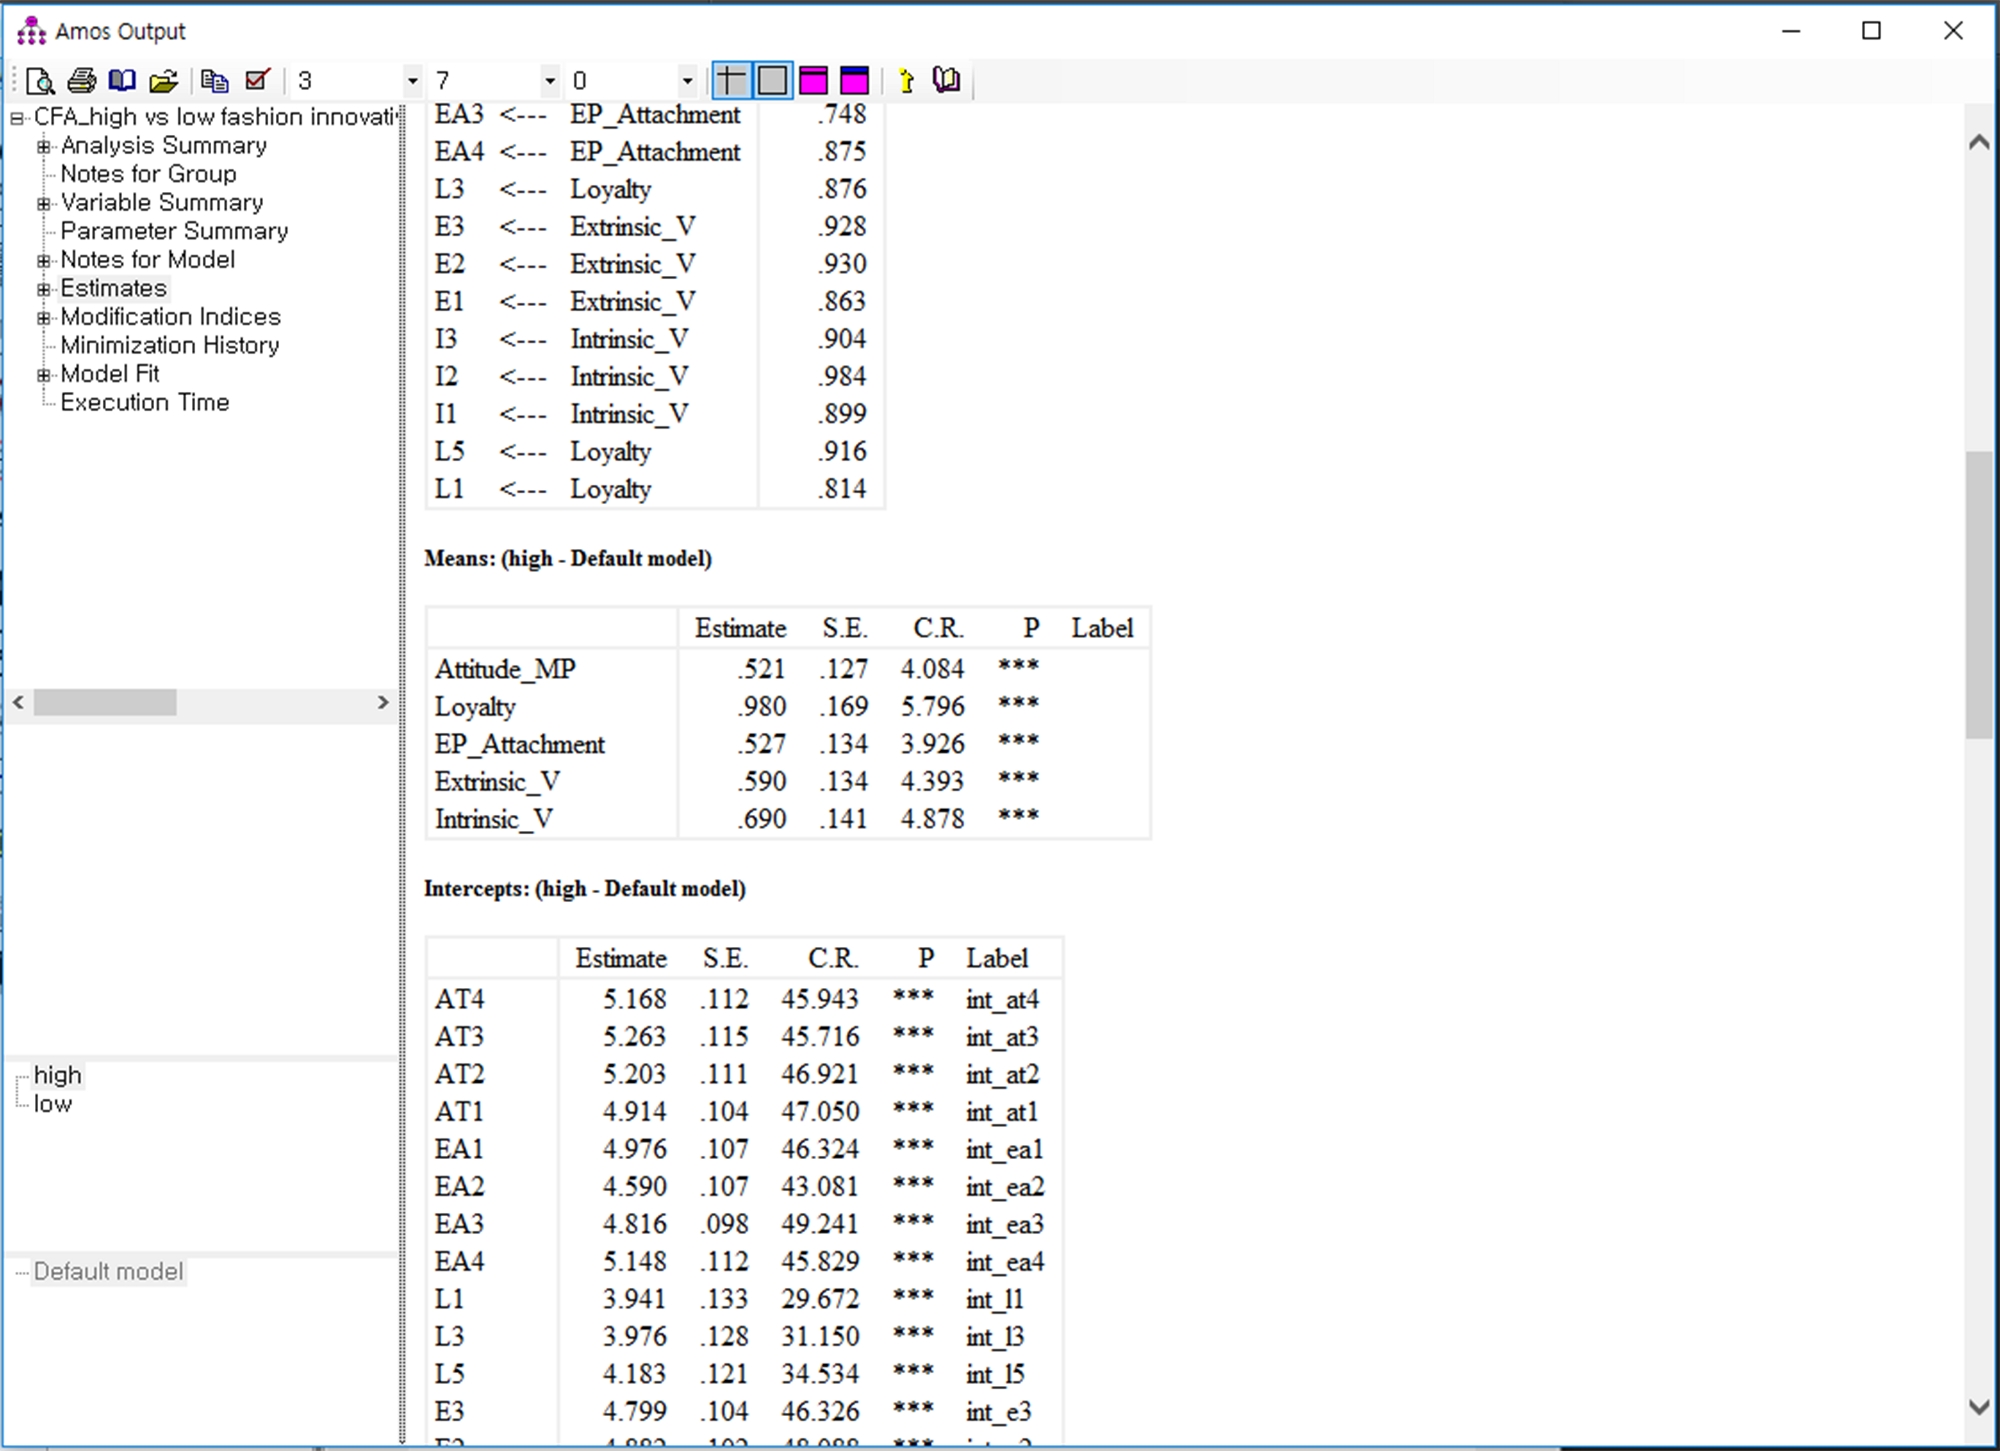
Access restricted. Please log in or start a trial to view this content.
Results
Frequency statistics offered characteristics of the sample. A total of 290 female online consumers completed the shopping process using the e-mass customization program. The demographic characteristics of the sample were evenly distributed. By age group, 23.1% were in their twenties, 28.3% in their thirties, 26.6% in their fourties, and 22.1% in their fifties. By marital status, 58.3% were married, while 40% were single. By occupation, 45.2% were office workers, 22.8% were housewives, 10.3% were professionals, 9.3% were ...
Access restricted. Please log in or start a trial to view this content.
Discussion
Implications of findings
The findings of this study reveal that consumers’ extrinsic and intrinsic benefits derived from creating a mass customized product help the growth of emotional attachment to the product, creation of positive attitudes toward the customization program, and increased loyalty intentions. The findings on the moderating effects of fashion innovativeness reveal that when compared to consumers in a low fashion innovativeness group, those in a high fashion innovativeness grou...
Access restricted. Please log in or start a trial to view this content.
Disclosures
The authors have nothing to disclose.
Acknowledgements
The data has been modified from Park and Yoo’s study29. This work was supported by the Ministry of Education of the Republic of Korea and the National Research Foundation of KOREA (NRF = 2016S1A5A2A03927809).
Access restricted. Please log in or start a trial to view this content.
Materials
| Name | Company | Catalog Number | Comments |
| SPSS AMOS 22 | IBM Corporation, Data Solution Inc. | used for confirmatory factor analyses, structural equation modeling analyses, and latent means analyses |
References
- Srinivasan, S. S., Anderson, R., Ponnavolu, K. Customer loyalty in e-commerce: an exploration of its antecedents and consequences. Journal of Retailing. 78 (1), 41-50 (2002).
- Mouw, R. Biggest challenges of mass customization and tips for addressing these challenges. Manufacturing Tomorrow. , Available from: http://www.manufacturingtomorrow.com/article/2016/05/biggest-challenges-of-mass-customization-and-tips-for-addressing-these-challenges-/8047 (2005).
- Fiore, A. M., Lee, S. E., Kunz, G. Individual differences, motivations, and willingness to use a mass customization option for fashion products. European Journal of Marketing. 38 (7), 835-849 (2004).
- Pine, B. J., Gilmore, J. H. The Experience Economy: Work is Theater and Every Business a Stage. , Harvard Business School Press. Boston, MA. (1999).
- Yoo, J., Park, M. The effects of e-mass customization on consumer perceived value, satisfaction, and loyalty toward luxury brands. Journal of Business Research. 69 (12), 5775-5784 (2016).
- Endo, S., Kincade, D. H. Mass customization for long-term relationship development: why consumers purchase mass customized products again. Qualitative Market Research: An International Journal. 11 (3), 275-294 (2008).
- Spiegel, E. How the U.S. can be a leader in the factory of the future. , Available from: http://blogs.wsj.com/experts/2015/06/04/how-the-u-s-can-be-a-leader-in-the-factory-of-the-future (2015).
- Franke, N., Piller, F. T. Value creation by toolkits for user innovation and design: the case of the watch market. The Journal of Product Innovation Management. 21 (6), 401-415 (2004).
- Lavidge, R. J., Steiner, G. A. A model for predictive measurements of advertising effectiveness. Journal of Marketing. 25, 59-62 (1961).
- Deci, E. L. Intrinsic Motivation. , Plenum Press. New York, NY. (1975).
- Kim, H. W., Chan, H. C., Gupta, S. Value-based adoption of mobile internet: an empirical investigation. Decision Support System. 43 (1), 111-126 (2007).
- Rogers, E. M. Diffusion of Innovations, 4th Edition. , The Free Press. New York, NY. (1995).
- Fiore, A. M., Lee, S. E., Kunz, G. Individual differences, motivations, and willingness to use a mass customization option for fashion products. European Journal of Marketing. 38 (7), 835-849 (2004).
- Franke, N., Piller, F. T. Key research issues in user interaction with configuration toolkits in a mass customization system. International Journal of Technology Management. 26 (5/6), 578-599 (2003).
- Grisaffe, D. B., Nguyen, H. P. Antecedents of emotional attachment to brands. Journal of Business Research. 64 (10), 1052-1059 (2011).
- Lee, M. Factors influencing the adoption of internet banking: an integration of TAM and TPB with perceived risk and perceived benefit. Electronic Commerce Research and Applications. 8 (3), 130-141 (2009).
- Pedeliento, G., Andreini, D., Bergamaschi, M., Salo, J. Brand and product attachment in an industrial context: the effects on brand loyalty. Industrial Marketing Management. 53, 194-206 (2016).
- Ilicic, J., Webster, C. M. Effects of multiple endorsements and consumer celebrity attachment on attitude and purchase intention. Australasian Marketing Journal. 19 (4), 230-237 (2011).
- Koo, G. Y., Hardin, R. Difference in interrelationship between spectators’ motives and behavioral intentions based on emotional attachment. Sport Marketing Quarterly. 17 (1), (2008).
- Kang, J. M., Kim, E. e-Mass customization apparel shopping: effects of desire for unique consumer products and perceived risk on purchase intentions. International Journal of Fashion Design, Technology and Education. 5 (2), 91-103 (2012).
- Kim, J. B., Rhee, D. The relationship between psychic distance and foreign direct investment decisions: a Korean study. International Journal of Management. 18 (3), 286-293 (2001).
- Simonson, I. Determinants of customers' responses to customized offers: conceptual framework and research propositions. Journal of Marketing. 69 (1), 32-45 (2005).
- Consumer behavior study reveals South Korean online shopping habits. FedEx. , Available from: http://about.van.fedex.com/newsroom/asia-english/consumer-behavior-study-reveals-south-korean-online-shopping-habits/ (2015).
- Iacobucci, D., Posavac, S. S., Kardes, F. R., Schneider, M. J., Popovich, D. L. Toward a more nuanced understanding of the statistical properties of a median split. Journal of Consumer Psychology. 25 (4), 652-665 (2015).
- Steenkamp, J. B. E. M., Baumgartner, H. Assessing measurement invariance in cross-national consumer research. Journal of Consumer Research. 25 (1), 78-90 (1998).
- Bollen, K. A. Structural Equation with Latent Variables. , Wiley. New York, NY. (1989).
- Sass, D. A. Testing measurement invariance and comparing latent factor means within a confirmatory factor analysis framework. Journal of Psychoeducational Assessment. 29 (4), 347-363 (2011).
- Hong, S., Malik, M. L., Lee, M. K. Testing configural, metric, scalar, and latent mean invariance across genders in sociotropy and autonomy using a non-western sample. Educational and Psychological Measurement. 63 (4), 636-654 (2003).
- Park, M., Yoo, J. Benefits of mass customized products: moderating role of product involvement and fashion innovativeness. Heliyon. 4, 00537(2018).
- Neuman, W. L. Social Research Methods: Qualitative and Quantitative Approaches, 6th Edition. , Allyn and Bacon. Boston, MA. (2006).
- Kim, J. H., Jang, S. A scenario-based experiment and a field study: a comparative examination for service failure and recovery. International Journal of Hospitality Management. 41, 125-132 (2014).
- Hancock, G. R., Lawrence, F. R., Nevitt, J. Type I error and power of latent mean methods and MANOVA in factorial invariant and noninvariant latent variable systems. Structural Equation Modeling. 7 (4), 534-556 (2000).
Access restricted. Please log in or start a trial to view this content.
Reprints and Permissions
Request permission to reuse the text or figures of this JoVE article
Request PermissionExplore More Articles
This article has been published
Video Coming Soon
Copyright © 2025 MyJoVE Corporation. All rights reserved