
A subscription to JoVE is required to view this content. Sign in or start your free trial.
Method Article
Experimental Quantification of Interactions Between Drug Delivery Systems and Cells In Vitro: A Guide for Preclinical Nanomedicine Evaluation
In This Article
Summary
A workflow is demonstrated for the absolute quantification of drug carrier-cell interactions using flow cytometry to allow better rational evaluation of novel drug delivery systems. This workflow is applicable to drug carriers of any type.
Abstract
A major component of designing drug delivery systems concerns how to amplify or attenuate interactions with specific cell types. For instance, a chemotherapeutic might be functionalized with an antibody to enhance binding to cancer cells ("targeting") or functionalized with polyethylene glycol to help evade immune cell recognition ("stealth"). Even at a cellular level, optimizing the binding and uptake of a drug carrier is a complex biological design problem. Thus, it is valuable to separate how strongly a new carrier interacts with a cell from the functional efficacy of a carrier's cargo once delivered to that cell.
To continue the chemotherapeutic example, "how well it binds to a cancer cell" is a separate problem from "how well it kills a cancer cell". Quantitative in vitro assays for the latter are well established and usually rely on measuring viability. However, most published research on cell-carrier interactions is qualitative or semiquantitative. Generally, these measurements rely on fluorescent labeling of the carrier and, consequently, report interactions with cells in relative or arbitrary units. However, this work can be standardized and be made absolutely quantitative with a small number of characterization experiments. Such absolute quantification is valuable, as it facilitates rational, inter- and intra-class comparisons of various drug delivery systems-nanoparticles, microparticles, viruses, antibody-drug conjugates, engineered therapeutic cells, or extracellular vesicles.
Furthermore, quantification is a prerequisite for subsequent meta-analyses or in silico modeling approaches. In this article, video guides, as well as a decision tree for how to achieve in vitro quantification for carrier drug delivery systems, are presented, which take into account differences in carrier size and labeling modality. Additionally, further considerations for the quantitative assessment of advanced drug delivery systems are discussed. This is intended to serve as a valuable resource to improve rational evaluation and design for the next generation of medicine.
Introduction
The design of drug delivery constructs that exhibit specific, designed behavior depending on what cell type they encounter has attracted substantial research interest. Potential drug delivery constructs or "carriers" include lipid formulations, nano-grown inorganics, polymeric assemblies, extracellular vesicles, functionalized bacterial cells, or modified viruses. All of these can exhibit organ, tissue, or cell specificity due to physical properties, surface properties, or engineered chemical functionalizations such as antibody attachment1,2.
A nearly ubiquitous step in in vitro carrier evaluation is to incubate cells with a suspension containing said drug-loaded carrier. Post incubation, carrier performance is measured via a functional readout of the drug cargo's performance, for example, transfection efficiency or toxicity. Functional readouts are useful, as they are a downstream measure of carrier effectiveness. However, for more complex drug delivery constructs, it is increasingly important to move beyond functional readouts and separately quantify the degree of carrier interaction with the cell of interest. There are a few reasons for this.
First, there is increasing interest in discovering (and iteratively improving) "platform" carrier technologies, which can carry a variety of cargo. For example, lipid nanoparticles (LNPs) designed to encapsulate RNA can exchange one RNA sequence for another with few caveats3. Thus, to iteratively improve the carrier technology, it is critical to quantify its performance independent of the cargo functionality. Second, functional readouts may not be straightforward for the cargo of interest, compromising the ability to rapidly iterate and evaluate carrier formulations. While one could perform in vitro optimization using a model cargo with a straightforward functional readout (for instance, fluorescence), changing the cargo can change the biological response to a carrier4 and may, thus, not yield representative results. Third, many carriers are designed to interact with and be taken up by a specific cell type. Such targeting capability of a carrier can and should be differentiated from the performance of its therapeutic cargo post targeting. To continue the LNP example, an RNA cargo might be extremely potent, but if the LNP is unable to bind to the cell, be internalized, and release the RNA, no downstream functional effect will be observed. This can be an issue particularly for carriers intended to target hard-to-transfect cell types, such as T cells5. Conversely, an LNP could target extremely effectively, but the RNA cargo might not function. A downstream assay that just measures cargo functionality will be unable to differentiate between these two situations, thus complicating the development and optimization of carrier drug delivery systems.
In this work, how to absolutely quantify carrier association is discussed. Association is a term that refers to the experimentally measured degree of interaction between a carrier and a cell. Association does not differentiate between membrane binding and internalization-a carrier may be associated because it is bound to the cell surface or because the cell has internalized it. Association is commonly measured as part of cell-carrier incubation experiments. Historically, association has been reported either in arbitrary fluorescent units (typically "median fluorescence intensity" or MFI) or as "percent association," metrics whose limitations have been previously discussed6. In short, these measurements are not comparable between experiments, laboratories, and drug carriers due to differences in experimental protocols, flow cytometer settings, and the labeling intensities of different carriers. Efforts have been made to overcome the former by calibrating the cytometer, thereby converting the relative measure of MFI into an absolutely quantitative measure of fluorescence7. However, this method does not account for the variability in the labeling intensity of various carriers and, thus, does not allow the rational comparison of various carrier performances in a target cell of choice8.
Here, how to practically convert from relative, arbitrary fluorescent units to the absolute quantitative metric of the "number of carriers per cell" is demonstrated by performing a small number of additional characterization experiments. If another metric of carrier concentration is desired (e.g., carrier mass per cell or carrier volume per cell), it is straightforward to convert from carriers per cell, provided carrier characterization has been done. For brevity and to avoid jargon, the word "carrier" is used within this work to refer to the vast assortment of drug delivery constructs. These quantification techniques are equally applicable, whether applied to a nano-engineered gold particle or a bio-engineered bacteria.
A few facts enable the conversion from arbitrary fluorescent units to carriers per cell. First, the measured fluorescence intensity is proportional to the concentration of a fluorophore9 (or a fluorescently labeled carrier), assuming the fluorescence is within the detection limits of the instrument and the instrumentation settings are the same. Thus, if the fluorescence of a carrier and the fluorescence of a sample are known, one can determine how many carriers are present in that sample if all the measurements were performed under the same settings and conditions. However, especially for smaller carriers, it may not be possible to measure carrier fluorescence, cell autofluorescence, and cell-associated-with-carriers fluorescence on the same instrument with the same settings. In this case, there is a second requirement to make it possible to convert between measured fluorescence on one instrument and measured fluorescence on another. To do so, a standard curve of fluorophore concentration can be established to measure the fluorescence intensity on both instruments, taking advantage of the Molecules of Equivalent Soluble Fluorochrome (MESF) standard9. This then allows measurement of the carrier fluorescence in bulk on a non-cytometer, a measurement that can be done on carriers of any size or characteristic. When such bulk quantification is done on a carrier suspension of known concentration, the number of carriers per cell of a sample can, once again, be calculated.
While this work demonstrates the process for measuring carrier association (as determined by measured fluorescence intensity), an analogous protocol could be performed for other measures of cell-carrier interaction (e.g., an experimental protocol that differentiates internalized and membrane-bound carriers). Additionally, this protocol would be largely the same if association was measured through a non-fluorescent assay (for instance, through mass cytometry).
Protocol
1. Choosing the appropriate stream
- Follow the decision tree outlined in Figure 1 to determine the best workflow (stream) (Figure 2) for the experimental setup used. Refer to the discussion for further comments on this choice of stream.
- If following the Cytometer Stream, continue with steps 2.1.1-2.2.7. If following the Bulk Stream, continue with steps 3.1.1.1-3.1.5.7.

Figure 1: Workstream decision tree. The decision as to which Stream to use depends primarily on the carrier type of interest. Larger carriers and carriers with high scattering properties can more easily be detected individually on cytometers, thus making them suitable for quantification using the Cytometer Stream. The Bulk Stream is suitable for all other carrier types. Please click here to view a larger version of this figure.

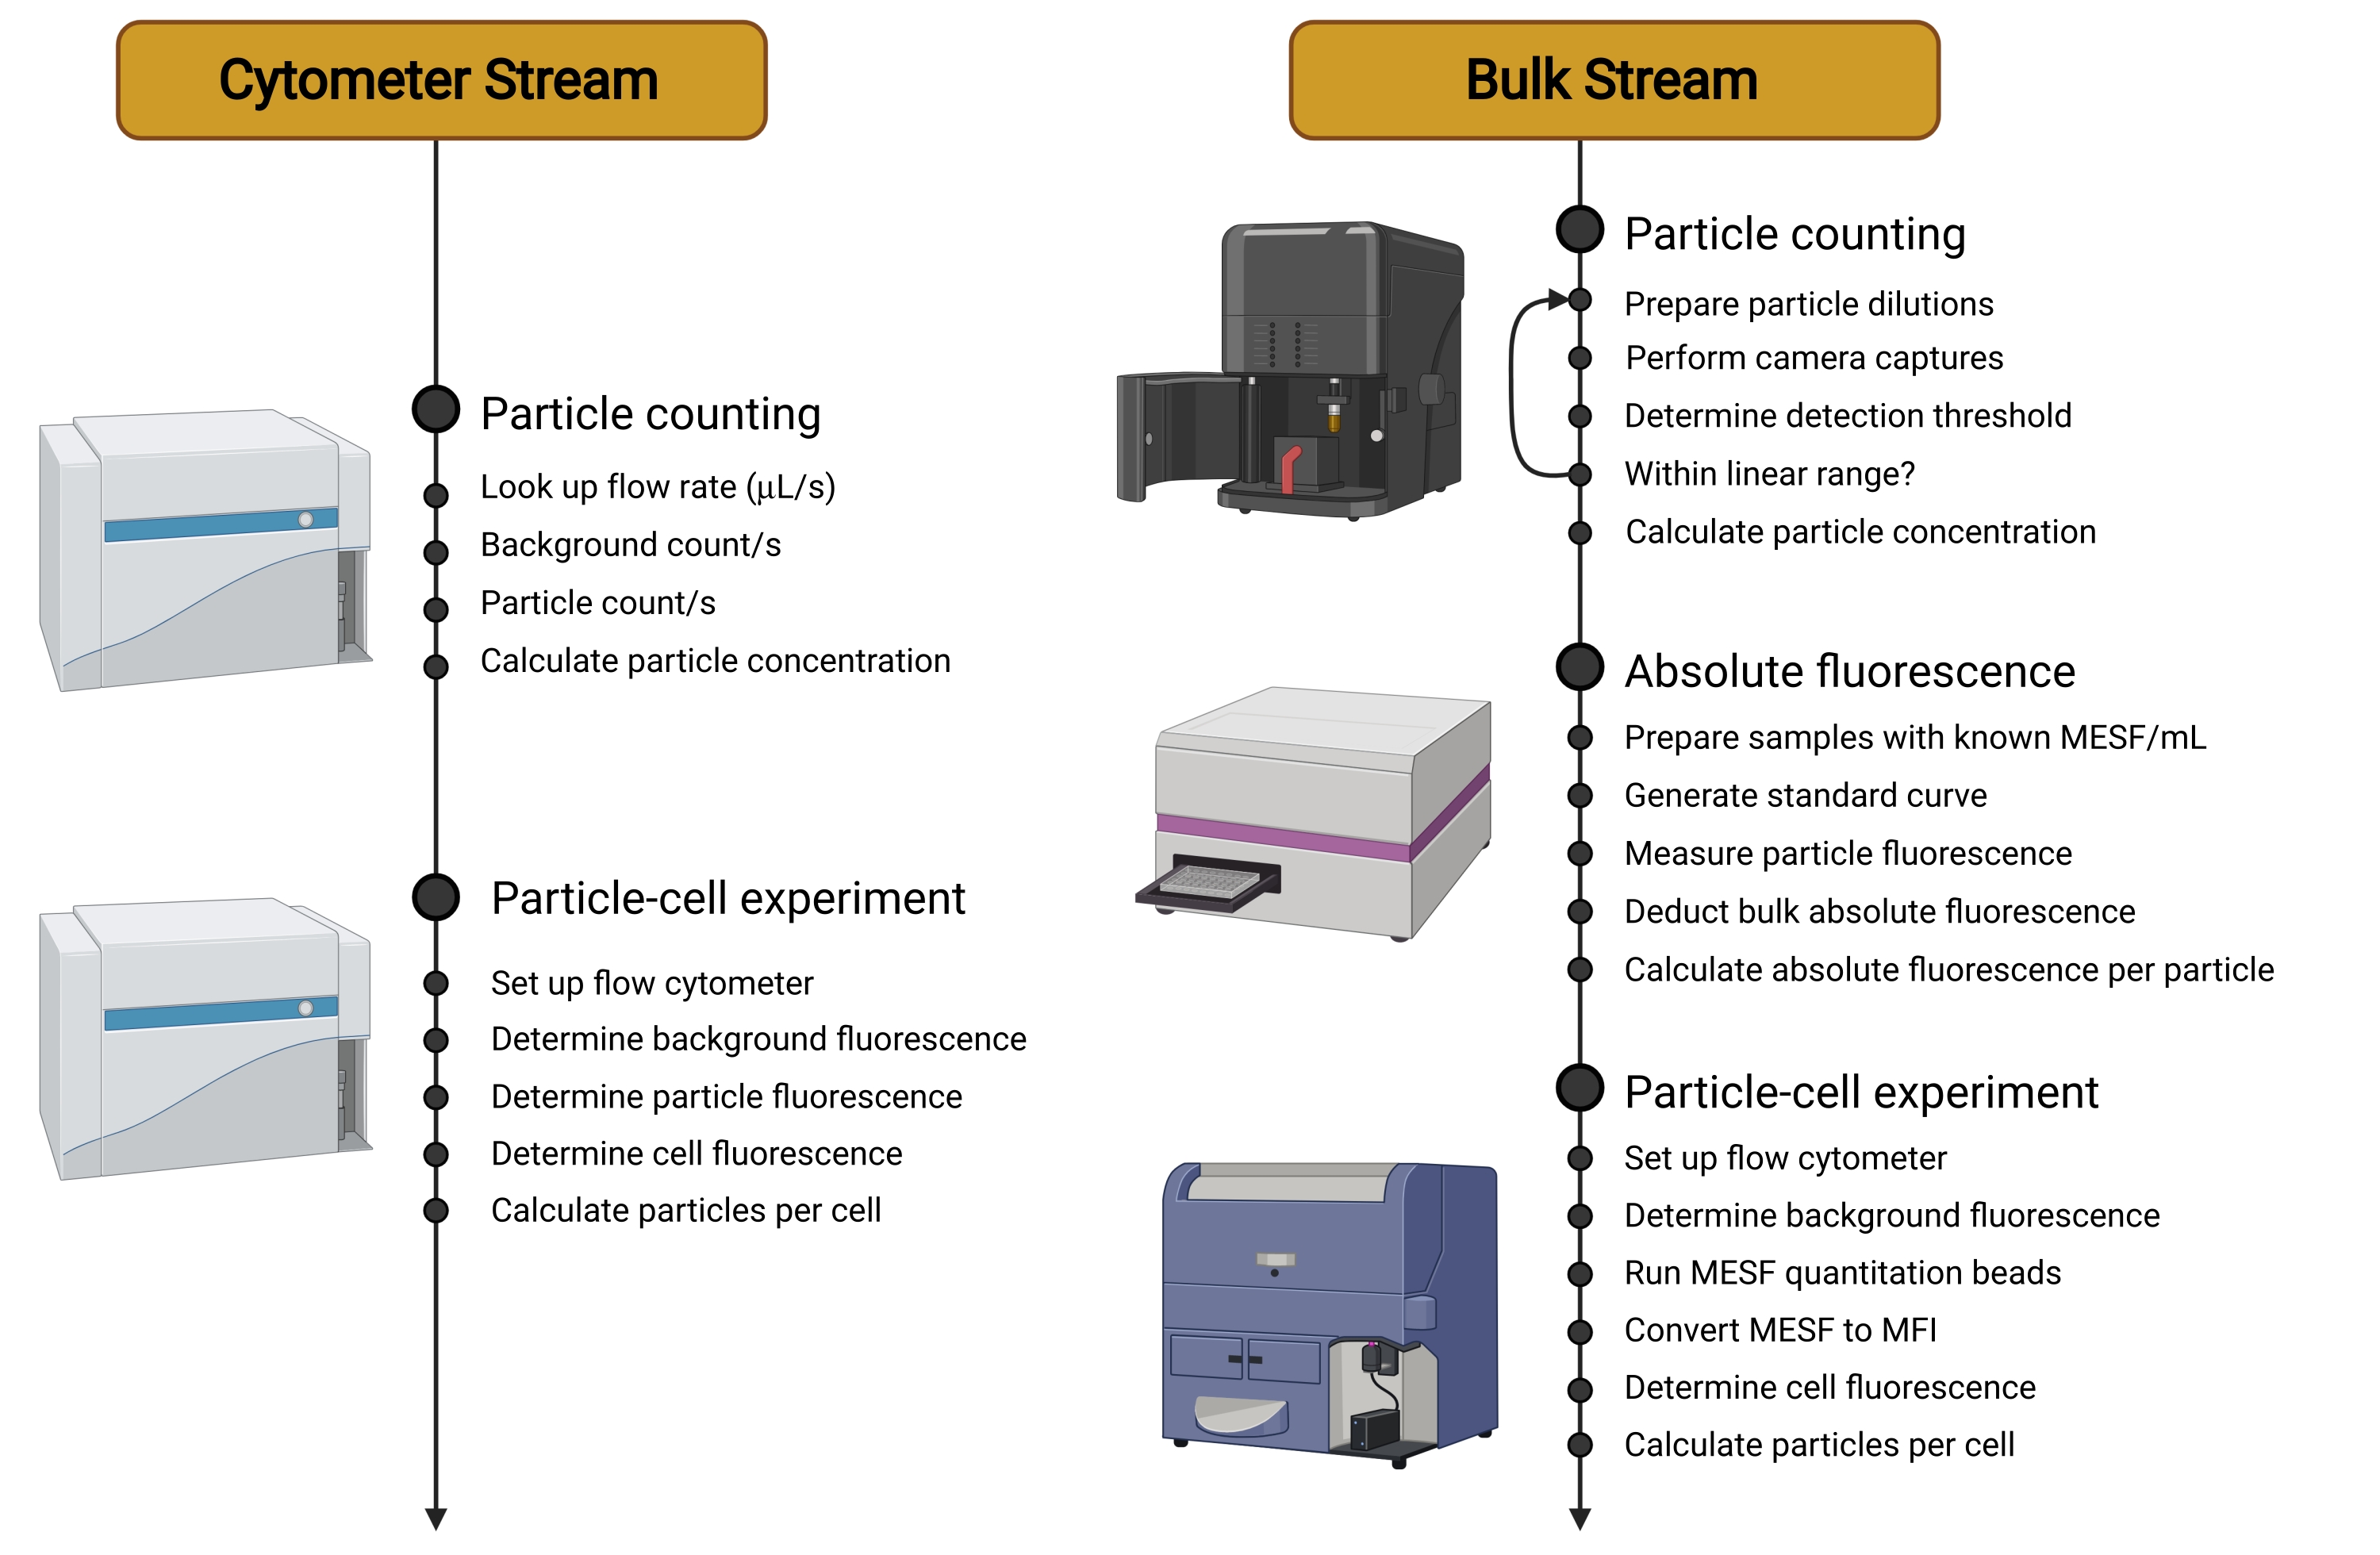
Figure 2: Overview of workstreams. This protocol is split into two different Streams. The Cytometer Stream uses a sensitive cytometer to count the carriers in suspension, measure their individual fluorescence, and then determine the fluorescence of cells incubated with carriers. The Bulk Stream uses non-cytometry-based techniques, such as Nanoparticle Tracking Analysis, to count the carriers in suspension. The individual carrier fluorescence is then quantified using a microplate reader or spectrofluorometer. The use of the flow cytometer is, therefore, restricted to measuring the final fluorescence of cells incubated with carriers, a measurement that can be done on a wider range of cytometers and that is independent of the carrier type used. Abbreviations: MESF = Molecules of Equivalent Soluble Fluorochrome; MFI = median fluorescence intensity. Please click here to view a larger version of this figure.
2. The Cytometer Stream
- Carrier counting
NOTE: Any flow cytometer can be used for this measurement, provided the flow rate (µL/s) is known. If the flow rate is unknown and cannot be determined, do not proceed with this step. Instead, proceed with step 3.1. Counting the carriers in suspension allows accurate and reproducible determination of the number of carriers incubated in each cell experiment.- Set up the cytometer to detect carriers, both by an optical scattering channel (typically side scatter [SSC]) and fluorescence. Make sure to adjust the threshold to allow detection of the carriers.
NOTE: Iteration through different optical scattering channels may be required if SSC does not provide a clear signal (e.g., forward scatter [FSC]). - Run a diluent-only sample to quantify the background event count in both the SSC and fluorescent channels.
NOTE: Ideal background event counts are <100 events/s. - Prepare the carriers for flow cytometry.
- Ensure the carriers are well suspended by vortexing or sonication, depending on the carrier system involved.
- If possible, ensure the carrier concentration is between 1,000 carriers/µL and 10,000 carriers/µL. An event count of one to two orders of magnitude higher than the background is a good start. If the order of magnitude of the carrier concentration is unknown, a good start is to prepare a 1:1,000 dilution from stock. Use the initial results as feedback to inform future sample dilutions.
NOTE: A cloudy suspension is generally too concentrated.
- Load the first carrier sample onto the cytometer and start recording.
- Compare event counts resulting from both the SSC and fluorescence channels; these should be approximately equal (<10% difference). If not, check the cytometer settings, e.g., photomultiplier tube (PMT) settings and laser intensity for the fluorescent channel. Alternatively, use other methods such as confocal microscopy to validate that the fluorescent labeling of the carriers is present and uniform.
- Repeat steps 2.1.3-2.1.5 two or more additional times with different dilutions from the stock. Ensure that the event count in each sample is at least one order of magnitude higher than the background event count.
- Verify that three or more samples show a linear trend, that is, a two-fold sample dilution should result in a corresponding two-fold reduction in the measured carrier concentration.
- Use the samples within the linear range, corresponding dilution factors, and the known cytometer flow rate to calculate the stock carrier concentration according to equation (1):
 (1)
(1)
where C is the stock carrier concentration in carriers/mL. It is recommended to use the event count derived from optical scattering detection rather than fluorescence.
- Set up the cytometer to detect carriers, both by an optical scattering channel (typically side scatter [SSC]) and fluorescence. Make sure to adjust the threshold to allow detection of the carriers.
- Flow cytometry readout of the carrier-cell experiment, including determination of fluorescence intensity per carrier
NOTE: Ideally, the fluorescent intensity per carrier will be determined as close as possible to the carrier-cell experiment. This is to ensure that the MFIs obtained for individual carriers can directly be compared to the MFIs of cells associated with the carriers. In practice, a cytometer will usually generate similar results when used on consecutive days using the same PMT voltages, but this cannot be guaranteed.- Design the carrier-cell experiment. Use the carrier concentration determined in step 2.1 to administer the desired dose of carriers.
- Set up the flow cytometer for the final carrier-cell experiment by determining optimal PMT voltage settings in the relevant channels. Set the thresholds to allow carrier detection.
- Run the carriers in suspension to determine the fluorescence intensity per carrier under the current PMT settings.
- If needed, change the cytometer thresholds to detect the cells and not the carriers.
- Run a negative control sample-cells not incubated with carriers-to determine the background fluorescence (autofluorescence) of the cells.
- Run the carrier-cell samples to determine the fluorescence intensity per cell. This fluorescence is a linear combination of cellular autofluorescence and the presence of fluorescent carriers.
- Calculate the number of carriers per cell using the following equation (2):
 (2)
(2)
where Passoc is the number of carriers associated per cell, FIcell is the MFI of cells incubated with carriers, FIbackground is the MFI of cells not incubated with carriers, and FIcarrier is the MFI of carriers in suspension.
3. The Bulk Stream
- Carrier counting: nanoparticle tracking analysis
NOTE: In the Bulk Stream, carrier counting is a necessary step to quantify the absolute fluorescence intensity per carrier (see step 3.1.4). In addition, counting the carriers in suspension allows the accurate and reproducible determination of the number of carriers incubated in each cell experiment.- Preparation
- Mount the flow cell onto the laser module and lock the entire laser module in place inside the instrument.
- Slowly (not faster than 0.1 mL/s) flush the flow cell with ~1 mL of distilled water. If bubbles form within the flow cell, retract the suspension partially to merge the bubble with the air-liquid interface before proceeding.
- Start the camera roughly halfway through flushing; be sure to confirm that carrier debris is washed out. Select Capture to open the Capture Settings tab and click Start Camera.
- Dry the system with 1 mL of air. If any static carriers are visible on the screen, clean the flow cell according to the manufacturer's instructions.
- Prepare the carriers for Nanoparticle Tracking Analysis by ensuring the carriers are well suspended via vortexing or sonication, depending on the carrier system involved. If the order of magnitude of the stock concentration is unknown, prepare a 1:100 dilution from the stock and use the initial results as feedback to inform future sample dilutions. Dilute the carriers in water and not phosphate-buffered saline (PBS) to prepare at least ~0.6-1 mL of each sample with a carrier concentration between 1 × 10⁷ carriers/mL and 1 × 10⁹ carriers/mL.
NOTE: A cloudy suspension is generally too concentrated. Buffers and salts can generate high background noise.
- Measurement
- Take out the laser module and place it upright.
- Draw up the first carrier sample into a 1 mL syringe. Attach the syringe to the tube inlet and carefully load the sample into the flow cell. If bubbles form within the flow cell, retract the suspension partially to merge the bubble with the air-liquid interface before proceeding. Ensure the entire flow cell is filled with liquid, then pause.
- Adjust the camera focus if needed to visualize individual carriers. Make coarse focus adjustments with the rotating knob on the right-hand side of the instrument. Make finer adjustments by selecting the Hardware tab | Pumps/Stage. Change the focus by adjusting the Focus slider.
- Adjust the camera level to make sure there is no oversaturation. Within the Capture tab, select the optimal Camera Level by adjusting the slider.
- If the instrument is equipped with this accessory, load the syringe containing the carrier sample into the Syringe Pump to ensure continuous sample flow during measurements.
- Under the SOP tab, select Standard Measurement to take five captures of 30 s each. Enter Base filename and, if desired, add additional sample information by clicking the Advanced button (which opens a modal dialogue with a variety of choices).
NOTE: If a dilution factor is entered, the final carrier concentration measurement will be adjusted automatically by the software. Entering this factor is advised against. Instead, perform the adjustment manually, which facilitates the analysis and allows the assessment of whether each dilution falls within the dynamic range of the instrument (step 3.1.3.4). - Press Create and Run Script and wait for a pop-up to appear asking to Please advance sample.
- If using the Syringe Pump, select the Hardware tab | Syringe Pump tab | set the Infusion Rate at 30-80 and press Infuse. If not using the Syringe Pump, manually advance the sample.
- In the pop-up window, select OK to start capturing. After each of the five captures, when the Please advance sample pop-up reappears, check that the sample is still moving through the flow cell, either manually or via the Syringe Pump. Then, select OK to proceed with the next capture.
NOTE: After five captures, the software automatically opens the Process tab and opens a pop-up asking to adjust the process settings.
- Analysis
- In the Process tab, adjust the Detection Threshold slider (between 4 and 8) to correctly identify distinct carriers visible on the screen. Adjust the Screen Gain too to aid visualization; it will not affect the downstream analysis. Use the slider under the capture screen to scroll through multiple frames of the video to aid detection threshold setting.
NOTE: The detection threshold should be set once and, subsequently, should not be altered between measurements or samples. - In the pop-up (note after step 3.1.2.9), press OK to initiate tracking analysis. Monitor the progress of the analysis by clicking on the Analysis tab | Single Analysis tab.
- Once the analysis is finished, look for an Export Settings prompt to appear, in which Include PDF and Include Experiment Summary should be selected by default. Select any other export formats as desired.
- In the Results section of the PDF data export, to ensure the concentration measured is reliable, verify that the measured carrier concentration is between 1 × 10⁷ carriers/mL and 1 × 10⁹ carriers/mL-the dynamic range of the instrument-and check for any error messages or messages of caution underneath the concentration measurement result.
- Repeat steps 3.1.2.1-3.1.3.4 two or more times with different dilutions from the stock. Ensure that the concentration of each sample falls within the linear range of the instrument.
- Select three or more samples that show a linear trend, that is, a two-fold sample dilution should result in a corresponding two-fold reduction in the measured carrier concentration. Use the selected samples and corresponding dilution factors to calculate the stock carrier concentration.
- In the Process tab, adjust the Detection Threshold slider (between 4 and 8) to correctly identify distinct carriers visible on the screen. Adjust the Screen Gain too to aid visualization; it will not affect the downstream analysis. Use the slider under the capture screen to scroll through multiple frames of the video to aid detection threshold setting.
- Determination of the absolute fluorescence intensity per carrier
NOTE: Since the fluorescence of individual carriers in this stream cannot be characterized directly, the fluorescence intensity is quantified in bulk. This method relies on the fact that fluorescence intensity is linearly related to the fluorochrome concentration according to the Lambert-Beer law. When such bulk quantification of carriers in suspension is done on a suspension of known carrier concentration (see step 3.1), the fluorescence per carrier can be derived. This step can be done on either a fluorescence plate reader or a spectrofluorometer. The fluorescence intensity is compared to a standard curve of samples with known absolute fluorescence, given in number of MESFs.- Use a solution of the free fluorochrome to label the carrier: resuspend the dye in the appropriate buffer (e.g., DMSO) and perform further dilutions in the same buffer as the carrier diluent. Alternatively, use a solution of an antibody conjugated to the fluorochrome. Calculate the concentration of the stock solution (MESF/mL) from the concentration in mg/mL, the molecular weight in mg/mole, and Avogadro's number using equation (3). Perform a serial dilution in the carrier diluent to generate standard curve samples.
 (3)
(3)
NOTE: Use a fluorochrome-conjugated antibody only if the degree of labeling, i.e., the molar ratio between the fluorochrome and antibody in the solution, is known. Initially, generate a standard curve with a wide range, as the fluorescence intensity of the carrier sample is still unknown. From here, narrow it down to include the range required. - Prepare the carrier samples.
NOTE: The best practice is to test two or more carrier dilutions to validate that the measurements are linear and fall within the range of the standard curve. - Measure the fluorescence of equal volumes of each sample, i.e., both carrier and standard curves.
- Generate a standard curve and deduct the bulk absolute fluorescence intensity in MESF/mL for the carrier samples measured.
- Calculate the absolute fluorescence intensity per carrier (MESF/carrier) by dividing the bulk fluorescence (MESF/mL) by the carrier concentration (carriers/mL) as in equation (4):
 (4)
(4)
- Use a solution of the free fluorochrome to label the carrier: resuspend the dye in the appropriate buffer (e.g., DMSO) and perform further dilutions in the same buffer as the carrier diluent. Alternatively, use a solution of an antibody conjugated to the fluorochrome. Calculate the concentration of the stock solution (MESF/mL) from the concentration in mg/mL, the molecular weight in mg/mole, and Avogadro's number using equation (3). Perform a serial dilution in the carrier diluent to generate standard curve samples.
- Cell experiment (including the determination of the equivalent fluorescence intensity per carrier)
NOTE: In this step, flow cytometry quantitation beads are used to generate a standard curve of the relationship between MESF and MFI. These quantitation beads consist of multiple bead populations with a known number of MESF per bead, and these individual beads can be detected by any cytometer. Ideally, the MESF standard curve is determined at the same time as the readout of the carrier-cell experiments. This is to ensure that the MFI values calculated for individual carriers can directly be compared to the MFI of cells associated with carriers. In practice, a cytometer will usually generate similar results when used on consecutive days using the same PMT voltages, but this cannot be guaranteed.- Design the carrier-cell experiment. Use the carrier concentration determined in section 3.1.3 to administer the desired dose of carriers.
- Set up the flow cytometer for the final carrier-cell experiment by determining optimal PMT voltage settings in the relevant channels.
- Run a negative control sample, that is, cells not incubated with carriers, to determine the background fluorescence.
- Prepare and resuspend the flow cytometry quantitation beads. Use the same buffer as used for the cell samples (e.g., PBS). If the bead populations are provided separately, pool them together.
- Run the flow cytometry quantitation bead sample.
- Run the carrier-cell samples to determine the fluorescence intensity per cell.
- Use the quantitation bead sample to generate a standard curve converting the absolute fluorescence intensity (MESF) into MFI. Use this standard curve and the results from step 3.1.4 to calculate the theoretical MFI of the carriers. Calculate the number of carriers per cell using equation (5):
 (5)
(5)
Where Passoc is the number of carriers associated per cell, FIcell is the MFI of cells incubated with carriers, FIbackground is the MFI of cells not incubated with carriers, and FIcarrier is the calculated MFI of carriers in suspension (step 3.1.4).
- Preparation
Results
As discussed previously, different drug carrier types require the use of different techniques for the absolute quantification of cell-carrier association. For example, 633 nm disulfide-stabilized poly(methacrylic acid) (PMASH) core-shell particles are large and dense enough for detection using a sensitive flow cytometer. As such, these particles were labeled fluorescently, then gated and counted using side-angle light scattering (SALS, analogous to SSC), as well as the appropriate fluorescent channel (
Discussion
Characterizing the interactions between drug carriers and cells is becoming increasingly important in the development of novel drug delivery systems. Specifically, to allow the rational evaluation and comparison of various carrier constructs, absolute quantification of the performance of said carrier to interact with target and off-target cells is critical. This protocol describes a two-stream methodology that allows any researcher working with a drug carrier to convert relative, semiquantitative flow cytometry data on c...
Disclosures
The authors have no conflicts of interest to disclose.
Acknowledgements
This work was supported by the Australian National Health and Medical Research Council (NHMRC; Program Grant No. GNT1149990), the Australian Centre for HIV and Hepatitis Virology Research (ACH2), as well a gift from the estate of Réjane Louise Langlois. F.C. acknowledges the award of a National Health and Medical Research Council (NHMRC) Senior Principal Research Fellowship (GNT1135806). Figure 1 and Figure 2 were created with BioRender.com.
Materials
| Name | Company | Catalog Number | Comments |
| Alexa Fluor 647 C2 Maleimide | Invitrogen | A20347 | pH-stable dye used to label 150 nm, 235 nm, or 633 nm PMASH carriers; example of good dye to use in cell-carrier association studies |
| Apogee A50 Microflow | Apogee | Sensitive flow cytometer capable of detecting small carriers for counting | |
| CytoFLEX S Flow Cytometer | Beckman Coulter | Sensitive flow cytometer capable of detecting small carriers for counting and read out for final cell-barrier experiments | |
| FCS Express | De Novo Software | Software used to analyze flow cytometry data, i.e., perform gating and derive median fluorescence intensity values of populations of choice. Alternatives include FlowJo, OMIQ, Python | |
| Infinite 200 PRO | Tecan Lifesciences | Standard microplate reader instrument used for bulk fluorescence measurements of carriers in solution | |
| LSRFortessa Cell Analyzer | BD Biosciences | Less sensitive flow cytometer, but one more generally available to researchers. Can be used to read out final cell-carrier experiment | |
| NanoSight NS300 | Malvern Panalytical | Instrument used for Nanoparticle Tracking Analysis | |
| Prism 8 | GraphPad | Software used to graph and calculate standard curves. Alternatives include Microsoft Excel, Origin, Minitab, Python amongst many others | |
| Quantum MESF kits Alexa Fluor 647 | Bangs Laboratories | 647 | Absolute quantitation beads for flow cytometery. Used to convert fluorescence intensities measured in bulk on a microplate reader to fluorescence intensities measured on a flow cytometer using the MESF standard |
References
- Conde, J., et al. Revisiting 30 years of biofunctionalization and surface chemistry of inorganic nanoparticles for nanomedicine. Frontiers in Chemistry. 2, 48 (2014).
- Cheng, Q., et al. Selective ORgan Targeting (SORT) nanoparticles for tissue specific mRNA delivery and CRISPR/Cas gene editing. Nature Nanotechnology. 15 (4), 313-320 (2020).
- Jackson, N. A. C., Kester, K. E., Casimiro, D., Gurunathan, S., DeRosa, F. The promise of mRNA vaccines: A biotech and industrial perspective. npj Vaccines. 5 (1), 1-6 (2020).
- Press, A. T., et al. Cargo-carrier interactions significantly contribute to micellar conformation and biodistribution. NPG Asia Materials. 9 (10), 444 (2017).
- Cevaal, P. M., et al. In vivo T cell-targeting nanoparticle drug delivery systems: Considerations for rational design. ACS Nano. 15 (3), 3736-3753 (2021).
- Faria, M., Johnston, S. T., Mitchell, A. J., Crampin, E., Caruso, F. Bio-nano science: Better metrics would accelerate progress. Chemistry of Materials. 33 (19), 7613-7619 (2021).
- Shin, H., Kwak, M., Geol Lee, T., Youn Lee, J. Quantifying the level of nanoparticle uptake in mammalian cells using flow cytometry. Nanoscale. 12 (29), 15743-15751 (2020).
- Lozano-Andrés, E., et al. Considerations for MESF-bead based assignment of absolute fluorescence values to nanoparticles and extracellular vesicles by flow cytometry. bioRxiv. , (2021).
- Schwartz, A., et al. Formalization of the MESF unit of fluorescence intensity. Cytometry. Part B, Clinical Cytometry. 57 (1), 1-6 (2004).
- Faria, M., et al. Revisiting cell-particle association in vitro: A quantitative method to compare particle performance. Journal of Controlled Release. 307, 355-367 (2019).
- Chen, A. K., Cheng, Z., Behlke, M. A., Tsourkas, A. Assessing the sensitivity of commercially available fluorophores to the intracellular environment. Analytical Chemistry. 80 (19), 7437-7444 (2008).
- Comfort, N., et al. Nanoparticle tracking analysis for the quantification and size determination of extracellular vesicles. Journal of Visualized Experiments. (169), e62447 (2021).
- Cui, J., et al. Immobilized particle imaging for quantification of nano- and microparticles. Langmuir. 32 (14), 3532-3540 (2016).
- Shang, J., Gao, X. Nanoparticle counting: Towards accurate determination of the molar concentration. Chemical Society Reviews. 43 (21), 7267-7278 (2014).
- Thomas, D. G., et al. ISD3: A particokinetic model for predicting the combined effects of particle sedimentation, diffusion and dissolution on cellular dosimetry for in vitro systems. Particle and Fibre Toxicology. 15 (1), 6 (2018).
- Johnston, S. T., Faria, M., Crampin, E. J. Isolating the sources of heterogeneity in nano-engineered particle-cell interactions. The Journal of the Royal Society Interface. 17 (166), 20200221 (2020).
- Ahmed-Cox, A., et al. Spatio-temporal analysis of nanoparticles in live tumor spheroids impacted by cell origin and density. Journal of Controlled Release. 341, 661-675 (2022).
- Faria, M., et al. Minimum information reporting in bio-nano experimental literature. Nature Nanotechnology. 13 (9), 777-785 (2018).
Reprints and Permissions
Request permission to reuse the text or figures of this JoVE article
Request PermissionThis article has been published
Video Coming Soon
Copyright © 2025 MyJoVE Corporation. All rights reserved