
מיפוי מאמץ כמותי של מפרצת באבי העורקים בבטן
Overview
מקור: חנה ל. קאבול1,ארווין ה. סופריאטנה1,ג'ון ג'יי בויל2 וקרייג ג'יי גורגן1
1 בית הספר וולדון להנדסה ביו-רפואית, אוניברסיטת פרדו, מערב לאפייט, אינדיאנה
2 הנדסת מכונות ומדעי החומרים, אוניברסיטת וושינגטון בסנט לואיס, סנט לואיס, מיזורי
ההתנהגות המכנית של רקמות רכות, כגון כלי דם, עור, גידים ואיברים אחרים, מושפעת מאוד מהרכב האלסטין והקולגן שלהם, המספקים גמישות וכוח. כיוון הסיבים של חלבונים אלה תלוי בסוג הרקמה הרכה ויכול לנוע בין כיוון מועדף אחד לרשתות רשת מורכבות, אשר יכול להשתנות ברקמה חולה. לכן, רקמות רכות לעתים קרובות להתנהג אניזוטרופית ברמת התא והאיברים, יצירת צורך באפיון תלת מימדי. פיתוח שיטה להערכה אמינה של שדות זנים בתוך רקמות או מבנים ביולוגיים מורכבים חשוב לאפיין ולהבין באופן מכני מחלות. זן מייצג כיצד רקמות רכות מעוותות יחסית לאורך זמן, וניתן לתאר אותה מתמטית באמצעות הערכות שונות.
רכישת נתוני תמונה לאורך זמן מאפשרת להעריך עיוות ומתח. עם זאת, כל שיטות ההדמיה הרפואית מכילות כמות מסוימת של רעש, מה שמגביר את הקושי ומדייק להגביר את זן vivo. הטכניקה המתוארת כאן מתגברת בהצלחה על בעיות אלה באמצעות שיטת הערכת עיוות ישירה (DDE) לחישוב שדות מאמץ תלת-ממדי משתנים מרחבית מנתוני תמונה נפחית.
שיטות הערכת המתח הנוכחיות כוללות מתאם תמונה דיגיטלית (DIC) ומתאם אמצעי אחסון דיגיטלי. למרבה הצער, DIC יכול רק להעריך במדויק את המתח ממישור דו-ממדי, מה שמגביל מאוד את היישום של שיטה זו. בעוד שימושי, שיטות 2D כגון DIC מתקשים לכמת מתח באזורים שעוברים עיוות 3D. הסיבה לכך היא שתנועה מחוץ למטוס יוצרת שגיאות עיוות. מתאם אמצעי אחסון דיגיטלי הוא שיטה ישימה יותר המחלקת את נתוני אמצעי האחסון ההתחלתיים לאזורים ומוצאת את האזור הדומה ביותר של אמצעי האחסון המעוות, ובכך מפחיתה את השגיאה מחוץ למישור. עם זאת, שיטה זו מוכיחה להיות רגיש רעש ודורש הנחות על המאפיינים המכניים של החומר.
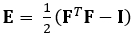
הטכניקה המודגמת כאן מבטלת בעיות אלה באמצעות שיטת DDE, ובכך הופכת אותה לשימושית מאוד בניתוח נתוני הדמיה רפואית. יתר על כן, הוא חזק עד גבוה או זן מקומי. כאן אנו מתארים את הרכישה של נתוני אולטרסאונד 4D מגודרים, נפחיים, ההמרה שלהם לפורמט ניתן לניתוח, ושימוש בקוד Matlab מותאם אישית להערכת עיוות תלת-ממדי וזני גרין-לגראנז ' תואמים, פרמטר המתאר טוב יותר עיוותים גדולים. טנזור זן גרין-לגראנז' מיושם בשיטות רבות להערכת זן תלת-ממדי מכיוון שהוא מאפשר לחשב את F מתוך פחות ריבועים Fit (LSF) של העקירות. המשוואה שלהלן מייצגת את טנסור זן גרין-לגראנז', E, שבו F ואני מייצגים את שיפוע העיוות וטנסור הזהות מסדר שני, בהתאמה.
 (1)
(1)
Procedure
1. הגדרת אולטראסאונד 4D
- בעת שימוש בתוכנת ההדמיה, השתמש במחשב נייד המסוגל להפעיל תוכנת מחשוב מתמטית כדי להפוך את תהליך הרכישה של 4D לאוטומטי. חבר את המחשב הנייד עם קוד מותאם אישית זה למערכת אולטרסאונד באמצעות יציאת USB. שים לב כי תוכנת ההדמיה יש תכונת אולטרסאונד 4D משולב בתוכנה.
- לאחר הפעלת מערכת האולטרסאונד, הקימו את יחידת הניטור הפיזיולוגי תוך הקפדה על קצב הלב וכפתורי הטמפרטורה. אתחל את שלב המנוע 3D המחובר למחזיק המתמר.
- השתמש במתמר השלב והאולטרסאונד המתאים לרכישת תמונה. ודא שכל החיבורים המתא
Results
באמצעות ההליך המתואר לעיל, אולטרסאונד 4D של אנגיוטנסין II-המושרה על-על-חנית מפרצת באבי העורקים בבטן (AAA) של עכבר נרכש. לולאות וידאו מרובות של אק"ו קצרות ציר נרכשו לאורך העורקים ושולבו כדי ליצור נתוני 4D, כפי שמוצג באיור 1. נתונים אלה הומרו לאחר מכן לקובץ MAT באמצעות קוד מותאם אישית...
Application and Summary
לוקליזציה באפיון מכני vivo הוא חלק חשוב של הבנת הצמיחה ושיפוץ של רקמות ביולוגיות. בהשוואה לגישות קיימות, הליך כימות המתח המתואר כאן משתמש בשיטה משופרת של חישוב מדויק של זן תלת-ממדי באמצעות עיוות אופטימלי של התמונה הלא מעוצבת לפני מתאם צולב. שיטה זו אינה משתמשת בהנחות חומריות בקביעת זני?...
Tags
Skip to...
Videos from this collection:

Now Playing
מיפוי מאמץ כמותי של מפרצת באבי העורקים בבטן
Biomedical Engineering
4.6K Views

הדמיה דגימות ביולוגיות עם מיקרוסקופיה אופטית וקונפוקל
Biomedical Engineering
36.0K Views

הדמיית SEM של דגימות ביולוגיות
Biomedical Engineering
24.0K Views

ייחוס ביולוגי של נשאי ננו-תרופות: יישומים של SEM
Biomedical Engineering
9.5K Views

הדמיית אולטרסאונד בתדר גבוה של אב העורקים בבטן
Biomedical Engineering
14.8K Views

טומוגרפיה פוטואקוסטית לדם תמונה ולומנים בבטורה האינפרא-רנאלית
Biomedical Engineering
5.9K Views

הדמיית תהודה מגנטית לבבית
Biomedical Engineering
15.0K Views

סימולציות דינמיקה של נוזל חישובי של זרימת דם במפרצת מוחית
Biomedical Engineering
11.9K Views

הדמיית פלואורסצנטיות כמעט אינפרא אדום של מפרצות באבי העורקים בבטן
Biomedical Engineering
8.4K Views

טכניקות למדידת לחץ דם לא פולשניות
Biomedical Engineering
12.1K Views

רכישה וניתוח של אות אק"ג (אלקטרוקרדיוגרפיה)
Biomedical Engineering
106.6K Views

חוזק מתיחה של ביו-חומרים הניתנים למיחזור
Biomedical Engineering
7.5K Views

הדמיית מיקרו-CT של חוט השדרה של העכבר
Biomedical Engineering
8.3K Views

הדמיה של ניוון מפרק הברך לאחר פציעת ACL לא פולשנית בחולדות
Biomedical Engineering
8.3K Views

הדמיית SPECT ו- CT משולבת כדי להמחיש את תפקוד הלב
Biomedical Engineering
11.2K Views
Copyright © 2025 MyJoVE Corporation. All rights reserved