
19.9 : Phase Diagram
The phase of a given substance depends on the pressure and temperature. Thus, plots of pressure versus temperature showing the phase in each region provide considerable insights into the thermal properties of substances. Such plots are known as phase diagrams. For instance, in the phase diagram for water (Figure 1), the solid curve boundaries between the phases indicate phase transitions (i.e., temperatures and pressures at which the phases coexist).
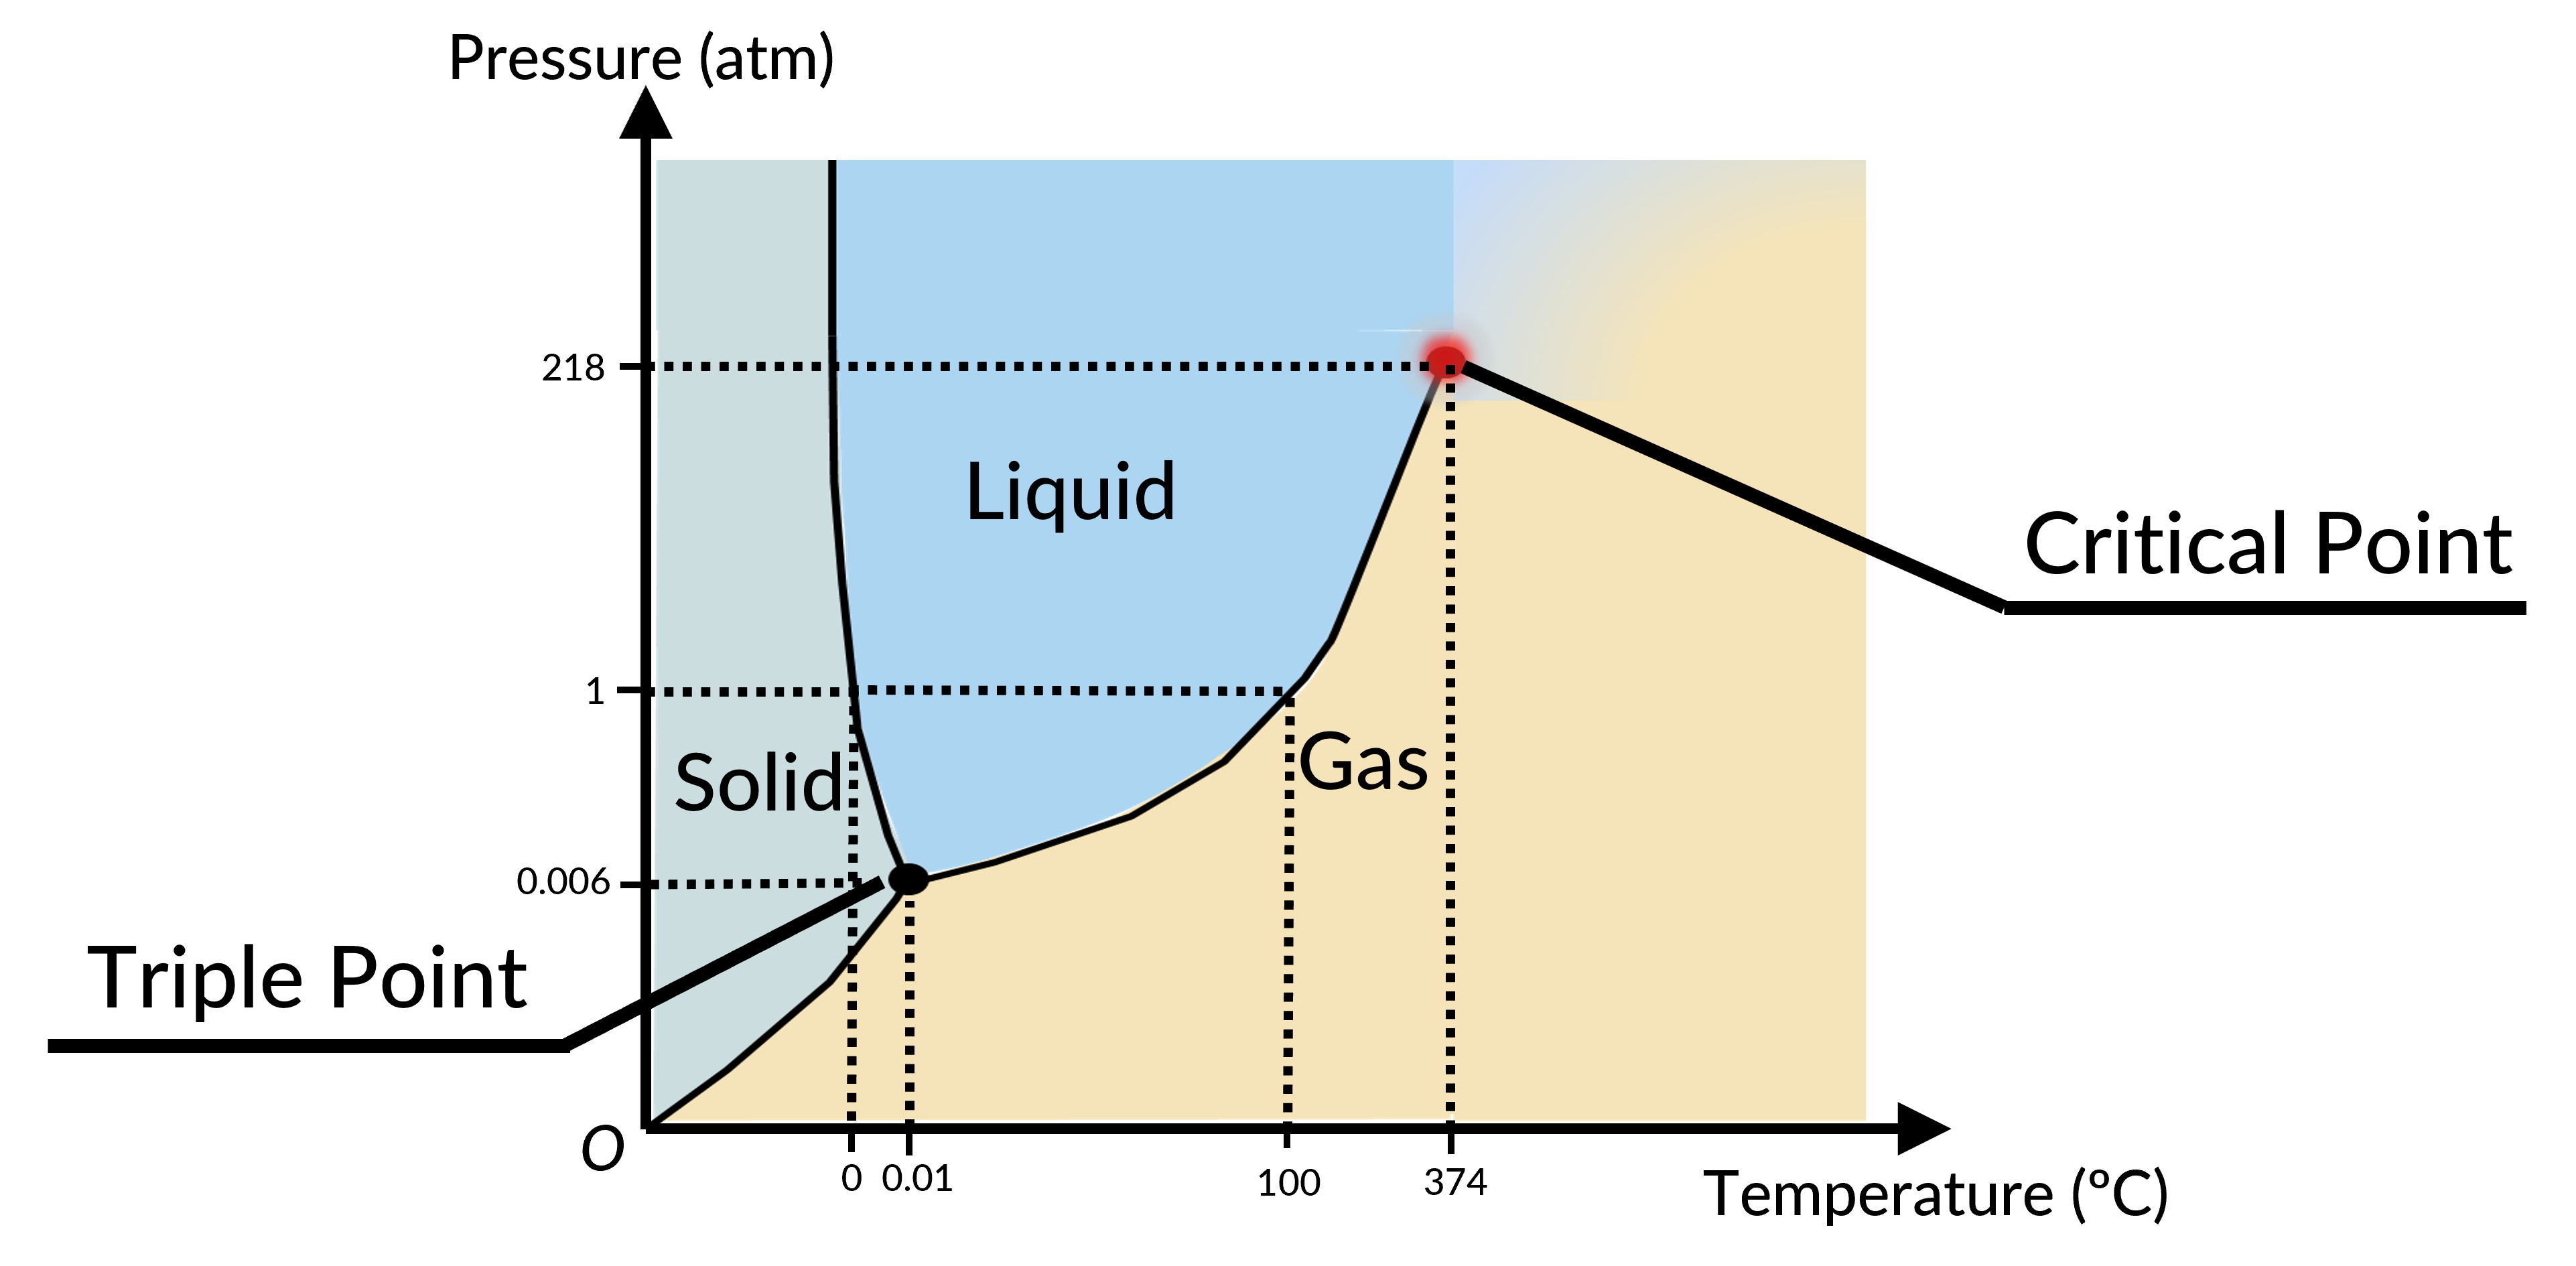
As the pressure increases, the boiling temperature of water rises gradually to 374 °C at a pressure of 218 atm. This can be demonstrated in a pressure cooker, which cooks food faster than an open pot, because the water can exist as a liquid at temperatures greater than 100 °C without all boiling away. The boiling point curve ends at a certain point called the critical point, the temperature above which the liquid and gas phases cannot be distinguished; the substance is called a supercritical fluid. At a sufficiently high pressure above the critical point, a gas has the density of a liquid but does not condense. The pressure at this critical point is known as the critical pressure. Carbon dioxide, for example, is supercritical at all temperatures above 31.0 °C, the point at which all three phases exist in equilibrium. For water, the triple point occurs at 273.16 K (0.01 °C) and 611.2 Pa; this is a more accurate calibration temperature than the melting point of water at 1.00 atm, or 273.15 K (0.0 °C).
Dal capitolo 19:

Now Playing
19.9 : Phase Diagram
The Kinetic Theory of Gases
5.7K Visualizzazioni

19.1 : Equazione di Stato
The Kinetic Theory of Gases
1.6K Visualizzazioni

19.2 : Equazione dei gas ideali
The Kinetic Theory of Gases
6.3K Visualizzazioni

19.3 : Equazione di Van der Waals
The Kinetic Theory of Gases
3.7K Visualizzazioni

19.4 : Diagrammi pV
The Kinetic Theory of Gases
3.9K Visualizzazioni

19.5 : Teoria cinetica di un gas ideale
The Kinetic Theory of Gases
3.2K Visualizzazioni

19.6 : Energia cinetica molecolare
The Kinetic Theory of Gases
4.8K Visualizzazioni

19.7 : Distribuzione delle velocità molecolari
The Kinetic Theory of Gases
3.6K Visualizzazioni

19.8 : Distribuzione di Maxwell-Boltzmann: risoluzione dei problemi
The Kinetic Theory of Gases
1.3K Visualizzazioni

19.10 : Percorso libero medio e Tempo libero medio
The Kinetic Theory of Gases
3.1K Visualizzazioni

19.11 : Capacità termica: risoluzione dei problemi
The Kinetic Theory of Gases
471 Visualizzazioni

19.12 : Legge di Dalton della pressione parziale
The Kinetic Theory of Gases
1.2K Visualizzazioni

19.13 : Velocità di fuga dei gas
The Kinetic Theory of Gases
868 Visualizzazioni
Personale delle biblioteche
Copyright © 2025 MyJoVE Corporation. Tutti i diritti riservati