Method Article
フローサイトメトリーを用いたシナプス材料のミクログリア包絡の定量化
要約
ここでは、フローサイトメトリーを使用してvGLUT1陽性シナプスとpHRodo Red標識粗シナプスソームのミクログリア包みを定量化するための2つのプロトコルを紹介します。
要約
ミクログリアは、脳内のシナプス精製において極めて重要な役割を果たします。シナプスのミクログリア包み込みの分析は、このプロセスを理解するために不可欠です。しかし、現在利用可能なシナプスのミクログリア包み物を同定する方法は、免疫組織化学(IHC)やイメージングなど、手間と時間がかかります。この課題に対処するために、ここでは、フローサイトメトリーを使用してシナプスのミクログリア包みを迅速かつハイスループットに定量できる in vitro および in vivo* アッセイを紹介します。
in vivo*アプローチでは、成体マウス脳からの新鮮細胞単離後に細胞内vGLUT1染色を行い、ミクログリアによるvGLUT1+シナプスの飲み込みを定量化しました。in vitroシナプトソーム巻き込みアッセイでは、成体マウスの脳から新たに単離した細胞を用いて、ミクログリアによるpHrodo Red標識シナプトソームの巻き込みを定量しました。これらのプロトコルは、シナプスのミクログリア包み込みを定量化するための時間効率の良いアプローチを提供し、労働集約的な画像解析ベースの方法に代わる有望な選択肢となります。解析を効率化することで、これらのアッセイは、さまざまな疾患モデルにおけるシナプス精製におけるミクログリアの役割の理解を深めることに貢献できます。
概要
ミクログリアは、中枢神経系(CNS)に常在する免疫細胞です1。彼らは常に微小環境をスキャンし、監視を提供します1,2。さらに、それらは頻繁にシナプスと相互作用し、シナプス活動の微調整を仲介します3。したがって、彼らはシナプス精製のプロセスにおける主要なプレーヤーとして浮上しています。
シナプスの飲み込みによるシナプス微細化におけるミクログリアの役割は、さまざまな研究グループによって示されています3,4,5,6,7。このプロセスの混乱は、統合失調症やアルツハイマー病などの神経発達障害や神経変性疾患の病理に寄与する可能性があります8。ミクログリアによるシナプス精製の異常は、神経疾患のさまざまなマウスモデルですでに検出されています5,9,10。したがって、シナプスのミクログリアの飲み込みの根底にある明確なメカニズムの特定は、神経発達障害および神経変性疾患の病態生理学を理解するために最も重要です8。
シナプスのミクログリアを標的とすることは、疾患の進行に介入し、神経発達障害や神経変性疾患の根本的なメカニズムに関する洞察を得るための大きな可能性を秘めています。このような調査を容易にするためには、高速でハイスループットなアプローチが必要です。現在の方法論的アプローチには、ミクログリア内のシナプス物質の検出を可能にするin vivo、ex vivo、およびin vitroアッセイが含まれます。一般に、シナプスのミクログリアの飲み込みの検出は、免疫組織化学(IHC)および顕微鏡法に基づくアプローチ5,6,11に大きく依存しており、これらは労働集約的であり、多数のミクログリアの分析には限界があります。
これらの技術的な制限を考えると、代替方法論の探求が不可欠です。これを克服するために、フローサイトメトリーベースのアプローチを最適化し、シナプスのミクログリア包み込みの効率的で偏りのないハイスループットな解析を可能にしました。海馬を主な関心領域として選択したのは、その高度なシナプスリモデリングと可塑性12のためであるが、プロトコルはさまざまな脳領域に適応できる。フローサイトメトリーは、シナプス13、14、15のミクログリア包みを検出するために以前の研究ですでに使用されてきましたが、ここでは、現在市販されている蛍光色素標識vGLUT1抗体を採用した段階的な方法論を提供します。さらに、粗シナプトソームを用いたシナプス物質のミクログリア包み込みのハイスループットスクリーニングのための補完的なin vitro アプローチを提供しています。
プロトコル
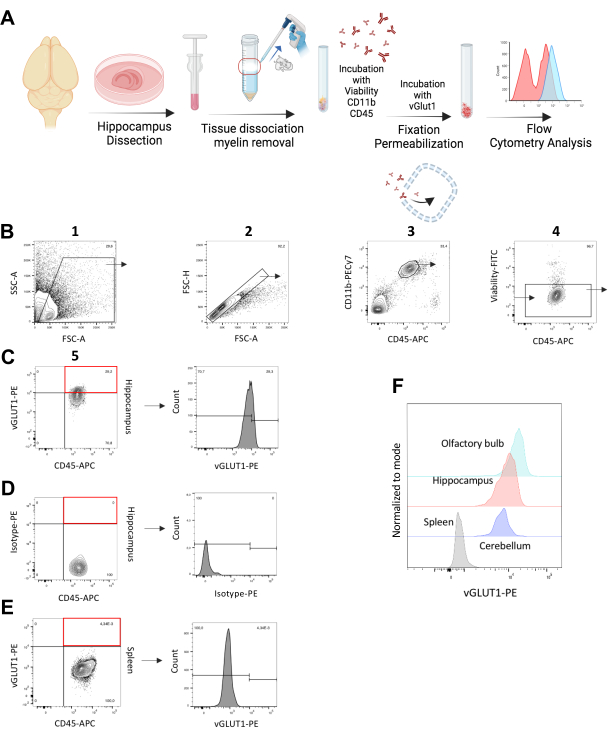
実験手順の一般的な図を 図1Aにグラフで示します。生きた動物の取り扱いに関するすべての実験は、ドイツ動物保護法に厳密に従って行われ、ベルリンの地域保健社会サービス局(Landesamt für Gesundheit und Soziales, Berlin, Germany)によって承認されました。マウスは、マックス・デルブリュック分子医学センター(MDC)の動物コア施設で、標準的な実験室条件下で12:12の明暗サイクルで換気ケージにグループ収容されました。食料と水は自由に提供されました 。 バッファーと試薬の組成については 表1 を、このプロトコルで使用されるすべての試薬、機器、および材料に関連する詳細については 、材料表 を参照してください。vGLUT1特異的アッセイでは、原稿全体で in vivo*という用語を使用し、フローサイトメトリーには組織の均質化と細胞単離が必要であり、単離手順後にミクログリアが約95%の生存率を示すことを認めました(図1B および 補足図S1)。したがって、それらは、固定されるまで、 生体外でシナプス材料を飲み込む能力を短時間保持します。したがって、vGLUT1+ ミクログリアの定量は、固定ステップまでの in vivo および短期の ex vivo エンベロープの両方で構成されます。
1. ミクログリアによるグルタミン酸作動性シナプスの in vivo* 飲み込み検出のための細胞内vGLUT1染色
注:以下の細胞単離手順は、16.細胞単離のすべてのステップは氷上で実施する必要があります。
- ペントバルビタールの腹腔内注射を使用してマウスに麻酔をかけます。マウスを10 mLの氷冷ダルベッコリン酸緩衝生理食塩水(DPBS)で心内投与し、~2分間灌流します。
注:サンプル(n)ごとに1つのマウスが使用されます。 - 頭蓋骨から脳を取り出し、1mLの神経細胞培地に保存します。
注:Hibernate-A培地などの神経細胞培地は、組織解離プロセス後の細胞の高い生存率を確保するために使用されます。 - 1mLの氷冷神経細胞培地で満たされたシャーレに脳を移し、前述のように海馬を解剖する17。
- 海馬を 1 mL の神経細胞培地で満たされた Dounce ホモジナイザーに移し、緩い乳棒を使用して組織を約 ~25 回の穏やかなストロークで解離します。
- 5 mLのポリプロピレンチューブに70 μmのストレーナーを置き、500 μLの神経細胞培地を加えます。組織ホモジネートをストレーナーを介して5mLポリプロピレンチューブに移します。
- Dounce ホモジナイザーを 1 mL の冷神経細胞培地で 2 回すすぎ、サンプルを 400 × g で 8 分間遠心分離します。
- 上清を吸引し、穏やかなピペッティングにより、ペレットを500 μLの氷冷DPBSに再懸濁します。均質な懸濁液を確保し、DPBSを使用して最終容量を1.5mLまで完成させます。
- 500 μLの等張性Percoll溶液をサンプルに加え、穏やかに再懸濁し、さらに2 mLの冷たくしたDPBSで覆います。
- サンプルを3,000 × g で10分間遠心分離し、全加速とブレーキなしの運転を行います。最上層と中相のミエリンディスクを吸引します。
注:以下のすべての遠心分離ステップは、特に指定がない限り、4 °Cで実行されます。 - 4 mLの冷DPBSを加え、サンプルを400 × g で10分間遠心分離します。上清を吸引し、細胞を100 μLの固定生存率染色溶液に再懸濁し、サンプルを4°Cで30分間インキュベートします。
- 1 mLの冷たくしたDPBSをサンプルに加え、サンプルを300 × g で5分間遠心分離します。上清を捨て、100 μLのCD16/CD32染色溶液(1/200 in FACS buffer)を加えます。ボルテックスを~5秒間ボルテックスし、4°Cで10分間インキュベートします。
注:CD16/CD32染色は、フローサイトメトリーなどのアプリケーションの前に、ミクログリアなどのFcR含有細胞への抗体の非特異的結合を最小限に抑えるための前処理です。 - 1 mLのFACSバッファーをサンプルに加え、300 × g で5分間遠心分離します。上清を吸引し、100 μLの染色用マスターミックス-I(1x FACS Bufferに1/100 anti-CD11b/ anti-CD45 + 1/200 anti-Ly6C/ anti-Ly6G)を加えます。暗所でサンプルを4°Cで20分間インキュベートします。
- 1 mLのFACSバッファーをサンプルに加え、300 × g で5分間遠心分離します。
- ペレットを250 μLの固定緩衝液に再懸濁します。4°Cで25分間インキュベートします。
- 1x permeabilization(PERM)Buffer 2 mLを添加し、300 × g を5分間遠心分離します。
- 上清を捨て、100 μLのvGLUT1またはアイソタイプコントロール染色液を加えます。~5秒間ボルテックスし、サンプルを4°Cで50分間インキュベートします。
- 1x PERM Buffer 2 mLを加え、300 × g を5分間遠心分離します。上清を捨て、2 mLのFACSバッファーをサンプルに加えます。
- 300 × g で5分間遠心分離し、上清を捨てます。細胞を250μLのFACSバッファーに再懸濁し、サンプルを40μmのストレーナフィルターに通します。
- フローサイトメトリーを使用して、単一/生存/CD11b ++/CD45+ ミクログリアからのvGLUT1蛍光強度を解析します。各実験のネガティブコントロールとして脾臓マクロファージを使用します。
- 脾細胞を分離するには、70 μmのストレーナーフィルターで細かく刻んだ脾臓組織を2回穏やかに圧縮します。フィルターを40 mLのDPBSですすぎ、懸濁液を50 mLのコニカルチューブに集めます。
- 350 × g を10分間遠心分離し、得られたペレットを赤血球溶解バッファーの1 mL溶液に再懸濁します。氷上で10分間インキュベートします。
- インキュベーション後、10 mLのDPBSをサンプルに加え、350 × g で10分間遠心分離します。
- ステップ1.11と1.17で説明した染色ステップに進みます。
注:ゲーティング戦略は、脾臓マクロファージをCD11b ++/ CD45++/生細胞集団として定義するために、補足図S2で提供されています。 - ゲート戦略 (図 1)
- プライマリゲート:前方散乱領域(FSC-A)[x軸]と側方散乱領域(SSC-A)[y軸]を調整して、ゲート領域にミクログリア集団を含め、細胞の破片を除外します。
- 前方散布図領域(FSC-A)[x軸]と前方散布図高さ(FSC-H)[y軸]を調整して、ダブレットを除外します。シングレットは、このドット プロットでは対角線として表示されます。
- CD11b-PECy7 [y軸]とCD45-APC [x軸]を調整し、CD11bの表面レベルが高く、CD45が中程度の集団をミクログリアとしてゲートします。
- FITC[y-axis]ネガティブゲートの死細胞を除外します。オプション:FITC陰性ゲートでLy6CおよびLy6G-FITCに陽性の細胞も除外して、CNS関連マクロファージを解析から除外します。
注:生細胞とは対照的に、膜が損なわれた死細胞は、固定可能な生存率色素が細胞質に入ることを可能にし、タンパク質標識の量を増加させる18。したがって、死細胞は、定義されたゲートに含まれる生細胞よりも明るくなります。 - CD45-APC [x軸]とvGLUT1-PE [y軸]を調整します。脾臓サンプルで陽性イベントが検出されない閾値ゲートを超える母集団(内部生物学的陰性コントロール、 図1E)は、サンプル中のvGLUT1陽性画分と見なされます。
2. ミクログリアによる粗シナプトソームの in vitro 飲み込みの検出
- 粗シナプトソーム調製物とpHrodo Red標識
注:次の手順はすべて氷上で行う必要があります。- 手順 1.1 から 1.2 に従います。
- 氷冷した神経細胞培地1mLを入れたシャーレに脳を移し、海馬を慎重に解剖します。ペトリ皿は常に氷の上に置いてください。次のステップでミクログリアの分離に海馬を使用します。
- 脳の残りの部分(小脳と嗅球を除く)を1 mLのシナプスタンパク質抽出試薬で満たされたDounceホモジナイザーに移し、緩い乳棒を使用して組織を約~30回のストライクで穏やかに解離します。抽出試薬10 mLあたり1錠のプロテアーゼ阻害剤を補充し、製造元の指示に従ってシナプトソームを分離します。.
注:SynPER19などのシナプスタンパク質抽出試薬は、生物学的に活性なシナプス前およびシナプス後タンパク質を含むシナプトソームを調製するために使用されます。 - 粗シナプトソームペレットを500μLの0.1 M Na2CO3 溶液に溶解します。シナプトソームサンプルを10 μLの0.2 mM pHrodo Redで染色します。粗シナプトソームサンプルを室温(24-25°C)で1.5時間、穏やかに攪拌しながらインキュベートします。
- 1 mLの冷たくしたDPBSをサンプルに加え、全速力(20,815 × g)で1分間遠心分離し、上清を吸引します。
- ステップ2.1.5を合計7回繰り返して、結合していない過剰なpHrodo Redをサンプルから取り除きます。
- 最後の遠心分離後、標準的なBCAアッセイを実施して、サンプルのタンパク質濃度を定量します。
- オプション:液体窒素を使用して、5% DMSOでDPBS中のシナプトソームサンプルを急速凍結し、-80°Cで3週間保存します。 チューブをアルミホイルで覆い、光の露出を最小限に抑えます。
- In vitro 新たに単離された成体ミクログリアを用いた粗シナプトソーム包み込みアッセイ
- aCSFを調製し、95%O2:5%CO2 で30分間平衡化します。
注:手順2.2.2-2.2.4については、パパインベースの消化液の調製について製造元の指示に従ってください。. - パパインキットの バイアル2 に4mLのaCSFを加えます。バイアルを37°Cのウォーターバスに~10分間置き、パパイン溶液が透明になるまで待ちます。
- パパインキットの バイアル3 に400 μLのaCSFを加えます。ゆっくりとピペッティングして~10回穏やかに混合します。
- バイアル3からバイアル2に200μLを添加します(ステップ2.2.3で再構築)。バイアル3の残りの部分を保存します。
- ステップ2.1.2で解剖した海馬を取り、メスを使用して解剖した海馬をミンチにします。
- 細かく刻んだ海馬を、ステップ2.2.5で調製した2mLの酵素溶液で満たされた組織解離チューブに移します。チューブを組織解離器にセットし、プログラムを実行します: 37C_ABDK_01 (~30分かかります)。
- サンプルを37°Cのウォーターバスに~20分間入れ、1mLのピペットを使用して5分ごとに混合物を漉動し、気泡を作らないようにします。
注:このプロセスは、組織が完全に解離し、効率的な解離を確保するために完全に均質に見えるまで続ける必要があります。以下のすべての遠心分離ステップは、特に指定がない限り、4 °Cで実行されます。 - 曇った細胞懸濁液を新しい15 mLチューブに慎重に取り出し、300 × g で5分間遠心分離します。
- この5分間で、サンプルごとに次の洗浄ミックス(5 mL)を調製します。パパインキットに含まれている500μLの再溶解アルブミン-オボムコイド阻害剤溶液を4.5mLのaCSFに加えます。ステップ2.2.5のバイアル3の残りの溶液を洗浄ミックスに加えます。
- ステップ2.2.8の上清を捨て、すぐに細胞ペレットを洗浄ミックス溶液に再懸濁します。
- サンプルを70 μmフィルターに通し、新しい5 mLマイクロ遠心チューブに通します。サンプルを300 × g で5分間遠心分離します。
- ステップ1.7-1.9で前述したPercollグラジエント遠心分離ステップに進みます。
- MACS染色バッファーにゆっくりとピペッティングして、細胞を慎重に再懸濁します。サンプルを4°Cで15分間インキュベートします。
- 各サンプルに1 mLのMACSバッファーを加え、300 × g で8分間遠心分離します。
- 細胞を500 μLのMACSバッファーに再懸濁します。
- ポジティブセレクションカラムをマグネティックセパレーターに配置します。カラムを3 mLのMACS Bufferですすいで平衡化します。
- 500 μLの細胞懸濁液を穏やかに混合し、カラムに塗布します。カラムを3 mLのMACS Bufferで3回洗浄します。
- マグネティックセパレーターからカラムを取り外し、15 mL のコニカルチューブに置きます。5 mLのMACSバッファーをカラムに加え、すぐにプランパーを使用して細胞を洗い流します。サンプルを300 × g で10分間遠心分離します。
- この期間中に、DPBS中に20mLの40%FBSを調製します。サンプルあたり1 mLのDMEMを37°Cまでウォーターバスで予温します。
- 最終細胞ペレットを予熱したDMEM1 mLに溶解します。24ウェルプレートのウェルあたり500 μLの予熱済みDMEMに約150,000〜200,000個の細胞を播種します。対照として、1〜2個の追加のウェルに同数の細胞を播種します。光学顕微鏡を使用して、すべてのウェル内の細胞のコンフルエンシーを確認します。
注:標的脳領域が海馬または比較的小さな脳領域である場合、サンプル(n)ごとに5匹のマウスをプールして、~150,000のミクログリアを分離できます。全脳の場合、n個あたり1匹のマウスで、両方の単離プロトコルを使用して同数の細胞を得るのに十分です。あるいは、~40,000個の細胞を最終容量100 μLの96ウェルプレートに播種して、エンガルフメントアッセイを開始することもできます。これにより、分析される細胞の数が減りますが、nあたりに使用されるマウスの数も減少します。DMEMにおけるFCSの欠乏によるタンパク質欠乏は、食作用を引き起こします。 - プレートをインキュベーター内で1〜2時間インキュベートします(37°Cおよび5%CO2)。
注:このステップは、機能的巻き込みアッセイの開始前に、単離手順のストレスを受けやすい影響から細胞が回復することを目的としています。 - 各ウェルから250 μLの培地を非常にゆっくりと取り出し、各ウェルに250 μLの新鮮な予熱DMEMを加え、上部に3 μgのpHRodo Red標識シナプトソームを加えます。光学顕微鏡を使用して、すべてのウェルの細胞の密度を確認します。
- ネガティブコントロールウェルの場合、細胞を播種した追加のウェルに同量の非標識シナプトソームを追加します。
- テストウェルの場合、ウェル1に細胞のみが含まれていることを確認してください。ウェル2には、細胞+非標識シナプトソームが含まれています。well-3には細胞+ 3μgのpHrodo Redが含まれています。ウェル4にはDMEM + 3 μgのpHrodo Redが含まれています。
- インキュベーター内で細胞をシナプトソームと2時間インキュベートします(37°Cおよび5%CO2)。
- 培地を取り出し、冷たいDPBSでウェルを洗います。ウェルあたり200 μLのトリプシン/EDTA溶液を添加して、細胞を35秒間剥離します。
- 1ウェルあたり1 mLの40% FBSをDPBSに添加し、ストレーナーを介して細胞を5 mLポリプロピレンチューブに移します。このプロセス中は、プレートとチューブの両方を氷の上に置いて、細胞の剥離を促進します。
- 500 μLの氷冷DPBSを使用して各ウェルを2回洗浄します。収集したサンプルを500 × g で5分間遠心分離します。
- 100 μLのFACSバッファーに1/200 CD16/CD32を含有する染色溶液に細胞を再懸濁し、氷上で10分間インキュベートします。
- インキュベーション後、CD11bとCD45をそれぞれ1/100の最終濃度で染色液に加えます。暗所でサンプルを4°Cで20分間インキュベートします。
- サンプルを1 mLのFACSバッファーで洗浄し、300 × g で10分間遠心分離します。
- ペレットを250 μLのFACSバッファーに再懸濁し、フローサイトメトリーを使用して少なくとも合計100,000のイベントを記録します。CD11b++/CD45+ ミクログリア由来の pHrodo Red 蛍光強度を解析します。
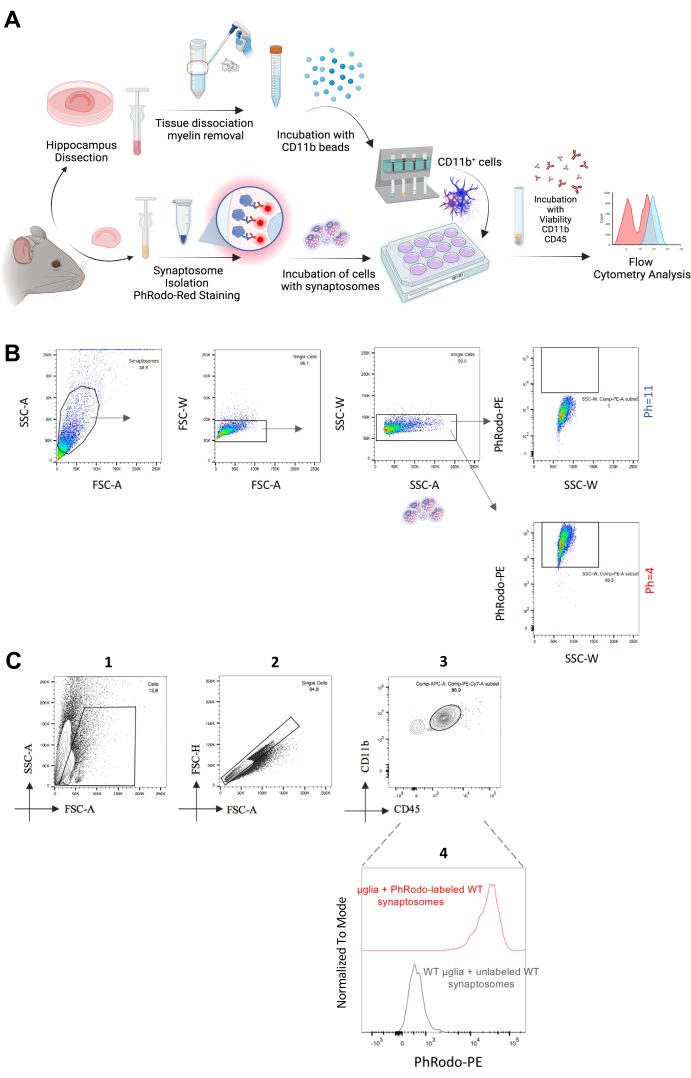
- ゲート戦略 (図 2C)
- プライマリゲートの調整:前方散乱領域(FSC-A)[x軸]および側方散乱領域(SSC-A)[x軸]を使用して、ゲート領域にミクログリア集団を含め、細胞の破片を除外します。
- 前方散布図領域(FSC-A)[x軸]と前方散布図高さ(FSC-H)[y軸]を調整して、ダブレットを除外します。シングレットは、このドット プロットでは対角線として表示されます。
- CD11b-PECy7 [y軸]とCD45-APC [x軸]を調整し、表層レベルの高いCD11bと中程度のCD45を持つ集団をミクログリアとしてゲートします。
- この集団からpHrodo-PEの蛍光強度の中央値を計算します。非標識シナプトソームでインキュベートした細胞をネガティブコントロールと同じものを使用してください。
- aCSFを調製し、95%O2:5%CO2 で30分間平衡化します。
結果
本研究では、ミクログリアによるシナプスの in vivo*および in vitro の飲み込みを測定するための2つのプロトコルを最適化し、提示しました。最初のプロトコルでは、vGLUT1陽性シナプスの in vivo*飲み込みに焦点を当てました。出発点として、以前に公開されたプロトコル14を使用しました。しかし、このプロトコールで使用されたFACS抗体は廃止され、我々は多くの最適化ステップとミクログリア単離のための新しい方法を追加しました16。だからこそ、ここで紹介するプロトコルは、すでに公開されているプロトコルの包括的なアップデートとして、科学界と共有する価値があるのです。
シナプスのミクログリア包み込みを定量化するために、11-14週齢のC57BL/6N雄マウスを用いた。海馬は、その高度なシナプスリモデリングと可塑性のために、主要な関心領域として選択されました12。C57BL/6Nマウスの海馬における%vGLUT1陽性ミクログリアとミクログリア特異的なvGLUT1-PE蛍光強度(MFI)を解析した。同じ動物に由来する脾臓マクロファージを、実験ごとに生物学的陰性コントロールとして使用しました。海馬ミクログリアからのvGLUT1-PE蛍光シグナルが、アイソタイプコントロールや脾臓マクロファージと比較して高いことを実証することにより、vGLUT1抗体を試験しました(図1B-E)
さらに、小脳と嗅球のシナプスのミクログリアの飲み込みを比較しました(高いシナプス可塑性の別の基準として)20。その結果、海馬と比較して、嗅球からのミクログリアではvGLUT1蛍光シグナルが高く、小脳では低いシグナルが見出されました(図1F)。最も低いシグナル強度は脾臓マクロファージで検出され、内部ネガティブコントロールとして機能しました(図1E)。さらに、Vglut-IRES-Cre/ChR2-YFPマウスを使用して、vGLUT1抗体の免疫反応性をテストしました。YFPは、これらのマウスのグルタミン酸作動性ニューロンによって発現され、YFP陽性集団にはvGLUT1陽性画分も含まれるべきであることを示しています。この染色プロトコルを使用して、YFP陽性集団の98.7%をvGLUT1陽性として検出し、抗体の有効性を検証しました(補足図S3)。
全体として、これらの結果は、vGLUT1抗体と提示された染色プロトコルの効率を検証しています。このプロトコルと抗体は、他の実験的アプローチと比較して、シナプスの in vivo*飲み込みをハイスループットかつ迅速に定量するために自信を持って使用できることを示しています。
次に、in vitro法に移り、成体ミクログリアを単離し、同じ動物から単離した新たに分離したpHrodo Red標識シナプトソームとインキュベートして、in vitroでの飲み込みを定量しました(図2A)。シナプトソームをpHrodo Redで標識すると、酸性の周囲のpH21で蛍光シグナルが自然に増加します。我々は新たにシナプトソームを単離し、それらを異なるpH値(pH = 4およびpH = 11)に曝露した。原理証明実験として低pHでの蛍光シグナルの増加を確認した後(図2B)、これらのシナプトソームを新たに単離したミクログリアと1.5〜2時間インキュベートしました。コントロールとして、ミクログリアを非標識シナプトソームとインキュベートしました。次に、CD11b++/CD45+ミクログリア由来のpHrodo Red-PE蛍光シグナルを解析し、pH = 4でシナプトソームから得られるものと同等の正のPE蛍光を観察しました(図2C)。したがって、この方法は、シナプトソームのin vitroエンベロープの高速かつハイスループットな解析を提供し、必要な最適化ステップに従って、アミロイドプラークや他の潜在的なターゲットのエンベロープに拡張することができます。実際、Rangarajuらは、同様のフローサイトメトリーベースのアプローチを用いて、ミクログリアによるアミロイドベータの巻き込みを定量化した22。結論として、これら 2 つの方法は、in vivo* と in vitro の両方で、シナプスのミクログリア巻き込みの堅牢で効率的、かつハイスループットな定量を提供します。

図1:vGLUT1+ シナプスのミクログリア包みのin vivo*の解析。 (A)細胞内vGLUT1染色のステップを示す実験ワークフローの図解。(B)海馬からの単一/CD11b++/CD45+/生細胞集団を定義するためのゲーティング戦略。この集団は、vGLUT1-MFIの分析と、海馬におけるvGLUT1+ ミクログリアの割合の定量化に使用されました。赤い長方形で示されているゲートは、全サンプル中のvGLUT1+ 細胞分率を示しています。(C)ヒストグラムはvGLUT1-PEの蛍光強度を示しています。(D)赤色の長方形で示されているゲートは、アイソタイプ-PE免疫反応性を示す陽性細胞画分がないことを示しています。ヒストグラムは、Isotype-PE蛍光強度を示しています。(E)赤四角で示されたゲートは、脾臓マクロファージにおいてvGLUT1-PE免疫反応性を示す陽性細胞画分がないことを示しています。ヒストグラムはvGLUT1-PE蛍光強度を示しています。ヒストグラムに示されているゲートは、脾臓からの vGLUT1-MFI が終了するレベル (~104) から始まり、脳サンプル中の vGLUT1 陽性画分を分析するために使用されます。(F)重ね合わせたヒストグラムは、脾臓マクロファージ(灰色)と海馬(赤)、小脳(紫)、嗅球(水色)のミクログリアのPE蛍光強度の比較を示しています。 この図の拡大版を表示するには、ここをクリックしてください。

図2:in vitroでのシナプトソームシナプスのミクログリア巻き込みの分析 (A)in vitroシナプトソーム巻き込みアッセイのステップを示す実験ワークフローの図解。(B)2つの異なるpH値でインキュベートされたシナプトソームは、pH = 11で低いpHrodo Red-PE蛍光シグナルを示し、pH = 4で高いpHrodoRed-PE蛍光を示します。(C)単一/CD11b++/CD45+細胞集団を用いて、pHrodo Red-PE蛍光強度を分析した。未染色のシナプトソームとインキュベートしたミクログリアをネガティブコントロールとして使用した。この図の拡大版を表示するには、ここをクリックしてください。
表1:このプロトコルで使用されるバッファと試薬のリスト。この表をダウンロードするには、ここをクリックしてください。
補足図S1:分離されたばかりの成体ミクログリアの代表画像。 パパインベースの組織解離プロトコルとCD11b +ミクログリアのMACSベースの単離に続いて、20倍対物レンズを備えた光学顕微鏡を使用して取得した画像。スケールバー = 50 μm. このファイルをダウンロードするには、ここをクリックしてください。
補足図S2:脾臓マクロファージを定義するためのゲーティング戦略を示す代表的なFACSプロット。 脾臓は、海馬のシナプスのミクログリア巻き込みをテストしながら、実験の実行ごとに実験で陰性コントロールとして使用されました。上記のFACSプロットは、脾臓マクロファージをCD11b ++/CD45++/生存可能な集団として定義しています。この集団は、この閾値ゲートより上に存在する脳サンプル中のvGLUT1+ ミクログリアを定量化するための閾値を設定するために使用されました。 このファイルをダウンロードするには、ここをクリックしてください。
補足図S3:vGLUT1抗体の効率をテストするためのゲーティング戦略を示す代表的なFACSプロット。 (A)vGLUT1染色のステップを示す実験ワークフローの図解。YFP+ グルタミン酸作動性ニューロンを用いて、vGLUT1抗体の免疫反応性を試験しました。(B)vGLUT1 FACS抗体の効率をテストするためのポジティブコントロールとして使用されたVglut-IRES-Cre//ChR2-YFPマウスの海馬からYFP+ 集団を定義するためのゲーティング戦略。YFP+ フラクションは、グルタミン酸作動性シナプスを特定するためにゲートされました。この集団では、vGLUT1抗体の免疫反応性を分析して、抗体の免疫反応性をテストしました。(C)アイソタイプコントロールと比較;YFP陽性細胞画分の97.9%が(D)vGLUT1陽性として検出されます。(E)重ね合わせヒストグラムは、アイソタイプとvGLUT1抗体のPE蛍光の比較を示しています。 このファイルをダウンロードするには、ここをクリックしてください。
ディスカッション
ミクログリアとシナプスの相互作用によるシナプスの微細化は、神経免疫学の分野における興味深い研究分野であり、神経変性疾患および神経発達障害におけるミクログリアの役割について有望な洞察を提供しています。2011年。Paolicelliらは、ミクログリア内にシナプス物質が存在する証拠を提供し、シナプス包み込みのプロセスへの関与を明らかにしました4。別の興味深い研究では、タイムラプスイメージングと ex vivo 器官型脳スライス培養モデルを採用し、ミクログリアがトロゴサイトーシスとして知られる食作用プロセスに関与し、シナプス構造全体ではなくシナプス前構造を飲み込むことを報告しました23。無傷の組織における食作用の測定を可能にする新しいトランスジェニックマウスモデルを用いたごく最近の論文では、運動学習時にBergmann-glia がin vivo で刈り込みを行うことが示された24。したがって、ミクログリアを含むシナプス包み込みにおけるグリア細胞の関与を示す十分な証拠があります。しかし、このミクログリア機能がシナプス刈り込みの動的で選択的なプロセスにどの程度影響を与えるかについては、さらなる証拠が必要です。
それにもかかわらず、シナプスのミクログリア巻き込みの定量化は貴重な指標として機能し、ミクログリアとシナプスの相互作用、特にシナプスの微細化の複雑なダイナミクスへの部分的な洞察を提供します。包括的なレビューでは、シナプスのミクログリアの飲み込みを調査するために使用されている現在のプロトコルがまとめられています25。私たちのプロトコルは、すでに使用されている既存のプロトコルに基づいて最適化されていることを強調したいと思います。この研究で提示された方法は、さまざまな解剖された脳領域のシナプスのミクログリア包みを迅速かつハイスループットで定量化します。脳の領域にもよりますが、どちらの方法論でも最大2日間で少なくとも10,000個のミクログリア細胞を解析することが可能であり、複数のマウスモデルを並行して試験する価値があります。
私たちは、vGLUT1+ ミクログリアの定量化には、固定ステップまでの in vivo および短期間の ex vivo 飲み込みの両方が含まれていることを認識しています。したがって、私たちのアッセイは、IHCなどのアプローチを使用して in vivo 検証に先立つ最初のステップとして、ミクログリア内のシナプス物質を定量するための迅速で信頼性の高い方法を提示することを示唆しています。
フローサイトメトリー解析のもう一つの欠点は、シナプスマーカー、特に抑制性シナプスに対する抗体の利用可能性が限られていることです。これらのマーカーに対して明るいシグナルを示す市販の直接標識抗体を見つけることは困難です。シナプスマーカーを標的とするさまざまな抗体の試験には膨大な最適化時間が必要であるため、この研究で行っているように、さまざまな抗体による細胞内染色のための最適化された手順を科学界と共有することが重要です。
本研究におけるデータ解析に関しては、vGLUT1抗体の非特異的結合を説明するために、Isotypeコントロールをテクニカルネガティブコントロールとして用いたが、これは、フローサイトメトリーベースのアッセイを最適化しながら、サンプル中の抗体の非特異的結合の推定値を提供するからである26。しかし、アイソタイプコントロールは、表面染色手順からの非特異的バックグラウンドシグナルを検出するために大部分が最適化されており、細胞内染色コントロールには最適ではない27,28。したがって、抗原検出、自家蛍光、および蛍光色素の輝度に影響を与える可能性のある固定および透過化ステップを含む細胞内染色を行う際に、ネガティブ集団とポジティブ集団を区別するためにそれらに頼るべきではない29。このような細胞内染色手順では、細胞内マーカー29について染色された陽性細胞集団を定義するために、適切な生物学的内部コントロールの使用が必要である。したがって、細胞内染色プロトコルを使用することを考慮して、内部生物学的陰性コントロール(脾臓マクロファージ)を採用し、同じマウスから単離された脾臓マクロファージに従って陽性集団と陰性集団の間の境界を定義しました。ゲートの上の陽性集団を区別し、vGLUT1陽性事象が存在しないゲートでは、生物学的陰性コントロールとして機能する脾臓マクロファージから分離しました(図1)。
この研究で提示された両方の方法は、シナプスのミクログリア包み込みを迅速かつハイスループットな方法で初期分析するための大きな可能性を提供し、小さな脳領域からの10,000を超える細胞を分析しますが、これは標準的な顕微鏡技術では達成できません。したがって、これらの方法は、労力と時間のかかる方法に比べて大きな利点を提供し、さらに、より多くのミクログリアの分析を可能にすることにより、シナプス包みのより包括的な分析を提供します。さらに、この研究で提示された in vitro 法は、シナプスのミクログリア包みに対するさまざまな処理の影響をテストするのに特に有用です。これにより、他の細胞タイプに関連する交絡因子を使用せずに、ミクログリアに対する治療の効果を直接定量化できます。さらに、シナプス包み込みのプロセスに対する微小環境または他の細胞タイプの潜在的な影響を証明するための間接的なアプローチとしても機能します。したがって、これらの方法は、特に並行して使用すると、シナプス材料のミクログリア包みの分析に直感的で有利な代替手段を提供すると結論付けています。
しかし、FACSベースの食作用アッセイによる新たに単離されたミクログリアのex vivoによる分析には、いくつかの欠点が生じる可能性があります。まず、ミクログリアのex vivo活性化とストレス応答を回避しながら、成体の脳から新たに分離されたミクログリアを生成する、十分に最適化されたプロトコルを採用することが重要です。Dissing-Olesenらは、37°C30での組織解離手順を採用することにより、この問題を克服するために転写および翻訳阻害剤の使用を組み込んだ。一方、Matteiらは、ストレス関連遺伝子16のex vivo発現を誘導しないようにするための冷たく機械的な組織解離プロトコルを提示し、最初のセクションでこのプロトコルを適応させて、細胞内vGLUT1染色前のストレス関連ミクログリア応答のex vivo活性化を回避しました。パパインベースの組織解離後のミクログリアの高収率を考慮して、in vitroシナプトソーム包み込みアッセイの前の2番目のセクションで酵素組織解離プロトコルを採用しました(データは示していません)。ミクログリアは、シナプトソームとインキュベートすると、培養条件下では必然的に37°Cに留まり、37°Cでのインキュベーションは、すべてのin vitroアッセイおよび細胞培養手順に共通する欠点として、実際にミクログリアに変化を誘発する可能性があります。したがって、シナプスのミクログリア飲み込みに関してより広範な結論に達するために、提示された両方のプロトコルを並行して使用することをお勧めします。
さらに、これらのマーカーを発現する脳実質内の他の免疫細胞の存在を考慮に入れることにより、CD11b ++/CD45+ ミクログリアを選択するためのゲーティング戦略を慎重に定義することが重要である31。さらに重要なことは、ミクログリアを特異的に標的とするマーカー(例えば、TMEM119、P2RY12)を選択する際には、病理学的および炎症状態中に発現レベルが変化する可能性があることを考慮することが重要であり32、そのような変化は、シナプスのミクログリアの飲み込みを定量化するためのFACSパネルを確立する前に考慮されるべきである。最後に、IHCおよび顕微鏡法に基づく in vivo アプローチを含む、前述のいずれの方法も、単独ではミクログリアによるシナプスの能動的かつ選択的な刈り込みを捉えることはできないことを強調することが重要です。これらの方法では、ミクログリアによる能動的な剪定と、脳実質内のシナプス残骸の受動的な清掃を区別することはできません。したがって、データを評価して議論する際には、これらの異なる概念を明確に区別することが不可欠です。
開示事項
著者は、競合する利益を宣言しません。
謝辞
ミクログリアの分離に関する技術支援を提供してくださったRegina Piske氏と、 補足図S1の顕微鏡画像取得を支援してくださったCaio Andreta Figueiredo博士に感謝します。MDCのFACSファシリティの技術サポートに感謝します。この原稿は、2024年にBrain, Behavior and Immunity Journalに投稿された代表的な数値を部分的に示しています。 図 1A、 図 2A、および補足図 S3A は、BioRender.com を使用して作成されました。
資料
| Name | Company | Catalog Number | Comments |
| 1 mL Dounce Homogenizer | Active Motif | Cat# 40401 | |
| 5 mL Tubes | Eppendorf | Cat# 0030119452 | |
| Anti-CD11b | ThermoFisher Scientific | Cat# 25-0112-82 | |
| Anti-CD45 | BD | Cat# 559864 | |
| Anti-Ly6C | BD | Cat# 553104 | |
| Anti-Ly6G | BD | Cat# 551460 | |
| BCA Protein Assay Kit | Pierce | Cat# 23227 | |
| C-Tubes | Miltenyi Biotech | Cat# 130-096-334 | |
| CD11b MicroBeads | Miltenyi Biotech | Cat# 130-093-634 | |
| CD16/CD32 Antibody | Thermo Fisher Scientific | Cat#14-0161-82 | |
| Cytofix/Cytoperm Kit | BD | Cat# 554714 | |
| Dulbecco's Modified Eagle Medium (DMEM) | Gibco | Cat# 41966029 | |
| Dulbecco´s Phosphate Buffered Saline (DPBS) | Gibco | Cat# 14190144 | |
| Falcon Round-Bottom Polystyrene Test Tubes | Thermo Fisher Scientific | Cat# 08-771-23 | |
| fixable viability dye | Thermo Fisher Scientific | Cat# L34969 | |
| Hibernate A medium | ThermoFisher | Cat# A1247501 | |
| LS-columns | Miltenyi Biotech | Cat# 130-042-401 | |
| Papain Dissociation System | Worthington | Cat# LK003150 | |
| Percoll | Th.Geyer | Cat# 17-0891-02 | |
| Petri dishes | Thermo Fisher Scientific | Cat# 11339283 | |
| pHrodoRed | Thermo Fisher Scientific | Cat# P36600 | |
| Protease inhibitor | Roche | Cat# 5892970001 | |
| Red Blood Cell Lysis Buffer | Sigma | Cat# 11814389001 | |
| Steritop E-GP Sterile Filtration System | Merck | Cat# SEGPT0038 | |
| SynPer Solution | ThermoFisher | Cat# 87793 | |
| vGLUT1 Antibody | Miltenyi Biotech | Cat# 130-120-764 |
参考文献
- Wolf, S. A., Boddeke, H. W., Kettenmann, H. Microglia in physiology and Disease. Annu Rev Physiol. 79, 619-643 (2017).
- Hanisch, U. K., Kettenmann, H. Microglia: active sensor and versatile effector cells in the normal and pathologic brain. Nat Neurosci. 10 (11), 1387-1394 (2007).
- Tremblay, M. È, Lowery, R. L., Majewska, A. K. Microglial interactions with synapses are modulated by visual experience. PLoS Biol. 8 (11), e1000527(2010).
- Paolicelli, R. C., et al. Synaptic pruning by microglia is necessary for normal brain development. Science. 333 (6048), New York, N.Y. 1456-1458 (2011).
- Schafer, D. P., et al. Microglia contribute to circuit defects in Mecp2 null mice independent of microglia-specific loss of Mecp2 expression. eLife. 5, e15224(2016).
- Schafer, D. P., et al. Microglia sculpt postnatal neural circuits in an activity and complement-dependent manner. Neuron. 74 (4), 691-705 (2012).
- Filipello, F., et al. The microglial innate immune receptor TREM2 is required for synapse elimination and normal brain connectivity. Immunity. 48 (5), 979-991 (2018).
- Salter, M. W., Stevens, B. Microglia emerge as central players in brain disease. Nat Med. 23 (9), 1018-1027 (2017).
- Hong, S., et al. Complement and microglia mediate early synapse loss in Alzheimer mouse models. Science. 352 (6286), New York, N.Y. 712-716 (2016).
- Di Liberto, G., et al. Neurons under T cell attack coordinate phagocyte-mediated synaptic stripping. Cell. 175 (2), e19 458-471 (2018).
- Bisht, K., et al. Dark microglia: A new phenotype predominantly associated with pathological states. Glia. 64 (5), 826-839 (2016).
- Weerasinghe-Mudiyanselage, P. D. E., et al. Structural plasticity of the hippocampus in neurodegenerative diseases. Int J Mol Sci. 23 (6), 3349(2022).
- Aw, E., Zhang, Y., Carroll, M. Microglial responses to peripheral type 1 interferon. J Neuroinflammation. 17 (1), 340(2020).
- Brioschi, S., et al. Detection of synaptic proteins in microglia by flow cytometry. Front Mol Neurosci. 13, 149(2020).
- Norris, G. T., et al. Neuronal integrity and complement control synaptic material clearance by microglia after CNS injury. JEM. 215 (7), 1789-1801 (2018).
- Mattei, D., et al. Enzymatic dissociation induces transcriptional and proteotype bias in brain cell populations. Int J Mol Sci. 21 (21), 7944(2020).
- Jaszczyk, A., Stankiewicz, A. M., Juszczak, G. R. Dissection of mouse hippocampus with its dorsal, intermediate and ventral subdivisions combined with molecular validation. Brain Sci. 12 (6), 799(2022).
- Fixable viability dyes for flow cytometry. Thermo Fisher Scientific. , Available from: https://www.thermofisher.com/de/de/home/life-science/cell-analysis/flow-cytometry/flow-cytometry-assays-reagents/cell-viability-assays-flow-cytometry/fixable-viability-dyes-flow-cytometry.html (2024).
- SynPER synaptic protein extraction reagent. Thermo Fisher Scientific. , Available from: https://www.thermofisher.com/order/catalog/product/87793?gclid=CjwKCAiAi6uvBhADE_iwAWiyRdigrNHuDkIAVVsaW8OaC3VJNgrPEm1I64E2P BZA8X_A_0ipFr_suIxoCDm8QAvD_BwE&ef_id=Cjw KCAiAi6uvBhADEiwAWiyRdigrNHuDkIAVVsaW8OaC 3VJNgrPEm1I64E2PBZA8X_A_0ipFr_suIxoCDm8QA vD_BwE:G:s&s_kwcid=AL!3652!3!606658601747!e!! g!!syn per!13368767883!123500396056&cid=bid_pca _ppf_r01_co_cp1359_pjt0000_bid00000_0se_gaw_bt _pur_con&gad_source=1#/87793 (2024).
- Wu, A., Yu, B., Komiyama, T. Plasticity in olfactory bulb circuits. Curr Opin Neurol. 64, 17-23 (2020).
- pHrodo indicators for pH determination. Thermo Fisher Scientific. , Available from: https://www.thermofisher.com/de/de/home/brands/molecular-probes/key-molecular-probes-products/phrodo-indicators.html (2024).
- Rangaraju, S., et al. Differential phagocytic properties of CD45low microglia and CD45high brain mononuclear phagocytes-activation and age-related effects. Front Immunol. 9, 405(2018).
- Weinhard, L., et al. Microglia remodel synapses by presynaptic trogocytosis and spine head filopodia induction. Nat Commun. 9 (1), 1228(2018).
- Morizawa, Y. M., et al. Synaptic pruning through glial synapse engulfment upon motor learning. Nat Neurosci. 25 (11), 1458-1469 (2022).
- Morini, R., et al. Strategies and tools for studying microglial-mediated synapse elimination and refinement. Front. Immunol. 12, 640937(2021).
- Maecker, H. T., Trotter, J. Flow cytometry controls, instrument setup, and the determination of positivity. Cytometry. Part A: J. Int Soc Anal Cytol. 69 (9), 1037-1042 (2006).
- Easthope, E. Strategies for intracellular flow cytometry success. , Available from: https://www.biocompare.com/Editorial-Articles/582159-Strategies-for-Intracellular-Flow-Cytometry-Success/ (2022).
- Paduano, F. Isotype control antibodies, Key points. , Available from: https://www.antibodies.com/primary-antibodies/isotype-control-antibodies#:~:text=Isotype%20controls%20should%20be%20used,the%20primary%20antibody%20and%20fluorophore (2024).
- Flow cytometry intracellular staining controls. Bio-Rad. , Available from: https://www.bio-rad-antibodies.com/flow-cytometry-intracellular-controls.html (2024).
- Dissing-Olesen, L., et al. FEAST: A flow cytometry-based toolkit for interrogating microglial engulfment of synaptic and myelin proteins. Nat Commun. 14, 6015(2023).
- Jurga, A. M., Paleczna, M., Kuter, K. Z. Overview of general and discriminating markers of differential microglia phenotypes. Front Cell Neurosci. 14, 198(2020).
- van Wageningen, T. A., et al. Regulation of microglial TMEM119 and P2RY12 immunoreactivity in multiple sclerosis white and grey matter lesions is dependent on their inflammatory environment. Acta Neuropathol Commun. 7 (1), 206(2019).
転載および許可
このJoVE論文のテキスト又は図を再利用するための許可を申請します
許可を申請さらに記事を探す
This article has been published
Video Coming Soon
Copyright © 2023 MyJoVE Corporation. All rights reserved