교차 원통형 흐름: 압력 분포 측정 및 항력 계수 추정
Overview
출처: 데이비드 구오, 공학, 기술 및 항공 대학 (CETA), 서던 뉴 햄프셔 대학 (SNHU), 맨체스터, 뉴햄프셔
교차 원통형 흐름에 대한 압력 분포 및 드래그 추정은 수세기 동안 조사되었습니다. 이상적으로 는 잠재적 흐름 이론에 의하면 실린더 주변의 압력 분포는 수직대칭입니다. 실린더의 압력 분포상류와 하류도 대칭으로 제로네트 드래그 력을 생성합니다. 그러나 실험 결과는 매우 다른 흐름 패턴, 압력 분포 및 드래그 계수를 산출합니다. 이는 이상적인 무의미한 잠재적 이론이 관제 흐름을 가정하기 때문에 흐름 패턴을 결정할 때 점도가 고려되거나 고려되지 않기 때문입니다. 이것은 현실과 크게 다릅니다.
이 데모에서는 풍동이 지정된 공기 속도를 생성하는 데 활용되며, 압력 포트가 24개인 실린더를 사용하여 압력 분포 데이터를 수집합니다. 이 데모는 원형 실린더 주위를 흐르는 실제 유체의 압력이 이상적인 유체의 잠재적 흐름에 따라 예측된 결과와 어떻게 다른지 보여줍니다. 드래그 계수도 예상값과 비교하여 추정됩니다.
Procedure
1. 실린더 주위의 압력 분포 측정
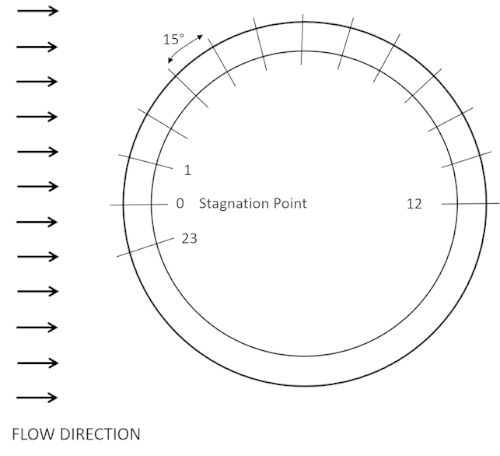
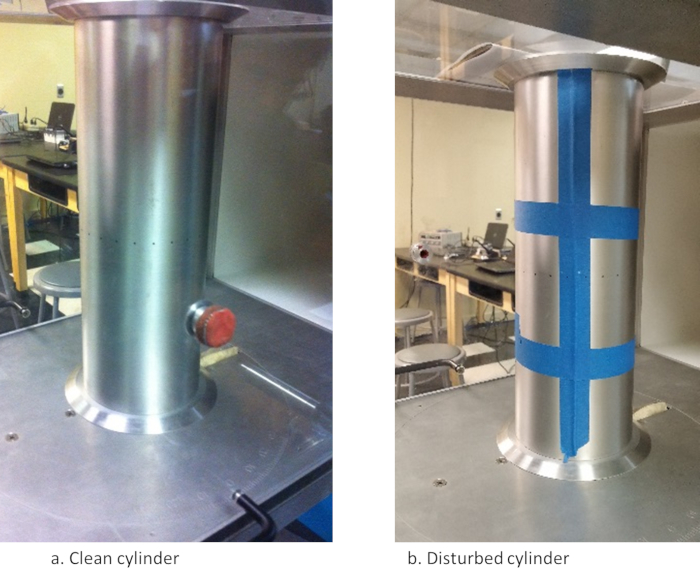
- 풍동의 테스트 섹션의 상단 덮개를 제거하고 턴테이블(그림3)에24개의 내장 포트가 있는 깨끗한 알루미늄 실린더(d = 4인치)를 장착합니다. 포트 0이 업스트림을 향할 수 있도록 실린더를 설치합니다(그림4a).
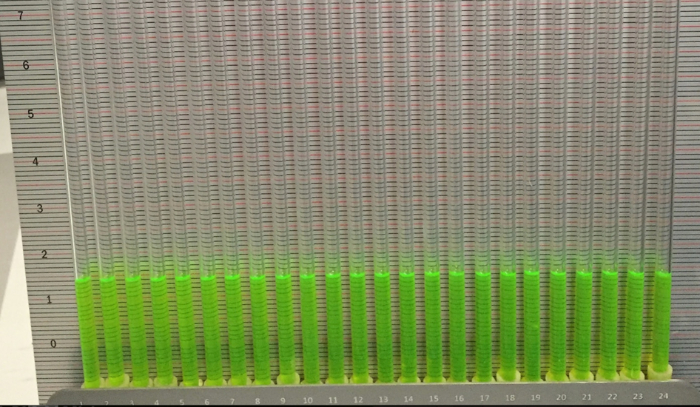
- 상단 덮개를 교체하고 0 - 23이라고 표시된 24개의 압력 튜브를 기마계 패널의 해당 포트에 연결합니다. 기마계 패널은 유색 기름으로 채워져야하지만 물에 표시해야합니다.
- 풍전을 켜고 60mph에서 실행합니다. 기마계를 읽으면서 24개의 압력 측정을 모두 기록합니다. 이 비행 속도에서 레이놀즈 번호는 1.78 x 10⁵입니다. 예상 유동 패턴은 도 2d에표시됩니다.
Results
깨끗하고 방해된 실린더에 대한 실험 결과는 각각 표 1과 2에표시됩니다. 데이터는 도 6에도시된 바와 같이 이상적이고 실제 흐름을 위해 압력 계수, Cp,각도 위치, θ 의 그래프로 플롯될 수 있다.