Flujo cilíndrico transversal: medición de la distribución de la presión y estimación de los coeficientes de arrastre
Visión general
Fuente: David Guo, College of Engineering, Technology, and Aeronautics (CETA), Southern New Hampshire University (SNHU), Manchester, New Hampshire
Las distribuciones de presión y las estimaciones de arrastre para el flujo cilíndrico cruzado se han investigado durante siglos. Mediante la teoría de flujo potencial inviscida ideal, la distribución de la presión alrededor de un cilindro es verticalmente simétrica. La distribución de presión aguas arriba y aguas abajo del cilindro también es simétrica, lo que resulta en una fuerza de arrastre de red cero. Sin embargo, los resultados experimentales producen patrones de flujo, distribuciones de presión y coeficientes de arrastre muy diferentes. Esto se debe a que la teoría potencial inviscida ideal asume el flujo irrotacional, lo que significa que la viscosidad no se considera ni se tiene en cuenta al determinar el patrón de flujo. Esto difiere significativamente de la realidad.
En esta demostración, se utiliza un túnel de viento para generar una velocidad de aire especificada, y se utiliza un cilindro con 24 puertos de presión para recopilar datos de distribución de presión. Esta demostración ilustra cómo la presión de un fluido real que fluye alrededor de un cilindro circular difiere de los resultados predichos en función del flujo potencial de un fluido idealizado. El coeficiente de arrastre también se estimará y se comparará con el valor predicho.
Procedimiento
1. Medición de la distribución de la presión alrededor de un cilindro
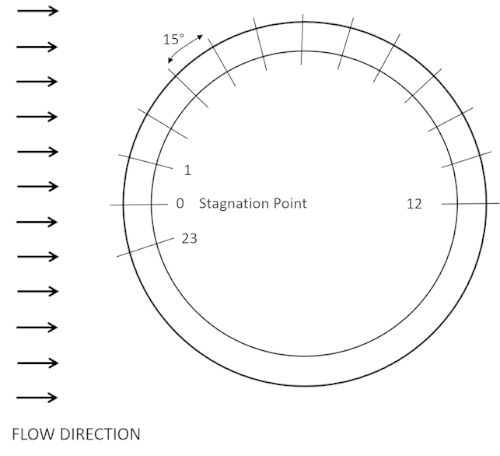
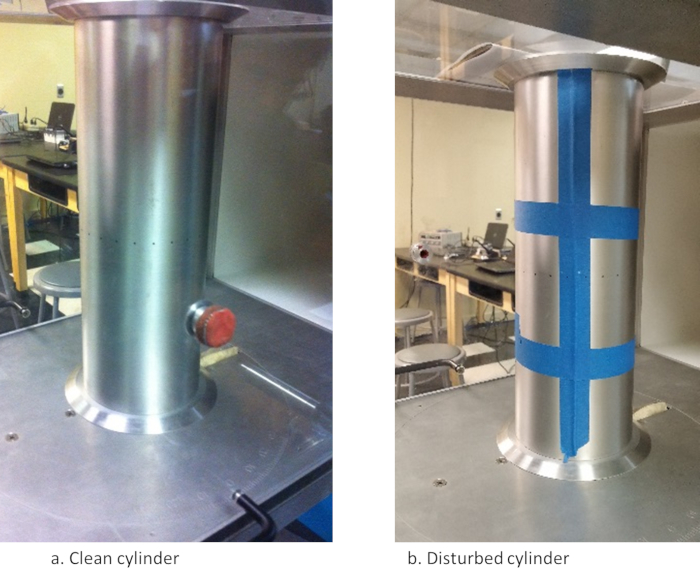
- Retire la cubierta superior de la sección de prueba de un túnel de viento y monte un cilindro de aluminio limpio (d 4 pulg.) con 24 puertos incorporados en un plato giratorio(Figura 3). Instale el cilindro de modo que el puerto cero esté orientado aguas arriba(Figura 4a).
- Vuelva a colocar la cubierta superior y conecte los 24 tubos de presión etiquetados 0
Resultados
Los resultados experimentales del cilindro limpio y perturbado se muestran en las Tablas 1 y 2,respectivamente. Los datos se pueden trazar en un gráfico del coeficiente de presión, Cp, frente a la posición angular, para un flujo ideal y real como se muestra en la Figura 6.


