Aby wyświetlić tę treść, wymagana jest subskrypcja JoVE. Zaloguj się lub rozpocznij bezpłatny okres próbny.
Method Article
Detection of MicroRNAs in Microglia by Real-time PCR in Normal CNS and During Neuroinflammation
W tym Artykule
Podsumowanie
Microglia are resident macrophages that provide the first line of defense and immune surveillance of the central nervous system. MicroRNAs are regulatory molecules that play an important role in many physiological processes including activation and differentiation of macrophages. In this article, we describe the method for measurement of microRNAs in microglia.
Streszczenie
Microglia are cells of the myeloid lineage that reside in the central nervous system (CNS)1. These cells play an important role in pathologies of many diseases associated with neuroinflammation such as multiple sclerosis (MS)2. Microglia in a normal CNS express macrophage marker CD11b and exhibit a resting phenotype by expressing low levels of activation markers such as CD45. During pathological events in the CNS, microglia become activated as determined by upregulation of CD45 and other markers3. The factors that affect microglia phenotype and functions in the CNS are not well studied. MicroRNAs (miRNAs) are a growing family of conserved molecules (~22 nucleotides long) that are involved in many normal physiological processes such as cell growth and differentiation4 and pathologies such as inflammation5. MiRNAs downregulate the expression of certain target genes by binding complementary sequences of their mRNAs and play an important role in the activation of innate immune cells including macrophages6 and microglia7. In order to investigate miRNA-mediated pathways that define the microglial phenotype, biological function, and to distinguish microglia from other types of macrophages, it is important to quantitatively assess the expression of particular microRNAs in distinct subsets of CNS-resident microglia. Common methods for measuring the expression of miRNAs in the CNS include quantitative PCR from whole neuronal tissue and in situ hybridization. However, quantitative PCR from whole tissue homogenate does not allow the assessment of the expression of miRNA in microglia, which represent only 5-15% of the cells of neuronal tissue. Hybridization in situ allows the assessment of the expression of microRNA in specific cell types in the tissue sections, but this method is not entirely quantitative. In this report we describe a quantitative and sensitive method for the detection of miRNA by real-time PCR in microglia isolated from normal CNS or during neuroinflammation using experimental autoimmune encephalomyelitis (EAE), a mouse model for MS. The described method will be useful to measure the level of expression of microRNAs in microglia in normal CNS or during neuroinflammation associated with various pathologies including MS, stroke, traumatic injury, Alzheimer's disease and brain tumors.
Protokół
1. Isolation of Microglia from Normal CNS
Isolation of microglia is performed as was described previously with modifications3.
- Prepare instruments for dissection and perfusion: scissors, forceps, 10 ml syringe with 27g needle, 15 ml Dounce homogenizer (Teflon/glass), 40 μm nylon cell strainer, 40% and 70% Percoll solutions, 1X PBS.
- Euthanize mice by quick asphyxiation (deprivation of oxygen) in CO2 camera and immediately transfer them to laboratory bench for surgical manipulations and perfusion.
- Perform surgical manipulations (use scissors and forceps and 70% ethanol as an antiseptic): open peritoneal cavity, cut the diaphragm, open chest cavity and snip the right atrium with scissors.
- Perform whole-body intracardial perfusion by injecting 10-ml syringe into left ventricle and applying pressure. Pass 8-10 ml of 1X PBS through the blood circulation at slow and steady pace.
- Repeat steps 1.2-1.4 for all mice in the group (typically 5-10 mice). After perfusion keep mouse on ice until all mice are perfused.
- After perfusion of all mice, dissect brains and spinal cords. (Optional: to study expression of miRNAs in different areas of the brain, dissect these specific areas such as cerebellum, hippocampus etc. for the group of 5-10 mice and pool them together for homogenization).
- Homogenize brains and spinal cords using 15-ml Dounce homogenizer. Place one brain and one spinal cord in homogenizer and add 5 ml of 1X PBS. Perform 10-20 gentle strikes; pass homogenate through cell strainer into 50 ml-conical tube and certificate at 2000 rpm on a big centrifuge 5-7 minutes.
- Discard supernatant, resuspend brain/spinal cord homogenate from 2-3 mice in 5-7 ml of 70% Percoll and overlay 7 ml of 40% Percoll. Spin at 2000 rpm (no brake!) for 30 minutes.
- Discard damaged cells/myelin debris on a top of 70% and collect mononuclear cells at 40%/70% interface. Dilute collected cells at least at a 1:1 with 1X PBS and spin at 2000 rpm for 5-7 minutes. Resuspend cells in 0.5 ml of PBS and transfer them into 1.7 ml ependorf tube. Typical yield is ~500 x 103 of mononuclear cells per mouse, which would give the number of microglial cells ~1x10⁶ in 0.5 ml for the preparation of the cells from brains and spinal cords of 2-3 mice.
2. Control of Purity of Microglia by Flow Cytometry
Staining with antibodies is performed as previously described with modifications7,8.
- Prepare FACS buffer (1X PBS with 2% FBS), FcR blocking antibodies, anti-CD11b-PE, anti-CD45-APC-Cy7 antibodies, 1% paraformaldehyde in PBS.
- Take 50 μl of the cells from step 1.9 and transfer them to new 1.7 ml Eppendorf tube and add 350 μl of FACS buffer.
- Add 5-10 μl of anti-FcR antibodies and incubate 10-15 minutes on ice.
- Split cells into two Eppendorf tubes. Add to one tube 1 μl of anti-CD11b-PE and 2 μl anti-CD45-APC-Cy7 antibodies and incubate 10-15 minutes on ice. Second tube will be used as a negative control for antibody staining. After incubation with antibodies add 1 ml of FACS buffer to both tubes and spin in small centrifuge at 5400 rpm for 5 min. After spinning fix the cells by resuspending them in 400 μl of 1% paraformaldehyde in PBS and vortexing.
- Perform flow cytometry analysis on flow cytometer (LSR II, BD Biosciences) using BD compubeads (BD Biosciences) for compensation controls as was described8. Examples of good and bad preparations are shown in Fig. 1a, b.
3. Isolation of Microglia and Peripheral Macrophages from Inflamed CNS in Mouse Model of Neuroinflammation
Experimental autoimmune encephalitis (EAE) is induced as was previously described in our paper7; FACS sorting is performed similarly to published protocol8.
- Induce EAE by subcutaneous immunization with 150 mg MOG35-55 peptide in 4 mg/ml complete Freund's adjuvant (CFA) of group of 5-10 of 8-12-week-old C57BL/6 mice. Pertussis toxin should be given i.p. (150 ng/mouse) on days zero and day two, post-immunization. Mice are observed for signs of disease starting on day 10 post-immunization, and disease severity is scored on a numerical scale from 0-5 as follows: 0) no disease; 1) weak tail or wobbly walk; 2) hind limb paresis; 3) hind limb paralysis; 4) hind and forelimb paralysis; and 5) death or euthanasia due to humane reasons. Mice at the peak of disease (d21 post-immunization) are used for experiment with typical disease score ranging from 1.5 to 2.5.
- Isolate mononuclear cells from CNS of group of 5-10 mice as in steps 1.1-1.4 and stain the cells with anti-CD11b and anti-CD45 antibodies as in steps 2.1-2.4. In step 2.4 do not fix cells, instead resuspend them in 400 μl of 1X PBS instead of 1% paraformaldehyde.
- Cell sorting is performed by FACSAria for populations of CD11b+CD45low microglia and CD11b+CD45hi cells (~80% of them are peripheral macrophages and ~20% of them are activated microglia3; in the future we will refer these cells as "macrophages"). Use 1.7-ml ependorf tubes for collection of the samples. 300 μl of 1X PBS with 10% FBS should be added to the collection tubes to prevent damage of the sorted cells. Examples of three populations of microglia, macrophages, and lymphocytes are shown in Fig. 2a with proper sorting gate settings shown in Fig. 2b. Typical sorting purities were at 98-100% as determined by reanalyzing sorted populations of microglia (Fig. 2c) and macrophages (Fig. 2d). Typical yield is 20-50 x103 for microglia and 50-100 x103 for macrophages isolated from the group of five mice.
4. Isolation of RNA
RNA will be isolated using the mirVana kit according to the manufacturer's instructions with modifications.
- Spin microglia from normal CNS from step 1.9 or sorted subsets of microglia and macrophages from step 3.3 in 1.7-ml Eppendorf tubes at 5400 rpm for 5-7 minutes in small centrifuge, carefully discard supernatant and freeze the cell pellets on dry ice. Proceed to step 4.2 or transfer frozen cell pellets to -70 C, where it can be stored for 2-3 months.
- Transfer frozen cell pellets to regular ice for thawing. Add 300 μl of Lysis Buffer from mirVana kit and gently mix by pipeting 5-7 times.
- Add 30 μl of Homogenate Additive from mirVana kit, vortex 30 seconds to mix, keep on ice for 10 minutes
- Add 300 μl of Acid-Pehnol:Chloroform from mirVana kit, vortex 30 seconds, spin for 5 min at 10,000 rpm on small centrifuge.
- Carefully take upper aqueous phase (300 μl) and transfer to another 1.7 ml Eppendorf tube, mix with 375 μl of 100% ethanol, transfer to filter cartridge from mirVana kit and spin for 1 min at 10,000 rpm.
- Discard flow-through buffer, add 700 μl of Wash solution I from mirVana kit, and spin for 1 min at 10,000 rpm.
- Wash two more times with 500 μl of Wash solution II from mirVana kit and finally elute RNA from cartridge with 60 μl of pre-heated nuclease-free water.
- The amount and quality of RNA is assessed using Nanodrop spectrophotometer. The concentration of RNA should be from 5 to 20 ng/ml and OD λ260/ λ280 ratio within the range 1.7-2.0. If concentration of RNA is lower than 3 ng/ml and OD 260λ/280λ is lower than 1.6, the samples are discarded. RNA samples can be stored at -70 °C for 6-12 months.
- For further estimation of quality of RNA, the samples are analyzed using gel electrophoresis in 15% TBE-Urea Gel (Life Technologies). Typical examples of good and bad quality of RNA preparations are shown in Fig. 3a and Fig.3b, respectively.
5. Detection of miRNA in Microglia and Macrophages
For analysis of miRNA expression, real-time quantitative reverse transcriptase PCR (qRT-PCR) analyses is carried out using TaqMan assays with primers and fluorescent probes for particular microRNA of interest and one of the ubiquitously expressed short RNAs (e.g. snoRNA-55, snoRNA-135 or U6) for normalization. Primers and fluorescent probes for particular sets of human or mouse miRNA can be purchased from Life Technologies Inc. Here we will use miR-124 as an example for miRNA of interest and snoRNA-55 as an example for normalization.
- Perform reverse transcriptase reaction to make cDNA from RNA samples using TaqMan reverse transcription kit:
| Item | Volume (μl) per sample |
| 5x RT Primer | 1.00 |
| RNA sample | 1.67 |
| RT Enzyme Mix | |
| 25 mM each (100 mM total) dNTPs | 0.050 |
| MultiScribe Reverse Transcriptase) | 0.333 |
| 10X RT Buffer | 0.500 |
| AB RNase Inhibitor | 0.063 |
| Nuclease-free water | 1.388 |
| Total | 5.00 |
Dilute RNA samples to concentration 3 ng/μl. Prepare RT Enzyme Mix and put 3.33 μL to PCR tubes and add 1.67 μl of RNA sample. Incubate in PCR Instrument (BioRad) at 16 °C for 30 min, 42 °C for 30 min, 85 °C for 5 min, and set at 4° C on hold.
- Perform real-time PCR reaction using TaqMan PCR mix:
| Item | Volume (μl) per sample |
| RT product | 1.0 |
| 2X TaqMan Master Mix | 5.0 |
| 5X Probe | 2.0 |
| Nuclease-free water | 2.0 |
| Total | 10.0 |
Use a 384-well clear optical reaction plate (Life Technologies) for each reaction and real-time PCR instrument AB 7900 HT. Cycling conditions: 95 °C for 10 min, [95 °C for 5 sec, 60 °C for 60 sec] x 40 cycles.
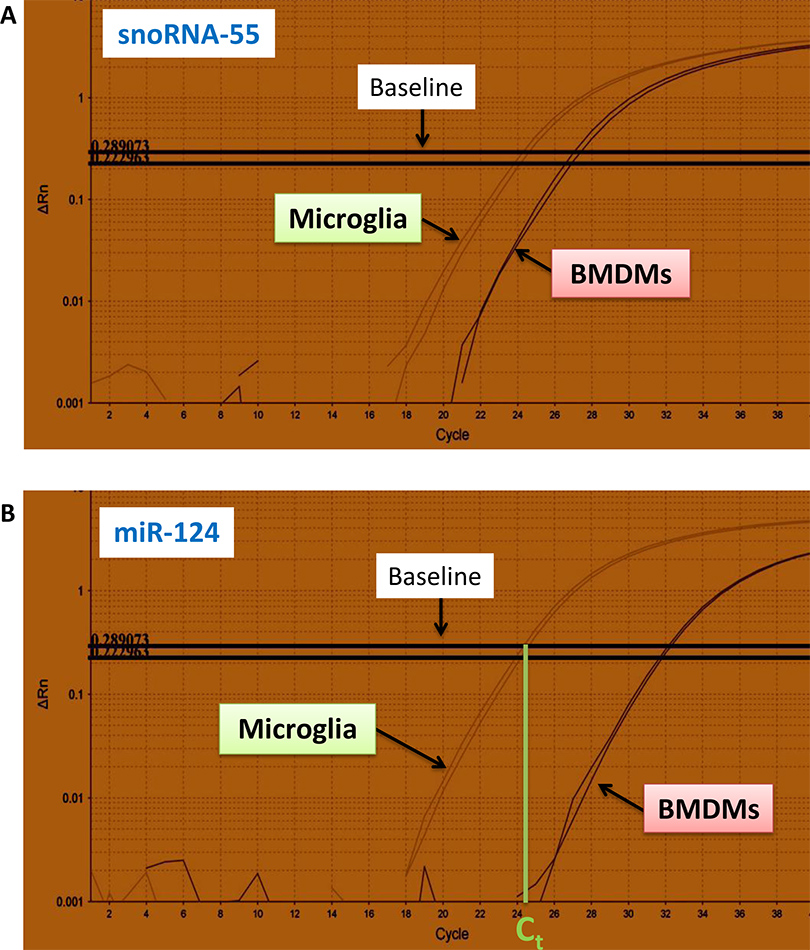
- Typical curves for the amount of fluorescently labeled specific PCR products (y-axes) for snoRNA-55 and miR-124 for RNA samples (each sample is in duplicates) isolated from microglia and bone marrow derived macrophages (BMDMs) vs. number of cycles (x-axes) are shown in Fig. 4a, b.
6. Normalization and Data Analysis
Relative expression levels for miRNA of interest (miR-124) are calculated using the ΔΔCT method as previously described7,9 using snoRNA-55 for normalization of the initial amount of RNA.
- The example of calculation of the relative level of miR-124 expression for microglia and BMDMs is shown in Table I.
- As a first step, Ct values for snoRNA-55 and miR-124 are determined for microglia and BMDMs from qRT-PCR curves (Fig.4; Table I, columns: snoRNA-55 and miR-124).
- As a second step, ΔCt values are calculated for each duplicate of each sample by subtraction of Ct for snoRNA-55 (normalization) from Ct for miR-124 (experiment) (Table I, columns: Ct (Norm), Ct(Exp), and ΔCt).
- As a third step. ΔΔCt values are calculated by subtraction of ΔCt of the reference sample (ΔCt(Ref)) from ΔCt values of other samples (Table I, column: ΔΔCt). One sample is defined as a reference; the relative level of miRNA expression for this sample will be defined as 1.0. All other samples will be compared to this reference sample. In our case, we define the level of miR-124 in the first sample for microglia as 1.0, therefore ΔCt(Ref)=0.49 (Table I, first row, marked in red).
- Finally, the relative level of expression is calculated as 2-ΔΔCt (Table I, column: miR-124 expression).
- All qRT-PCRs are performed in triplicates or in duplicates, and the relative level of expression is presented as mean ± standard deviations (S.D.) for triplicates (Fig. 5a,b) or as both duplicates side by side as shown in Fig. 5c.
7. Representative Results
Typical curves for real-time PCR and CT values for miR-124 (microRNA of interest) and snoRNA-55 (normalization) as well as relative levels of expression of miR-124 are shown in Fig. 4 and Table I. In our experiments we used snoRNA-55 as a control for normalization. As we mentioned above, other ubiquitous RNAs can be also used for normalization such as snoRNA-135 and U6.
The examples of the expression of miR-124 in adult microglia vs. bone-marrow derived macrophages (BMDMs) are shown in Fig. 5a (BMDMs were grown in the presence of M-CSF as described7). In Fig. 5b, we compared the expression of miR-124 in sorted populations of CD45low microglia vs. CD45hi macrophages. In both of these experiments we demonstrated that microglia are different from other macrophages by expressing higher levels of miR-124. Similar experiments can be performed in the future for kinetics of microglia activation in vivo or in vitro.
Expression of miR-124 in microglia isolated from CNS of C57BL/6 mice at different stages of development is shown in Fig. 5c. This data demonstrate that microglia in early stages of development express lower levels of miR-124, which correlated with their activated phenotype7. Similar analysis can be performed to study the functions of microglia in normal CNS such as comparison of expression of particular miRNAs in microglia isolated from different areas of the CNS: the cerebellum, spinal cord, hippocampus etc.

Figure 1. The examples of good and bad preparations of microglia as determined by flow cytometry. In the case of "good" isolation of microglia from normal CNS, 95-98% of the cells represent CD11b+CD45low microgla with 2-5% of CD11b+CD45hi perivascular macrophages. Less than 1% of CD11b-CD45hi lymphocytes or CD11b-CD45- astroglial or oligodendroglial cells or cell fragments should be present (a). The case of "bad" preparation is shown here (b) where 18% of contaminating CD11b-CD45- cells is present (b, lower left quadrant) suggesting insufficient Percoll gradient separation. In the case of good preparation, 95-98% of the cells should represent CD11b+CD45low microglia (a, upper left quadrant) , 2-5% of all cells should represent CD11b+CD45hi perivascular macrophages (a, upper right quadrant), and less than 1% of all cells should represent CD11b negative contaminating cells (a, lower left quadrant). In the case of "bad preparation", significant contamination of CD11b-CD45- cells or cell fragments (astroglia, myelin particles etc.) are present (b, lower left quadrant), which makes preparation of the cells unsuitable for RNA isolation and further analysis. In addition, CD11b-CD45hi cells could be also present in the case of "bad preparation" (b, lower right quadrant) indicating contamination by blood lymphocytes due to insufficient perfusion.

Figure 2. Flow cytometry analysis and sorting of populations of microglia and peripheral macrophages from diseased CNS. (a) During neuroinflammation three populations of the cells are present in the CNS: CD11b+CD45low (microglia), CD11b+CD45hi (macrophages), and CD11b-CD45hi (lymphocytes), as shown in the upper left, upper right and lower right quadrants, respectively. Gates for sorting populations of CD11b+CD45low microglia and CD11b+CD45hi macrophages are shown in (b) and the purities of reanalyzed sorted populations are shown in (c,d). Preliminary gating on viable cells based on FSC/SSC parameters was implemented.

Figure 3. Examples of "good" and "bad" qualities of RNAs isolated from microglia and analyzed by gel electrophoresis. In the case of good quality, RNA ladder and ribosomal RNA is evident (a). In the case of bad quality, smear, and low molecular weight degradation products are evident (b).

Figure 4. Real-time qRT-PCR curves for fluorescently labeled miR-124 and snoRNA-55 PCR products. Curves for snoRNA-55 (a) and miR-124 (b) are shown for microglia and bone-marrow derived macrophages (BMDMs). The experiment was performed in duplicates. Ct values were determined by the intersection of the baseline with the lower part of linear range of qRT-PCR curves as shown in (b). Click here to view larger figure.
| snoRNA-55 | miR-124 | DCt=Ct(Exp)-Ct(Norm) | DDCt=DCt-DCt(Ref) | Relative Level of Expression=2-DDCt | |
| Ct (Norm) | Ct(Exp) | DCt | DDCt | miR-124 Expression | |
| Microglia from normal CNS | 24.082 | 24.572 | 0.49(Ref) | 0 | 1.0 |
| 23.766 | 24.291 | 0.525 | 0.035 | 1.02 | |
| Bone-marrow derived macrophages (BMDMs) | 26.879 | 32.231 | 5.352 | 5.317 | 0.025 |
| 26.526 | 32.078 | 5.552 | 5.517 | 0.022 |
Table I. Calculation of relative levels of miR-124 expression in microglia vs. bone marrow derived macrophages based of Ct values for miR-124 (microRNA of interest) and snoRNA-55 (control for normalization).

Figure 5. Analysis of miR-124 expression in microglia and macrophages. Comparison of miR-124 expression in microglia from normal CNS vs. bone marrow derived macrophages (BMDMs) is shown in (a). Comparison of miR-124 in microglia vs. peripheral macrophages isolated from CNS of in mice with neuroinflammation is shown in (b). Changes in the level of expression of miR-124 in microglia during development in mice of 1, 2, and 4 weeks old when compared to adult mice (at 8 weeks old) is shown in (c). In (a, b) the experiment was performed in triplicate with mean ± S.D. of three separate PCR reactions shown. In (c) experiment was performed in duplicates as indicated.
Dyskusje
Recently significant interest was given to microglia and involvement of these cells in many pathologies associated with neuroinflammation and neurodegeneration. In addition, the role of microRNAs in the differentiation of immune and cancer cells has dramatically grown over the last several years5,10. We have previously reported the role of miR-124 in the maintenance of non-activated or resting phenotype of microglia in normal CNS7, but the role of the other types of microRNAs in microglia phenotype ...
Ujawnienia
No conflicts of interest declared.
Podziękowania
The work was supported by the NIH R01 NS071039-01A1 research grant.
Materiały
| Name | Company | Catalog Number | Comments |
| Name of the reagent | Company | Catalogue number | Comments |
| 1X PBS | GIBCO | 14190 | Can be prepared from dry components in the laboratory, pH: 7.2-7.4 |
| 10X PBS | Thermo Scientific | SH30258.02 | Can be prepared from dry components in the laboratory, pH: 7.2-7.4 |
| DMEM; FBS | GBCO | 11965; 10438 | |
| miRVana kit | Invitrogen | AM1561 | |
| Percoll | Sigma | P4937-500 ml | 100 ml of 100% Percoll is prepared by mixing 10 ml of 10X PBS and 90 ml of Percoll from Sigma.
50 ml of 70% Percoll is prepared by mixing of 35 ml of 100% Percoll and 15 ml of DMEM 50 ml of 40% Percoll is prepared by mixing 20 ml of 100% Percoll and 30 ml of 1X PBS |
| MOG35-55 peptide | AnaSpec Inc | 60130-5 | |
| CFA | DIFCO | 263810 | |
| Pertussis Toxin | Sigma | P7208 | |
| FcR blocking antibodies | BD Biosciences | 553142 | Clone 2.4G2 |
| Anti-CD11b-PE mAb | BD Biosciences | 553311 | Can be used with different fluorophores (e.g. AF488) |
| Anti-CD45-APC-Cy7 mABs | Biolegend | 103116 | Can be used with different fluorophores (e.g. APC) |
| Paraformaldehyde (16%) | EMS Inc | 15710 | Dilute 1:15 in 1X PBS |
| 15% TBE-Urea Gel | Life Technologies Inc. | EC68855BOX | |
| TaqMan MicroRNA Reverse Transcription Kit | Life Technologies Inc | 4366596 | |
| TaqMan Universal PCR Master Mix | Life Technologies Inc | 4304437 | |
| TaqMan MicroRNA Assays mmu-miR-124a | Life Technologies Inc | 4427975 ID 001182 | |
| TaqMan MicroRNA Assays snoRNA-55 | Life Technologies Inc | 4427975 ID 001228 | |
| Nuclease-free water | Life Technologies Inc | AM9937 | Nuclease-free water |
| 384-well clear optical reaction plate | Life Technologies Inc. | 4309849 | Can be substituted with other plates (e.g. 96 well plate) in different real-time PCR instruments |
| Dounce homogenizer (15 ml) | Wheaton Science Products. | 358044 | Teflon/glass |
| 40 μ nylon cell strainer | Falcon | 352340 | |
| Big centrifuge | Sorval | RT 6000B | Rotor diameter 18.5 cm |
| Small centrifuge | Eppendorf | 5415 R | Rotor diameter 6.5 cm |
| Real-time PCR Instrument | Life Technologies Inc. | AB 7900 HT | Can be substituted with other instruments |
| Flow cytometer | BD Biosciencess | LSR II | Can be substituted with other instruments |
| FACS | BD Biosciences | FACSAria | Can be substituted with other instruments |
| Nanodrop spectrophotometer | Thermo Scientific | Nanodrop 1000 |
Odniesienia
- Tremblay, M. E. The Role of Microglia in the Healthy Brain. J. Neurosci. 31, 16064-16069 (2011).
- Graeber, M. B., Li, W., Rodriguez, M. L. Role of microglia in CNS inflammation. FEBS Lett. , (2011).
- Ponomarev, E. D., Shriver, L. P., Maresz, K., Dittel, B. N. Microglial cell activation and proliferation precedes the onset of CNS autoimmunity. J. Neurosci. Res. 81, 374-389 (2005).
- Perruisseau-Carrier, C., Jurga, M., Forraz, N., McGuckin, C. P. miRNAs stem cell reprogramming for neuronal induction and differentiation. Mol. Neurobiol. 43, 215-227 (2011).
- McCoy, C. E. The role of miRNAs in cytokine signaling. Front Biosci. 17, 2161-2171 (2010).
- He, M., Xu, Z., Ding, T., Kuang, D. M., Zheng, L. MicroRNA-155 regulates inflammatory cytokine production in tumor-associated macrophages via targeting C/EBPbeta. Cell Mol. Immunol. 6, 343-352 (2009).
- Ponomarev, E. D., Veremeyko, T., Barteneva, N., Krichevsky, A. M., Weiner, H. L. MicroRNA-124 promotes microglia quiescence and suppresses EAE by deactivating macrophages via the C/EBP-alpha-PU.1 pathway. Nat. Med. 17, 64-70 (2011).
- Basu, S., Campbell, H. M., Dittel, B. N., Ray, A. Purification of Specific Cell Population by Fluorescence Activated Cell Sorting (FACS). J. Vis. Exp. (41), e1546-3791 (2010).
- Gabriely, G. MicroRNA 21 promotes glioma invasion by targeting matrix metalloproteinase regulators. Mol. Cell Biol. 28, 5369-5380 (2008).
- Caffarelli, E., Filetici, P. Epigenetic regulation in cancer development. Front Biosci. 17, 2682-2694 (2011).
- Cardona, A. E., Huang, D., Sasse, M. E., Ransohoff, R. M. Isolation of murine microglial cells for RNA analysis or flow cytometry. Nat. Protoc. 1, 1947-1951 (2006).
- Gordon, R. A simple magnetic separation method for high-yield isolation of pure primary microglia. J. Neurosci. Methods. 194, 287-296 (2011).
- Moltzahn, F., Hunkapiller, N., Mir, A. A., Imbar, T., Blelloch, R. High Throughput MicroRNA Profiling: Optimized Multiplex qRT-PCR at Nanoliter Scale on the Fluidigm Dynamic ArrayTM IFCs. J. Vis. Exp. (54), e2552 (2011).
Przedruki i uprawnienia
Zapytaj o uprawnienia na użycie tekstu lub obrazów z tego artykułu JoVE
Zapytaj o uprawnieniaThis article has been published
Video Coming Soon
Copyright © 2025 MyJoVE Corporation. Wszelkie prawa zastrzeżone