
Aby wyświetlić tę treść, wymagana jest subskrypcja JoVE. Zaloguj się lub rozpocznij bezpłatny okres próbny.
Method Article
Screening for Functional Non-coding Genetic Variants Using Electrophoretic Mobility Shift Assay (EMSA) and DNA-affinity Precipitation Assay (DAPA)
* Wspomniani autorzy wnieśli do projektu równy wkład.
W tym Artykule
Podsumowanie
We present a strategic plan and protocol for identifying non-coding genetic variants affecting transcription factor (TF) DNA binding. A detailed experimental protocol is provided for electrophoretic mobility shift assay (EMSA) and DNA affinity precipitation assay (DAPA) analysis of genotype-dependent TF DNA binding.
Streszczenie
Population and family-based genetic studies typically result in the identification of genetic variants that are statistically associated with a clinical disease or phenotype. For many diseases and traits, most variants are non-coding, and are thus likely to act by impacting subtle, comparatively hard to predict mechanisms controlling gene expression. Here, we describe a general strategic approach to prioritize non-coding variants, and screen them for their function. This approach involves computational prioritization using functional genomic databases followed by experimental analysis of differential binding of transcription factors (TFs) to risk and non-risk alleles. For both electrophoretic mobility shift assay (EMSA) and DNA affinity precipitation assay (DAPA) analysis of genetic variants, a synthetic DNA oligonucleotide (oligo) is used to identify factors in the nuclear lysate of disease or phenotype-relevant cells. For EMSA, the oligonucleotides with or without bound nuclear factors (often TFs) are analyzed by non-denaturing electrophoresis on a tris-borate-EDTA (TBE) polyacrylamide gel. For DAPA, the oligonucleotides are bound to a magnetic column and the nuclear factors that specifically bind the DNA sequence are eluted and analyzed through mass spectrometry or with a reducing sodium dodecyl sulfate polyacrylamide gel electrophoresis (SDS-PAGE) followed by Western blot analysis. This general approach can be widely used to study the function of non-coding genetic variants associated with any disease, trait, or phenotype.
Wprowadzenie
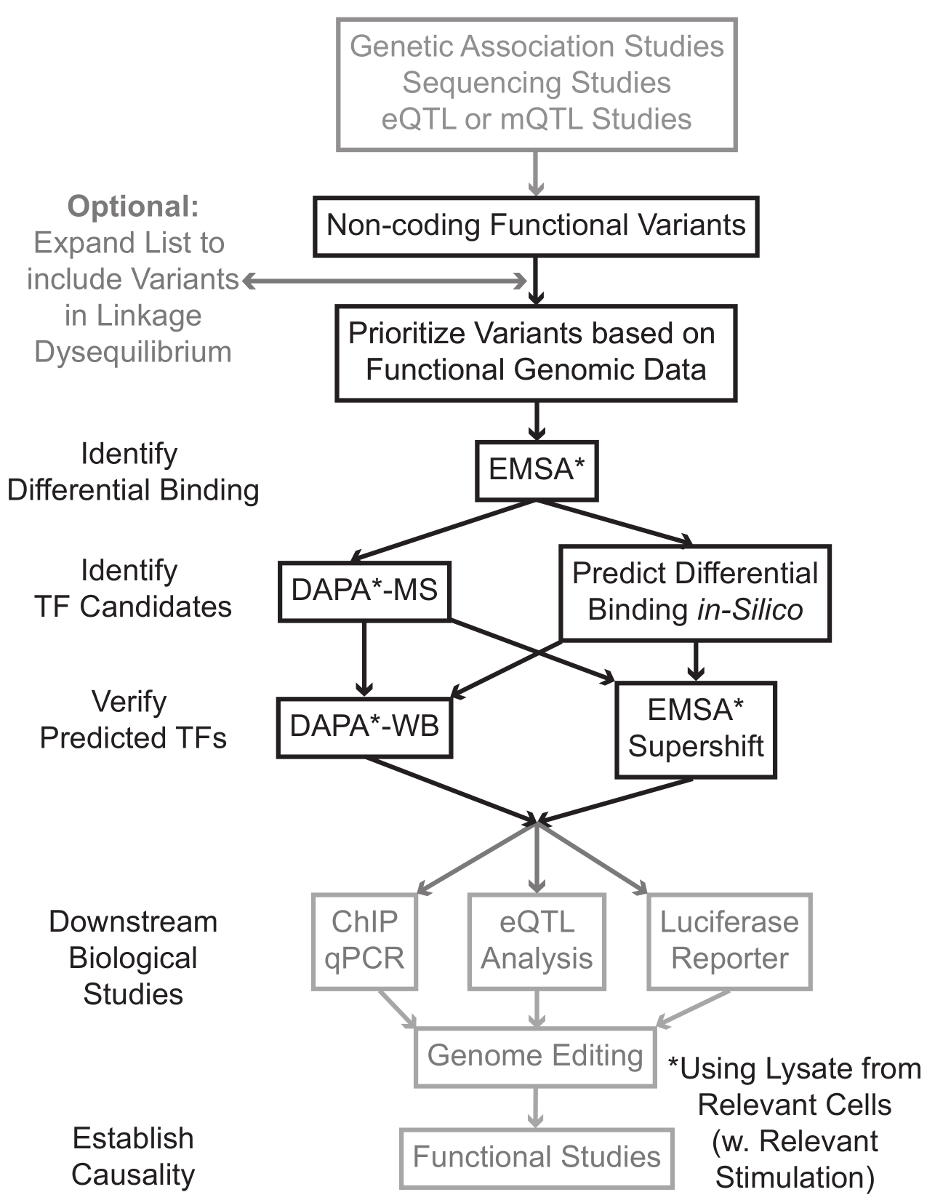
Sequencing and genotyping based studies, including Genome-Wide Association Studies (GWAS), candidate locus studies, and deep-sequencing studies, have identified many genetic variants that are statistically associated with a disease, trait, or phenotype. Contrary to early predictions, most of these variants (85-93%) are located in non-coding regions and do not change the amino acid sequence of proteins1,2. Interpreting the function of these non-coding variants and determining the biological mechanisms connecting them to the associated disease, trait, or phenotype has proven challenging3-6. We have developed a general strategy to identify the molecular mechanisms that link variants to an important intermediate phenotype – gene expression. This pipeline is specifically designed to identify modulation of TF binding by genetic variants. This strategy combines computational approaches and molecular biology techniques aimed to predict biological effects of candidate variants in silico, and verify these predictions empirically (Figure 1).

Figure 1: Strategic approach for the analysis of non-coding genetic variants. Steps that are not included in the detailed protocol associated with this manuscript are shaded in grey. Please click here to view a larger version of this figure.
In many cases, it is important to begin by expanding the list of variants to include all those in high linkage-disequilibrium (LD) with each statistically associated variant. LD is a measure of non-random association of alleles at two different chromosomal positions, which can be measured by the r2 statistic7. r2 is a measure of the linkage disequilibrium between two variants, with an r2 = 1 denoting perfect linkage between two variants. Alleles in high LD are found to co-segregate on the chromosome across ancestral populations. Current genotyping arrays do not include all known variants in the human genome. Instead, they exploit the LD within the human genome and include a subset of the known variants that act as proxies for other variants within a particular region of LD8. Thus, a variant without any biological consequence may be associated with a particular disease because it is in LD with the causal variant-the variant with a meaningful biological effect. Procedurally, it is recommended to convert the latest release of the 1,000 genomes project9 variant call files (vcf) into binary files compatible with PLINK10,11, an open-source tool for whole genome association analysis. Subsequently, all other genetic variants with LD r2 >0.8 with each input genetic variant can be identified as candidates. It is important to use the appropriate reference population for this step- e.g., if a variant was identified in subjects of European ancestry, data from subjects of similar ancestry should be used for LD expansion.
LD expansion often results in dozens of candidate variants, and it is likely that only a small fraction of these contribute to disease mechanism. Often, it is infeasible to experimentally examine each of these variants individually. It is therefore useful to leverage the thousands of publically available functional genomic datasets as a filter to prioritize the variants. For example, the ENCODE consortium12 has performed thousands of ChIP-seq experiments describing the binding of TFs and co-factors, and histone marks in a wide range of contexts, along with chromatin accessibility data from technologies such as DNase-seq13, ATAC-seq14, and FAIRE-seq15. Databases and web servers such as the UCSC Genome Browser16, Roadmap Epigenomics17, Blueprint Epigenome18, Cistrome19, and ReMap20 provide free access to data produced by these and other experimental techniques across a wide range of cell types and conditions. When there are too many variants to examine experimentally, these data can be used to prioritize those located within likely regulatory regions in relevant cell and tissue types. Further, in cases where a variant is within a ChIP-seq peak for a specific protein, these data can provide potential leads as to the specific TF(s) or co-factors whose binding might be affecting.
Next, the resulting prioritized variants are screened experimentally to validate predicted genotype-dependent protein binding using EMSA21,22. EMSA measures the change in the migration of the oligo on a non-reducing TBE gel. Fluorescently labeled oligo is incubated with the nuclear lysate, and binding of nuclear factors will retard the movement of the oligo on the gel. In this manner, oligo that has bound more nuclear factors will present as a stronger fluorescent signal upon scanning. Notably, EMSA does not require predictions about the specific proteins whose binding will be affected.
Once variants are identified that are located within predicted regulatory regions and are capable of differentially binding nuclear factors, computational methods are employed to predict the specific TF(s) whose binding they might affect. We prefer to use CIS-BP23,24, RegulomeDB25, UniProbe26, and JASPAR27. Once candidate TFs are identified, these predictions can be specifically tested using antibodies against these TFs (EMSA-supershifts and DAPA-Westerns). An EMSA-supershift involves the addition of a TF-specific antibody to the nuclear lysate and oligo. A positive result in an EMSA-supershift is represented as a further shift in the EMSA band, or a loss of the band (reviewed in reference28). In the complementary DAPA, a 5'-biotinylated oligo duplex containing the variant and the 20 base-pair flanking nucleotides are incubated with nuclear lysate from relevant cell type(s) to capture any nuclear factors specifically binding the oligos. The oligo duplex-nuclear factor complex is immobilized by streptavidin microbeads in a magnetic column. The bound nuclear factors are collected directly through elution29,48. Binding predictions can then be assessed by a Western blot using antibodies specific for the protein. In cases where there are no obvious predictions, or too many predictions, the elutions from variant pull-downs of the DAPA experiments can be sent to a proteomics core to identify candidate TFs using mass-spectrometry, which can subsequently be validated using these previously described methods.
In the remainder of the article, the detailed protocol for EMSA and DAPA analysis of genetic variants is provided.
Protokół
1. Preparation of Solutions and Reagents
- Order custom DNA oligonucleotide probes for use in EMSA and DAPA.
- To reduce non-specific protein binding, design short oligos (between 35-45 base pairs (bp) in length)30, and place the variant of interest directly in the center flanked by its 17 bp endogenous genomic sequence. For EMSA oligos, add a 5' fluorophore. For DAPA oligos, add a 5' biotin tag.
- Order both the sense strand and its reverse complement strand. Alternatively, order duplex (pre-annealed) oligos. When naming the oligos, base the nomenclature on an established reference genome.
Note: "Risk" and "non-risk" designation can be disease and project specific, while "reference" and "non-reference" are more universally relevant. - Upon arrival of the oligos, briefly spin down the contents and resuspend in nuclease-free water to a final concentration of 100 µM. Store resuspended stock at -20 °C. Protect oligos tagged with a fluorophore from light by wrapping with aluminum foil.
| Name | Sequence |
| rs76562819_REF_FOR | GTAATGCCTTAATGAGAGAGAGTTAGTCATCTTCTCACTTC |
| rs76562819_REF_REV | GAAGTGAGAAGATGACTAACTCTCTCTCATTAAGGCATTAC |
| rs76562819_NONREF_FOR | GTAATGCCTTAATGAGAGAGGGTTAGTCATCTTCTCACTTC |
| rs76562819_NONREF_REV | GAAGTGAGAAGATGACTAACCCTCTCTCATTAAGGCATTAC |
Table 1: Example EMSA/DAPA oligonucleotide design to test a SNP for differential binding. "REF" stands for the reference allele, while "NONREF" stands for the non-reference allele. "FOR" stands for the forward strand, while "REV" indicates its complement. The SNP is seen in red.
- Prepare cytoplasmic extraction (CE) buffer with a final concentration of 10 mM HEPES (pH 7.9), 10 mM KCl, and 0.1 mM EDTA in deionized water.
- Prepare nuclear extraction (NE) buffer with a final concentration of 20 mM HEPES (pH 7.9), 0.4 M NaCl, and 1 mM EDTA in deionized water.
- Prepare annealing buffer with a final concentration of 10 mM Tris (pH 7.5-8.0), 50 mM NaCl, and 1 mM EDTA in deionized water.
2. Preparation of Nuclear Lysate from Cultured Cells
Note: This experimental protocol was optimized using B-lymphoblastoid cell lines, but has been tested in several other unrelated adherent/ suspension cell lines and works universally.
- Culture B-lymphoblastoid cells in Roswell Park Memorial Institute (RPMI) 1640 with 2 mM L-glutamine, 10% fetal bovine serum, and 1x antibiotic-antimycotic containing 100 units/ml of penicillin, 100 µg/ml of streptomycin, and 250 ng/ml of amphotericin B.
- Seed at a range of 200,000-500,000 viable cells/ml and incubate flasks at 37 °C with 5% carbon dioxide in an upright position with vented or loose caps.
Note: The growth of B-lymphoblastoid cells slows when they reach over 1,000,000 cells/ml. Break up cell blasts by pipetting up and down several times and return cells to 200,000-500,000 cells/ml to maintain a rapid rate of growth.
- Seed at a range of 200,000-500,000 viable cells/ml and incubate flasks at 37 °C with 5% carbon dioxide in an upright position with vented or loose caps.
- Wash cultured cells twice with 10 ml ice cold phosphate buffered saline (PBS), spin down at 4 °C, 300 x g for 5 min and remove PBS via aspiration.
- Count cells using a hemocytometer and resuspend pellet as 1 ml ice cold PBS per 107 cells.
Note: For example, if lysing 2 x 10⁷ cells, resuspend in 2 ml PBS. - Aliquot 1 ml to 1.5 ml microcentrifuge tubes so that each tube contains 107 cells in PBS. Centrifuge at 3,300 x g for 2 min 4 °C and aspirate off PBS.
- Prior to use, add 1 mM dithiothreitol (DTT), 1x phosphatase inhibitor, and 1x protease inhibitor to a working stock of CE buffer. Resuspend cell pellet with 400 µl of CE buffer and incubate on ice for 15 minutes.
- Add 25 µl of 10% Nonidet P-40 and mix by pipetting. Centrifuge at 4 °C, max speed for 3 min. Decant and discard the supernatant.
- Prior to use, add 1 mM DTT, 1x phosphatase inhibitor, and 1x protease inhibitor to a working stock of NE buffer. Resuspend cell pellet with 30 µl of NE buffer and mix by vortexing.
- Incubate at 4 °C in a tube rotator or on ice for 10 min. Centrifuge 3,300 x g for 2 min 4 °C.
- Collect the clear supernatant (nuclear lysate) and aliquot before storing at -80 °C to avoid multiple freeze-thaw cycles that may degrade the protein. Leave a 10 µl aliquot to measure protein concentration using the bichoninic acid assay (BCA)31.
3. Electrophoretic Mobility Shift Assay (EMSA)
- Prepare Oligo Working Stock and EMSA Gel.
- If oligos were ordered in duplex, thaw the 100 µM stock and dilute 1:2,000 in annealing buffer to achieve a 50 nM working stock.
- If oligos were ordered single-stranded, thaw the 100 µM stocks and dilute 1:10 in annealing buffer to achieve 100 nM working stocks. Combine 100 µl of the 100 nM complement strand solution with each other in a microcentrifuge tube.
- Place in a heat block at 95 °C for 5 min. Turn off the heat block and allow the oligos to slowly cool down to room temperature for at least one hour prior to use.
- Pre-run the EMSA Gel.
- Remove the slide from a pre-cast 6% TBE gel and rinse under deionized water several times to remove any buffer from the wells. Prepare 1 L of 0.5x TBE buffer by adding 50 mL of 10x TBE to 950 ml of deionized water.
- Assemble the gel electrophoresis apparatus and check for leaks by filling the inner chamber with 0.5x TBE buffer. If no buffer leaks into the outer chamber, fill the outer chamber roughly two thirds of the way.
- Pre-run the gel at 100 V for 60 min.
- Flush each well with 200 µl of 0.5x TBE buffer.
- Prepare Binding Buffer Master Mix.
- Prepare 10x binding buffer with a final concentration of 100 mM Tris, 500 mM KCl, 10 mM DTT; pH 7.5 in deionized water.
- In a microcentrifuge tube, create a master mix consisting of the reagents common to all reactions (10 µl 10x binding buffer, 10 µl DTT/polysorbate, 5 µl Poly d(I-C), and 2.5 µl salmon sperm DNA; Table 2). Prepare an additional 10% to account for volume loss due to pipetting.
| Reagent | Final Conc. | Rxn #1 | Rxn #2 | Rxn #3 | Rxn #4 |
| Ultrapure Water | to 20 µl vol. | 13.5 µl | 11.98 µl | 13.5µl | 11.98 µl |
| 10x Binding Buffer | 1x | 2 μl | 2 μl | 2 μl | 2 µl |
| DTT/TW-20 | 1x | 2 μl | 2 μl | 2 μl | 2 μl |
| Salmon Sperm DNA | 500 ng/μl | 0.5 μl | 0.5 μl | 0.5 μl | 0.5 μl |
| 1μg/μl Poly d(I-C) | 1 μg | 1 μl | 1 μl | 1 μl | 1 μl |
| Nuclear Extract (5.26 ug/µl) | 8 μg | - | 1.52 μl | - | 1.52 μl |
| NE Buffer | 1.52 μl | - | 1.52 μl | - | |
| Reference allele oligo | 50 fmol | 1 μl | 1 μl | - | - |
| Non-Reference allele oligo | 50 fmol | - | - | 1 μl | 1 μl |
Table 2: Example EMSA reaction setup. The table illustrates an example EMSA to test the hypothesis that there is genotype-dependent binding of TFs to a specific SNP.
- Add nuclease-free water to each microcentrifuge tube such that the final volume following addition of all reagents will be 20 µl.
- Add the appropriate amount (5.5 µl) of master mix to each microcentrifuge tube.
- Add 8 µg of nuclear lysate to the appropriate microcentrifuge tubes. Include tubes containing the oligo without nuclear extract as negative controls (e.g. Table 2, Rxn #1 and Rxn #3).
Note: The optimal amount of lysate per reaction must be determined experimentally by titration. Generally, titrating a range of 2-10 µg of lysate is sufficient. - Add 50 fmol of oligo to the appropriate microcentrifuge tubes. Flick to mix and briefly spin the contents to the bottom of the tube. Incubate for 20 min at room temperature.
Note: If attempting a supershift, incubate the lysate mixture with antibody for 20 min at room temperature prior to the addition of oligos. It is recommended to use 1 µg of a ChIP-grade antibody for best results. - Add 2 µl of 10x Orange Loading Dye to each microcentrifuge tube. Pipette up and down to mix.
- Load the samples into the pre-run 6% TBE gel by pipetting up and down to mix and then expelling each sample into a separate well. Run the gel at 80 V until the orange dye has migrated 2/3 to 3/4 of the way down the gel. This should take approximately 60-75 min.
- Remove the gel from the plastic cassette by prying it open with a gel knife and place the gel in a container with 0.5% TBE buffer to keep it from drying out.
- Place the gel on the surface of an infrared and chemiluminescence imaging system, being sure to eliminate any bubbles or contaminants that will disrupt the image.
- Using the scanning system software, click the "Acquire" tab and then select "Draw New" to draw a box around the area corresponding to where the gel is located on the surface of the scanner.
- In the "Channels" section of the "Acquire" tab, select the channel corresponding to the wavelength of the fluorophore tag on the oligo. In the "Scanner" section, click "preview" to get a low-quality preview scan. Adjust the scan area by dragging the blue box surrounding the acquired preview image down to the portion of the gel to be imaged.
Note: For example, if using oligos labeled with a 700 nm fluorophore, make sure the "700 nm" channel is selected before scanning. - In the "Scan Controls" section, select the "84 µM" resolution option and the "Medium" quality option. Set the focus to offset to half the thickness of the gel. Note: For example, a 1 mm gel would use a 0.5 mm focus offset.
- In the "Scanner" section, click "Start" to begin the scan.
Note: During the scan, the brightness, contrast, and color scheme can often be adjusted manually depending on the manufacturer of the scanning system. - After the scan has finished, select the "Image" tab and click "Rotate or Flip" in the "Create" section to correct the orientation. Save the image file by clicking "Export" in the main menu and then select "Single Image View."
4. DNA Affinity Purification Assay (DAPA)
- Preparation of 5 µM Oligo Working Stock.
- If oligos were ordered in duplex, thaw the 100 µM stock and dilute 1:20 in annealing buffer to achieve a 5 µM working stock.
- If oligos were ordered single-stranded, thaw the 100 µM stocks and dilute 1:10 in annealing buffer to achieve 10 µM working stocks. Combine 10 µl of the 10 µM complementary strands with each other. Place in a heat block at 95 °C for 5 min. Turn off the heat block and allow the oligos to slowly cool down to room temperature prior to use.
- Before starting, warm the binding buffer, low stringency wash buffer, high stringency wash buffer, and elution buffer to room temperature.
Note: A final concentration of 50 ng/mL Poly d(I-C) can be added to the binding buffer, low stringency wash buffer, and high stringency wash buffer to reduce potential non-specific binding of proteins to the oligos. - Prepare the binding mixtures for each variant.
- Mix 1 volume of nuclear lysate with 2 volumes of binding buffer.
Note: The required amount of lysate must be determined experimentally due to varying abundance of TFs. Using between 100-250 µg of nuclear lysate per column is sufficient in most cases. - Add 1x phosphatase inhibitor, 1x protease inhibitor, and 1x binding enhancer (optional) and mix by flicking the tube several times.
Note: 100x binding enhancer consists of 750 mM MgCl2 and 300mM ZnCl2. Add binding enhancer if the binding of the TF to DNA depends on cofactors or reducing agents. If this information is not known, add the binding enhancer. - Add 10 µl of 5 µM biotinylated capture DNA (50 pmol) to each respective binding mixture. Incubate for 20 min at room temperature.
Note: Incubation time and temperature may vary depending on the TF. The optimal values need to be determined experimentally.
- Mix 1 volume of nuclear lysate with 2 volumes of binding buffer.
- Add 100 µl of streptavidin microbeads. Incubate for 10 min at room temperature.
- For each oligo probe being tested, place a binding column in the magnetic separator. Place a microcentrifuge tube directly under each binding column and apply 100 µl of binding buffer to rinse the column.
- Pipette the contents of each binding mixture into separate columns and allow the liquid to flow completely through the column into the microcentrifuge tube before proceeding. Make sure to label the columns with the variant oligo that was used in the binding mixture. Label the flow-through samples and replace with new microcentrifuge tubes to collect the low-stringency washes.
- Apply 100 µl of low-stringency wash buffer to the column; wait until the column reservoir is empty. Repeat wash 4x. Label the low-stringency wash samples and replace with new microcentrifuge tubes to collect the high-stringency washes.
- Apply 100 µl of high-stringency wash buffer to the column; wait until the column reservoir is empty. Repeat wash 4x. Label the high-stringency wash samples and replace with new microcentrifuge tubes to collect the pre-elution.
- Add 30 µl of native elution buffer to the column and let stand for 5 min. Label the pre-elution samples and replace with new microcentrifuge tubes to collect the elution.
Note: This does not elute the bound protein; it washes the remaining high-stringency buffer out of the column and replaces it with elution buffer to maximize the efficiency of the elution. - Add an additional 50 µl native elution buffer to elute the bound TFs. For a higher yield but less concentrated eluate, add an additional 50 µl of native elution buffer and collect the flow-through.
Note: Analyze elution samples through mass spectrometry to determine the identity of the bound TFs32. Afterwards, verify the proteomic results through sodium dodecyl sulfite polyacrylamide gel electrophoresis (SDS-PAGE) followed by a Western blot33. If mass spectrometry is not available, run a silver stain using standard technique instead of a Western blot to determine the size of the protein(s) showing genotype-dependent binding. Use this information to narrow down the list of predicted TFs from the computational approaches detailed in the introduction.
Wyniki
In this section, representative results of what to expect are provided when performing an EMSA or DAPA, and the variability with regards to the quality of lysate is characterized. For example, it has been suggested that freezing and thawing protein samples multiple times may result in denaturation. In order to explore the reproducibility of EMSA analysis in the context of these "freeze-thaw" cycles, two 35 bp oligos differing at one genetic variant were incubated with a single bat...
Dyskusje
Although advances in sequencing and genotyping technologies have greatly enhanced our capacity to identify genetic variants associated with disease, our ability to understand the functional mechanisms impacted by these variants is lagging. A major source of the problem is that many disease-associated variants are located in n on-coding regions of the genome, which likely affect harder-to-predict mechanisms controlling gene expression. Here, we present a protocol based on the EMSA and DAPA techniques, valuable molecular t...
Ujawnienia
The authors have nothing to disclose.
Podziękowania
We thank Erin Zoller, Jessica Bene, and Lindsey Hays for input and direction in protocol development. MTW was supported in part by NIH R21 HG008186 and a Trustee Award grant from the Cincinnati Children's Hospital Research Foundation. ZHP was supported in part by T32 GM063483-13.
Materiały
| Name | Company | Catalog Number | Comments |
| Custom DNA Oligonucleotides | Integrated DNA Technologies | http://www.idtdna.com/site/order/oligoentry | |
| Potassium Chloride | Fisher Scientific | BP366-500 | KCl, for CE buffer |
| HEPES (1 M) | Fisher Scientific | 15630-080 | For CE and NE buffer |
| EDTA (0.5M), pH 8.0 | Life Technologies | R1021 | For CE, NE, and annealing buffer |
| Sodium Chloride | Fisher Scientific | BP358-1 | NaCl, for NE buffer |
| Tris-HCl (1M), pH 8.0 | Invitrogen | BP1756-100 | For annealing buffer |
| Phosphate Buffered Saline (1x) | Fisher Scientific | MT21040CM | PBS, for cell wash |
| DL-Dithiothreitol solution (1 M) | Sigma | 646563 | Reducing agent |
| Protease Inhibitor Cocktail | Thermo Scientific | 87786 | Prevents catabolism of TFs |
| Phosphatase Inhibitor Cocktail | Thermo Scientific | 78420 | Prevents dephosphorylation of TFs |
| Nonidet P-40 Substitute | IBI Scientific | IB01140 | NP-40, for nuclear extraction |
| BCA Protein Assay Kit | Thermo Scientific | 23225 | For measuring protein concentration |
| Odyssey EMSA Buffer Kit | Licor | 829-07910 | Contains all necessary EMSA buffers |
| TBE Gels, 6%, 12 Wells | Invitrogen | EC6265BOX | For EMSA |
| TBE Buffer (10x) | Thermo Scientific | B52 | For EMSA |
| FactorFinder Starting Kit | Miltenyi Biotec | 130-092-318 | Contains all necessary DAPA buffers |
| Licor Odyssey CLx | Licor | Recommended scanner for DAPA/EMSA | |
| Antibiotic-Antimycotic | Gibco | 15240-062 | Contains 10,000 units/ml of penicillin, 10,000 µg/ml of streptomycin, and 25 µg/ml of Fungizone® Antimycotic |
| Fetal Bovine Serum | Gibco | 26140-079 | FBS, for culture media |
| RPMI 1640 Medium | Gibco | 22400-071 | Contains L-glutamine and 25 mM HEPES |
Odniesienia
- Hindorff, L. A., et al. Potential etiologic and functional implications of genome-wide association loci for human diseases and traits. Proc Natl Acad Sci U S A. 106 (23), 9362-9367 (2009).
- Maurano, M. T., et al. Systematic localization of common disease-associated variation in regulatory DNA. Science. 337 (6099), 1190-1195 (2012).
- Ward, L. D., Kellis, M. Interpreting noncoding genetic variation in complex traits and human disease. Nat Biotechnol. 30 (11), 1095-1106 (2012).
- Paul, D. S., Soranzo, N., Beck, S. Functional interpretation of non-coding sequence variation: concepts and challenges. Bioessays. 36 (2), 191-199 (2014).
- Zhang, F., Lupski, J. R. Non-coding genetic variants in human disease. Hum Mol Genet. , (2015).
- Lee, T. I., Young, R. A. Transcriptional regulation and its misregulation in disease. Cell. 152 (6), 1237-1251 (2013).
- Slatkin, M. Linkage disequilibrium--understanding the evolutionary past and mapping the medical future. Nat Rev Genet. 9 (6), 477-485 (2008).
- Bush, W. S., Moore, J. H. Chapter 11: Genome-wide association studies. PLoS Comput Biol. 8 (12), e1002822 (2012).
- 1000 Genomes Project Consortium. An integrated map of genetic variation from 1,092 human genomes. Nature. 491 (7422), 56-65 (2012).
- Chang, C. C., et al. Second-generation PLINK: rising to the challenge of larger and richer datasets. Gigascience. 4, 7 (2015).
- Purcell, S., et al. PLINK: a tool set for whole-genome association and population-based linkage analyses. Am J Hum Genet. 81 (3), 559-575 (2007).
- ENCODE Project Consortium. An integrated encyclopedia of DNA elements in the human genome. Nature. 489 (7414), 57-74 (2012).
- Crawford, G. E., et al. Genome-wide mapping of DNase hypersensitive sites using massively parallel signature sequencing (MPSS). Genome Res. 16 (1), 123-131 (2006).
- Buenrostro, J. D., Giresi, P. G., Zaba, L. C., Chang, H. Y., Greenleaf, W. J. Transposition of native chromatin for fast and sensitive epigenomic profiling of open chromatin, DNA-binding proteins and nucleosome position. Nat Methods. 10 (12), 1213-1218 (2013).
- Giresi, P. G., Kim, J., McDaniell, R. M., Iyer, V. R., Lieb, J. D. FAIRE Formaldehyde-Assisted Isolation of Regulatory Elements) isolates active regulatory elements from human chromatin. Genome Res. 17 (6), 877-885 (2007).
- Kent, W. J., et al. The human genome browser at UCSC. Genome Res. 12 (6), 996-1006 (2002).
- Roadmap Epigenomics Consortium. Integrative analysis of 111 reference human epigenomes. Nature. 518 (7539), 317-330 (2015).
- Martens, J. H., Stunnenberg, H. G. BLUEPRINT: mapping human blood cell epigenomes. Haematologica. 98 (10), 1487-1489 (2013).
- Liu, T., et al. Cistrome: an integrative platform for transcriptional regulation studies. Genome Biol. 12 (8), R83 (2011).
- Griffon, A., et al. Integrative analysis of public ChIP-seq experiments reveals a complex multi-cell regulatory landscape. Nucleic Acids Res. 43 (4), e27 (2015).
- Staudt, L. M., et al. A lymphoid-specific protein binding to the octamer motif of immunoglobulin genes. Nature. 323 (6089), 640-643 (1986).
- Singh, H., Sen, R., Baltimore, D., Sharp, P. A. A nuclear factor that binds to a conserved sequence motif in transcriptional control elements of immunoglobulin genes. Nature. 319 (6049), 154-158 (1986).
- Weirauch, M. T., et al. Determination and inference of eukaryotic transcription factor sequence specificity. Cell. 158 (6), 1431-1443 (2014).
- Ward, L. D., Kellis, M. HaploReg: a resource for exploring chromatin states, conservation, and regulatory motif alterations within sets of genetically linked variants. Nucleic Acids Res. 40 (Database issue), D930-D934 (2012).
- Boyle, A. P., et al. Annotation of functional variation in personal genomes using RegulomeDB. Genome Res. 22 (9), 1790-1797 (2012).
- Hume, M. A., Barrera, L. A., Gisselbrecht, S. S., Bulyk, M. L. UniPROBE, update 2015: new tools and content for the online database of protein-binding microarray data on protein-DNA interactions. Nucleic Acids Res. 43 (Database issue), D117-D122 (2015).
- Mathelier, A., et al. JASPAR 2014: an extensively expanded and updated open-access database of transcription factor binding profiles. Nucleic Acids Res. 42 (Database issue), 142-147 (2014).
- Smith, M. F., Delbary-Gossart, S. Electrophoretic Mobility Shift Assay (EMSA). Methods Mol Med. 50, 249-257 (2001).
- Franza, B. R., Josephs, S. F., Gilman, M. Z., Ryan, W., Clarkson, B. Characterization of cellular proteins recognizing the HIV enhancer using a microscale DNA-affinity precipitation assay. Nature. 330 (6146), 391-395 (1987).
- . BCA Protein Assay Kit: User Guide Available from: https://tools.thermofisher.com/content/sfs/manuals/MAN0011430_Pierce_BCA_Protein_Asy_UG.pdf (2014)
- Wijeratne, A. B., et al. Phosphopeptide separation using radially aligned titania nanotubes on titanium wire. ACS Appl Mater Interfaces. 7 (21), 11155-11164 (2015).
- Silva, J. M., McMahon, M. The Fastest Western in Town: A Contemporary Twist on the Classic Western Blot Analysis. J. Vis. Exp. (84), (2014).
- Lu, X., et al. Lupus Risk Variant Increases pSTAT1 Binding and Decreases ETS1 Expression. Am J Hum Genet. 96 (5), 731-739 (2015).
- Ramana, C. V., Chatterjee-Kishore, M., Nguyen, H., Stark, G. R. Complex roles of Stat1 in regulating gene expression. Oncogene. 19 (21), 2619-2627 (2000).
- Fillebeen, C., Wilkinson, N., Pantopoulos, K. Electrophoretic Mobility Shift Assay (EMSA) for the Study of RNA-Protein Interactions: The IRE/IRP Example. J. Vis. Exp. (94), e52230 (2014).
- Heng, T. S., Painter, M. W. Immunological Genome Project, C. The Immunological Genome Project: networks of gene expression in immune cells. Nat Immunol. 9 (10), 1091-1094 (2008).
- Wu, C., et al. BioGPS: an extensible and customizable portal for querying and organizing gene annotation resources. Genome Biol. 10 (11), R130 (2009).
- Wu, C., Macleod, I., Su, A. I. BioGPS and MyGene.info: organizing online, gene-centric information. Nucleic Acids Res. 41 (Database issue), D561-D565 (2013).
- Wang, J., et al. Sequence features and chromatin structure around the genomic regions bound by 119 human transcription factors. Genome Res. 22 (9), 1798-1812 (2012).
- Holden, N. S., Tacon, C. E. Principles and problems of the electrophoretic mobility shift assay. J Pharmacol Toxicol Methods. 63 (1), 7-14 (2011).
- Xu, J., Liu, H., Park, J. S., Lan, Y., Jiang, R. Osr1 acts downstream of and interacts synergistically with Six2 to maintain nephron progenitor cells during kidney organogenesis. Development. 141 (7), 1442-1452 (2014).
- Yang, T. -. P., et al. Genevar: a database and Java application for the analysis and visualization of SNP-gene associations in eQTL studies. Bioinformatics. 26 (19), 2474-2476 (2010).
- Fort, A., et al. A liver enhancer in the fibrinogen gene cluster. Blood. 117 (1), 276-282 (2011).
- Solberg, N., Krauss, S. Luciferase assay to study the activity of a cloned promoter DNA fragment. Methods Mol Biol. 977, 65-78 (2013).
- Rahman, M., et al. A repressor element in the 5'-untranslated region of human Pax5 exon 1A. Gene. 263 (1-2), 59-66 (2001).
- Mali, P., et al. RNA-Guided Human Genome Engineering via Cas9. Science. 339 (6121), 823-826 (2013).
Przedruki i uprawnienia
Zapytaj o uprawnienia na użycie tekstu lub obrazów z tego artykułu JoVE
Zapytaj o uprawnieniaPrzeglądaj więcej artyków
This article has been published
Video Coming Soon
Copyright © 2025 MyJoVE Corporation. Wszelkie prawa zastrzeżone