
Aby wyświetlić tę treść, wymagana jest subskrypcja JoVE. Zaloguj się lub rozpocznij bezpłatny okres próbny.
Method Article
Subtype-specific Optical Action Potential Recordings in Human Induced Pluripotent Stem Cell-derived Ventricular Cardiomyocytes
* Wspomniani autorzy wnieśli do projektu równy wkład.
W tym Artykule
Podsumowanie
Here we present a method to optically image action potentials, specifically in ventricular-like induced pluripotent stem cell-derived cardiomyocytes. The method is based on the promoter-driven expression of a voltage-sensitive fluorescent protein.
Streszczenie
Cardiomyocytes generated from human induced pluripotent stem cells (iPSC-CMs) are an emerging tool in cardiovascular research. Rather than being a homogenous population of cells, the iPSC-CMs generated by current differentiation protocols represent a mixture of cells with ventricular-, atrial-, and nodal-like phenotypes, which complicates phenotypic analyses. Here, a method to optically record action potentials specifically from ventricular-like iPSC-CMs is presented. This is achieved by lentiviral transduction with a construct in which a genetically-encoded voltage indicator is under the control of a ventricular-specific promoter element. When iPSC-CMs are transduced with this construct, the voltage sensor is expressed exclusively in ventricular-like cells, enabling subtype-specific optical membrane potential recordings using time-lapse fluorescence microscopy.
Wprowadzenie
Cardiomyocytes (CMs) derived from induced pluripotent stem cells (iPSCs) are an emerging tool to dissect molecular mechanisms of heart disease, to investigate novel therapies, and to screen for adverse cardiac drug effects1,2,3. Right from the start, arrhythmogenic diseases such as channelopathies have been an important focus of this research area4. Consequently, methods to investigate electrical phenotypes of CMs, such as arrhythmias or changes in action potential (AP) morphologies, are at the heart of this technology.
An important consideration in the application of iPSC-CMs is that current cardiac differentiation protocols do not result in a homogenous population of cells. Instead, they are rather a mixture of cells resembling sinus node, atrial, and ventricular CMs at different levels of maturation5,6,7,8. This heterogeneity can be a relevant source of experimental variability, especially if parameters such as AP duration (APD) are investigated, which intrinsically differ between CM subtypes (e.g., the APD is shorter in atrial than in ventricular CMs). The conventional approach to address this problem is to investigate single iPSC-CMs using the patch clamp method and to classify each cell as nodal-, atrial-, or ventricular-like, based on its AP morphology9. Any subsequent analysis can be then restricted to the cells representing the CM subtype of interest. The major drawback of this strategy is its limited throughput and lack of scalability. Moreover, the invasive nature of patch clamp electrophysiology does not allow the imaging of the same cells sequentially over extended time periods.
Here, we provide experimental details on a method10 developed to optically image APs in specific subtypes of iPSC-CMs. This overcomes the problem of subtype heterogeneity and dramatically increases the throughput as compared to conventional methods, allowing the rapid phenotyping of iPSC-CMs carrying genetic variants or being exposed to pharmacological agents.
Overview of the subtype-specific optical imaging approach
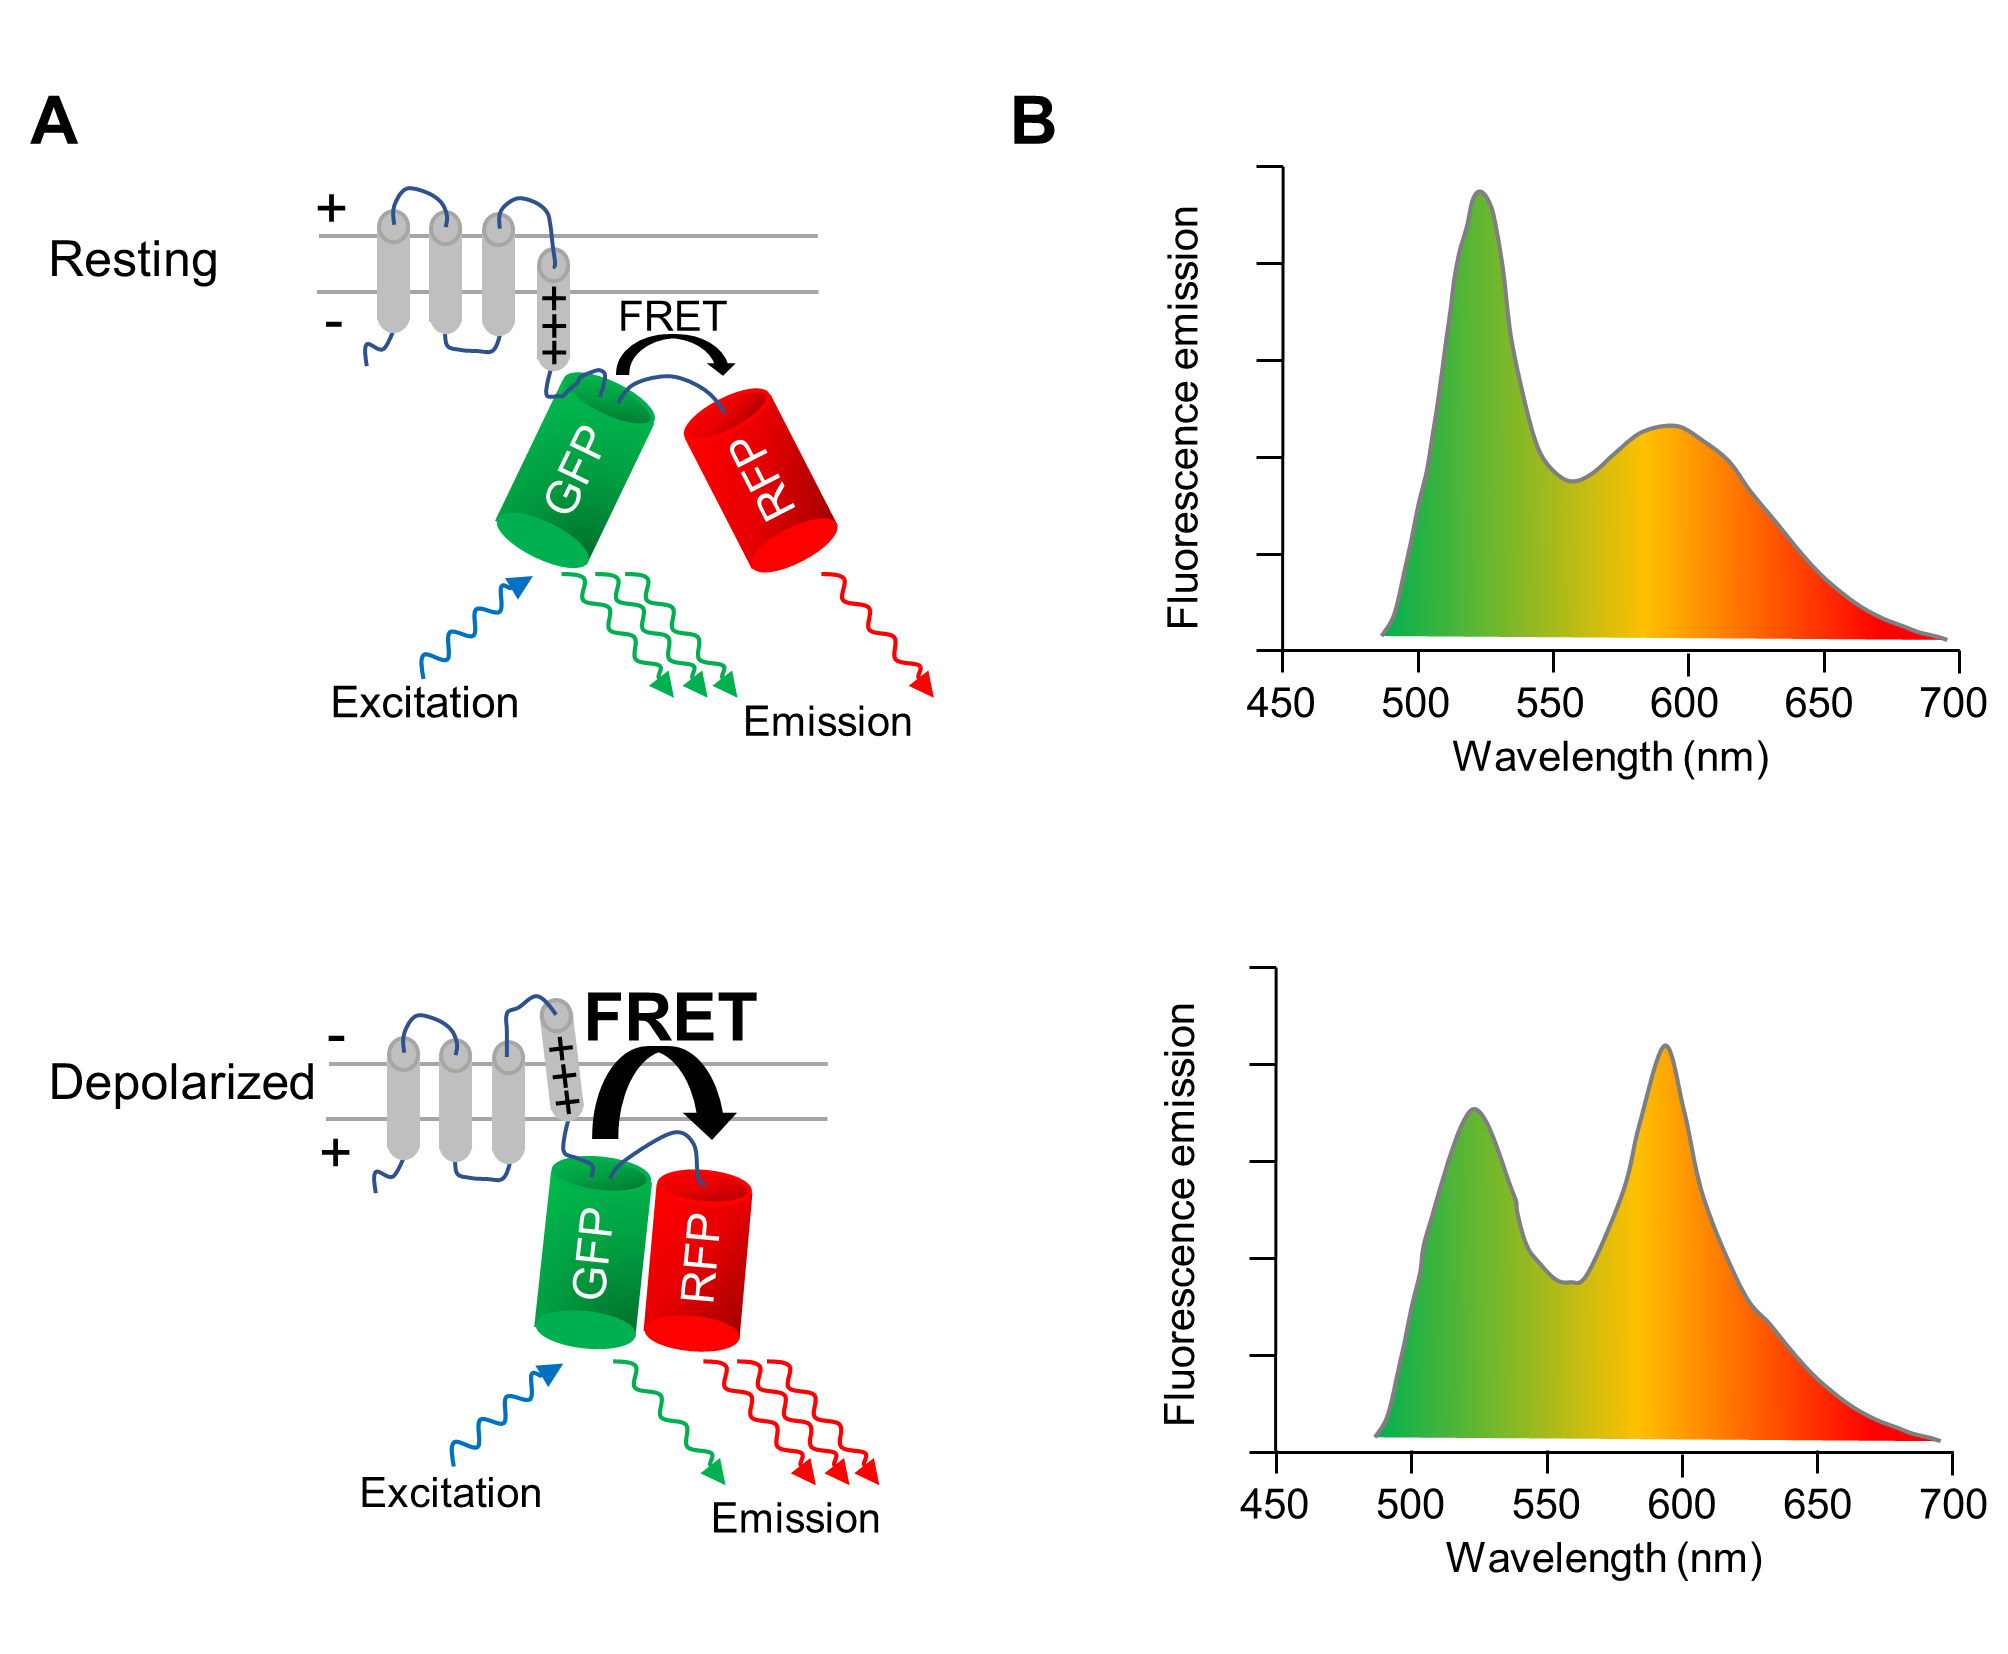
A genetically-encoded voltage indicator (GEVI), whose fluorescence properties change upon depolarization and repolarization of the cell membrane, is used to optically image changes of the membrane potential of CMs. The GEVI applied here is the voltage-sensing fluorescent protein VSFP-CR11, which consists of a voltage-sensing transmembrane domain fused to a pair of a green (Clover) and a red (mRuby2) fluorescent protein (Figure 1A). Due to the close proximity of the two fluorophores, the excitation of the green fluorescent protein results in a fraction of the excitation energy being transferred to the red fluorescent protein via Förster resonance energy transfer (FRET). Therefore, the excitation of the green fluorescent protein results in an emission from both the green and the red fluorescent proteins (Figure 1A, upper panel). When the cell depolarizes, a structural rearrangement of the voltage sensor occurs that translates into a reorientation of the two fluorescent proteins, increasing the FRET efficiency. Thus, even more of the excitation energy is transferred from the green to the red fluorescent protein (Figure 1A, lower panel). As a result, in a depolarized cell, the green fluorescence emission is dimmer, and the red fluorescence emission is brighter than in a cell at resting membrane potential (Figure 1B).

Figure 1: Optical imaging of membrane potential with VSFP-CR. (A) A schematic depicting the action of the voltage-sensitive fluorescent protein VSFP-CR is shown. Upon the depolarization of the cell membrane, a structural rearrangement in the voltage-sensing transmembrane domain translates into a reorientation of the green (GFP) and red (RFP) fluorescent protein, increasing the efficiency of the intramolecular Förster resonance energy transfer (FRET). (B) The emission spectra of a VSFP upon excitation of the GFP in cells at the resting membrane potential (upper panel) and in depolarized cells (lower panel) are depicted. The spectral change upon depolarization is exaggerated for clarity. Please click here to view a larger version of this figure.
The changes in the FRET efficiency mirroring the fluctuations of the membrane potential are imaged using a fluorescence microscope equipped with an image splitter, which separates red and green fluorescence emissions and projects them onto two adjacent areas of the chip of an sCMOS camera (Figure 2). With this set-up, the fluorescence emission at two different wavelength bands can be recorded simultaneously, which allows the calculation of a ratio of red-to-green fluorescence to reflect the membrane potential in every image of a time-lapse series.

Figure 2: Configuration of the imaging system. The principal components of the imaging system used to image the spectral changes of the voltage-sensitive fluorescent protein mirroring the membrane potential changes at a high temporal resolution are depicted. Please click here to view a larger version of this figure.
The expression of VSFP-CR in CMs is achieved by lentiviral transduction. To direct expression to the CM subtype of interest, the lentivirus contains a promoter element (the MLC2v enhancer) that specifically drives transcription in ventricular-like iPSC-CMs10. When the iPSC-CMs that represent a mixture of atrial-like, nodal-like, and ventricular-like cells are transduced with this lentivirus, VSFP-CR is expressed only in the ventricular-like cells. Since the optical action potential imaging depends on this fluorescent sensor, the recorded action potentials exclusively represent the CM subtype of interest (Figure 3).

Figure 3: Promoter-driven VSFP expression for subtype-specific membrane potential imaging. (a) This schematic shows how cardiomyocyte subtype-specific optical action potential recordings are achieved. (b) iPSC-CMs infected with a VSFP under the control of the ventricular-specific MLC2v-enhancer are shown. The expression of the voltage sensor is observed only in ventricular-like CMs in the GFP channel (left panel). The phase contrast (middle panel) and overlay image (right panel) are also provided. The white dotted lines mark cell boundaries. Please click here to view a larger version of this figure.
Access restricted. Please log in or start a trial to view this content.
Protokół
1. Preparation of iPSC-derived Cardiomyocytes for Imaging
NOTE: Methods for iPSC culture and cardiac differentiation have been published before12,13,14 and are not discussed here in detail. The purification of iPSC-CMs by manual microdissection, magnetic cell separation, or lactate selection is recommended, depending on the differentiation protocol used. For the following protocol, microdissected explants from beating areas, generated using a monolayer differentiation protocol13, were taken on day 15 of a cardiac differentiation and cultured until day 30 on fibronectin-coated plates as described before10.
- Take the cell culture plates out of the incubator and manually collect the cardiac explants into microcentrifuge tubes using a 200 µL pipette. After sedimentation, aspirate the cell culture supernatant and gently wash the explants 2x with Hank’s balanced salt solution (HBSS).
- Dissociate iPSC-CMs by adding collagenase type II (430 U/mL in HBSS) and incubate them at 37 °C for 30 min.
- After the sedimentation of the remaining large cell clumps, collect the supernatant that contains the dissociated single iPSC-CMs and add this to fresh CM maintenance medium containing a high fetal bovine serum (FBS) concentration (DMEM-F12, 20% FBS, 2 mM L-glutamine, 1:100 MEM non-essential amino acids, 100 U/mL penicillin-streptomycin, and 0.1 mM β-mercaptoethanol).
- Repeat the dissociation if large cell clumps remain. Collect single iPSC-CMs by centrifugation and resuspend them in CM medium containing a low FBS concentration (2% FBS).
- Re-seed single iPSC-CMs in a density allowing the subsequent imaging of single cells on a 3.5 cm glass-bottom cell culture microdish that has been coated with fibronectin (2 µg/cm2). Optimize the seeding density before engaging in high-throughput experiments. Usually, 5–10 cardiac explants per 3.5 cm dish are sufficient; however, this heavily depends on the explant size and purity.
- Culture the single iPSC-CMs after their dissociation in CM maintenance medium containing 2% FBS for at least 48 h to ensure a sufficient recovery.
Note: In the next steps, the iPSC-CMs are transduced with a lentivirus encoding the GEVI VSFP-CR under the control of an MLC2v enhancer10 to achieve a ventricular-specific GEVI expression. Alternatively, lentiviral constructs allowing to express the GEVI specifically in nodal- or atrial-like cells, or an unspecific construct harboring the ubiquitously-expressed PGK promoter, can be used10. Lentiviral plasmids are available upon request.
CAUTION: When working with lentiviral particles, ensure that the working environment has the adequate biosafety level, adhere to the safety instructions for working with potentially infectious agents, and take the necessary safety precautions. - Prepare the infection medium by mixing the lentivirus10-containing cell culture supernatant, which has been produced in HEK293 cells as described before15, with CMs maintenance medium (see step 1.3) in a 1:1 ratio.
- Add hexadimethrine bromide at a final concentration of 8 µg/mL to enhance the infection efficiency.
NOTE: Due to the high infection efficiency of iPSC-CMs prior concentration of lentivirus through ultracentrifugation is usually not necessary. - Aspirate the CM maintenance medium from the single iPSC-CMs and replace it with the infection medium prepared during steps 1.7 and 1.8. Culture the infected single iPSC-CMs in the infection medium for 12 h at 37 °C. Then, aspirate the medium and replace it again with CM maintenance medium.
NOTE: A fluorescence signal from the GEVI appears 48 h after the infection. An imaging of the membrane potential recordings is recommended, 72 h after infection at the earliest, to ensure a proper signal strength. Single infected iPSC-CMs can be cultured for at least 3 weeks and imaged sequentially. If extensive photobleaching occurs during an imaging session, the fluorescence signal recovers over time. - Before imaging, exchange the cell culture medium by Tyrode’s solution supplemented with Ca2+ (135 mM NaCl, 5.4 mM KCl, 1 mM MgCl2, 10 mM glucose, 1.8 mM CaCl2, and 10 mM HEPES; pH 7.35).
2. Optical Membrane Potential Recordings
- Place the imaging chamber containing the iPSC-CMs on the stage of an inverted epifluorescence microscope equipped with an image splitter, the appropriate filter sets, and a camera (e.g., an sCMOS camera) capable of high-speed imaging at a high sensitivity.
NOTE: For example, use a 480/40 nm band-pass excitation filter combined with a 500 nm long-pass dichroic mirror in the microscope, and a 568 nm long-pass dichroic mirror combined with 520/28 nm and 630/75 nm band-pass emission filters in the image splitter. For single-cell imaging, a high-magnification, high-numerical-aperture oil immersion objective provides the best signal-to-noise ratio. - If electrical pacing is required, install pacing electrodes in the imaging chamber and connect them to a stimulus generator.
NOTE: We used a pacing inset that contained two platinum electrodes and fitted into the 3.5 cm glass-bottom cell culture dishes. The cells located between the electrodes were imaged. Typical pacing parameters are rectangular pulses of 5 ms in duration, with an amplitude of 10 V/cm electrode distance. - Optionally, use a heated microscope stage to ensure a stable temperature of the iPSC-CMs during imaging, or even a microscope incubation chamber set-up if long-term imaging is intended.
- Bring the cells to focus and place a cell expressing the GEVI into the center of the viewing field.
NOTE: This is most conveniently done by using the eyepieces of the microscope using a green fluorescent protein (GFP) or a red fluorescent protein (RFP) filter set to identify cells expressing the GEVI. - Set the optical path so that emitted light is routed to the image splitter. Switch the filter cube in the microscope to the one to be combined with the filters in the image splitter (see Table of Materials).
- In the software controlling the camera, set the acquisition settings so that high-speed imaging (e.g., 100 frames per second, with an exposure time of 10 ms per frame) is possible.
Note: Usually, this involves the binning of camera pixels (e.g., 8 x 8 pixels of the camera chip are binned to generate one pixel in the time-lapse movie). - Set up the image splitter according to the manufacturer’s instruction. The two images representing the two different emission wavelength bands should be adjacent to each other, each occupying one half of the image.
NOTE: This step has to be performed only 1x at the beginning of each imaging session. - Check and, if necessary, adjust the focus of the image produced by the camera.
- Adjust the brightness of the illumination light so that any saturation of the pixels is avoided; this can be most easily done by using a color palette in which saturated pixels are represented by a unique color.
NOTE: During all these preparations prior to imaging, limit the exposure of the sample to the excitation light to the necessary amount (i.e., do not leave the light on for extended periods of time) to avoid photobleaching of the GEVI. - Set up the acquisition of the time series (e.g., 5,000 images at 100 frames per second for a series duration of 50 s). Dim the light in the room (including computer monitors) to avoid stray light influencing the measurement. If the excitation light shutter is not controlled by the imaging software, open it just before starting the acquisition.
- Start the acquisition of the image series. If electrical pacing is desired, start the pacing sequence at the appropriate time point, unless it is automatically initiated by the imaging software. If the application of a pharmacological agent is wanted, do this either manually (e.g., by pipetting 100 µL of the agent in a tenfold end concentration to the recording chamber containing 900 µL of buffer, and gently mixing it with the pipette) or by using a constant-flow perfusion system.
- When the acquisition is finished, close the excitation light shutter if necessary. Save the recording to the hard drive.
- Leaving the recording settings (i.e., exposure time, frame rate, and light intensity) unchanged, perform a recording of the background fluorescence (as in step 2.11) over a region of the coverslip not containing cells or over another coverslip on which no cells have been seeded.
NOTE: If sequential measurements are performed without changing the acquisition settings, only one background fluorescence recording is necessary for all these measurements. - If desired, perform additional experiments (steps 2.4–2.13) on different iPSC-CMs located on the same coverslip. Be aware that all CMs on the coverslip will be affected in case a drug was applied.
3. Analysis
>NOTE: Depending on the imaging software used (which is typically a proprietary software package provided by the manufacturer of the camera or the whole fluorescence imaging system), it may be possible to perform the analysis of the acquired images partly or even entirely within this software package. However, here a workflow of image analysis that can be performed with open source software (i.e., the image analysis platform ImageJ)16, which can be conveniently installed using a distribution such as Fiji17, and the R package for statistical computing18 are described. Briefly, regions of interest (ROIs) representing cells or background are drawn in ImageJ, and the mean fluorescence in these ROIs over time is exported to a file to be, then, further analyzed in R or, alternatively, with spreadsheet software.
- In the imaging software, save or export the acquired image time series (both the recording containing the cells and the corresponding background recording) to a format (e.g., TIF) that can be read by ImageJ. Alternatively, use the BioFormats plugin (https://imagej.net/Bio-Formats), which provides routines enabling ImageJ to read proprietary file formats from different brands of imaging system manufacturers.
NOTE: The following steps assume that the imaging intervals are the same throughout the recording. If this is not the case, it may be necessary to export the timing information from the imaging software and include it in the further analysis. - Open the TIF stack containing the cells in ImageJ.
- Use the freehand selection tool to draw an ROI over a fluorescent cardiomyocyte in the red channel. Ensure that the ROI is large enough so that the cell does not move out of the ROI while contracting.
- Open the ROI manager plugin ('Analyze | Tools | ROI Manager') and press the 'Add [t]' button to add this ROI as ROI1.
- Drag the ROI over the same cell in the green channel and add this ROI as ROI2.
- In the 'Analyze | Set Measurements' menu, unselect all options except for 'Mean gray value'.
NOTE: This has to be done only 1x in an ImageJ session. - In the ROI manager, press the 'More | Multi Measure' button. Select the 'Measure all slices' and 'One row per slice' options and press 'OK'. A window opens containing a spreadsheet with three rows (the slice number and the mean fluorescence in the two ROIs representing the cell in the red and in the green channel, respectively).
- Use 'File | Save As' to save the spreadsheet into a comma-separated value (CSV) file.
- Close the window with the image stack and the spreadsheet window without closing the ROI manager window. Open the TIF stack containing the background measurement.
- In the ROI manager, press the 'More | Multi Measure' button. Select the 'Measure all slices' and 'One row per slice' options and press 'OK'.
- Use 'File | Save As' to save the spreadsheet with the background data into another CSV file.
NOTE: The following calculations can be done with spreadsheet software. We used the R software18. A simple example script that reads the cell and background data from the files “cell.csv” and “background.csv” performs the calculations, and plots the time course of the membrane potential signal is provided as Supplementary Code File 1. - From the background recording, calculate the average intensity in the red and in the green channel. Subtract this background signal from the signals representing the cell in the red and green channel to calculate background-corrected RFP and GFP signals, respectively.
- As a surrogate for the membrane potential, calculate the ratio RFP/GFP.
NOTE: This ratio is dimensionless. Alternatively, it can be normalized to its initial value (i.e., ΔR/R0). Importantly, useful information is contained in the temporal changes rather than in the absolute values of this ratio. Due to uneven photobleaching of the GFP and the RFP, a baseline drift in this ratio may occur. If necessary, such a baseline drift may be corrected by constructing a baseline curve and subtracting it from the RFP/GFP ratio10.
Access restricted. Please log in or start a trial to view this content.
Wyniki
In Figure 4a, a representative single iPSC-CM is depicted with the white dotted lines marking the ROI drawn during the imaging analysis in the RFP (left side) and the GFP (right side) channel. The signal from the RFP channel shows a periodic increase in fluorescent intensity during each action potential (Figure 4b, upper panel). As described in the Introduction, this is due to an increasing FRET caused by changes in the membrane ...
Access restricted. Please log in or start a trial to view this content.
Dyskusje
The method described here enables an optical recording of APs from a specific subtype (i.e., ventricular-like cells) of CMs generated from human iPSCs. Human iPSC-CMs are an emerging tool to address a huge variety of biological and medical problems, and the differentiation to different CM subtypes is an important source of experimental variability. By using specific promoter elements, the expression of a GEVI is specifically achieved in CMs representing the subtype of interest, which are then optically imaged.
Access restricted. Please log in or start a trial to view this content.
Ujawnienia
The authors have nothing to disclose.
Podziękowania
This work was supported by grants from the German Research Foundation (Si 1747/1-1), the Else Kröner-Fresenius-Stiftung, and the Deutsche Stiftung für Herzforschung.
Access restricted. Please log in or start a trial to view this content.
Materiały
| Name | Company | Catalog Number | Comments |
| ß-Mercaptoethanol | Invitrogen | 21985023 | |
| DMEM-F12 Medium | Invitrogen | 21331046 | |
| FBS (Fetal Bovine Serum) | Invitrogen | 16141079 | |
| MEM Non-Essential Amino Acids | Invitrogen | 11140050 | |
| GlutaMax-I Supplement | Invitrogen | 35050061 | alternative L-Glutamine |
| Penicillin-Streptomycin | Invitrogen | 15140122 | |
| Fibronectin bovine plasma | Sigma-Aldrich | F1141 | |
| Collagenase type II | Worthington Biochem | LS004174 | |
| Hexadimethrine Bromide (Polybrene) | Sigma-Aldrich | H9268 | enhancing lentiviral infection |
| 3.5 cm glass-bottom microdishes | MatTek corporation, Ashland, MA, USA | P35G-1.5-14-C | |
| Microscope stand | Leica Microsystems, Wetzlar, Germany | DMI6000B | |
| Microscope objective | Leica Microsystems, Wetzlar, Germany | HCX PL APO 63X/1.4-0.6 Oil | |
| sCMOS camera | Andor Technology, Belfast, UK | Zyla V | |
| Microscope filter cube: excitation filter | Chroma Technology Corp, Bellows Falls, VT, USA | ET480/40X | bandpass 480/40 |
| Microscope filter cube: dichroic mirror | Chroma Technology Corp, Bellows Falls, VT, USA | T505lpxr | longpass 505 nm |
| Image splitter | Cairn Research, Faversham, UK | OptoSplit II | |
| Image splitter filter cube: dichroic mirror | AHF Analysentechnik GmbH, Tübigen, Germany | 568LPXR | longpass 568 nm |
| Image splitter filter cube: emission filter 1 (GFP emission) | AHF Analysentechnik GmbH, Tübigen, Germany | 520/28 BrightLine HC | bandpass 520/28 nm |
| Image splitter filter cube: emission filter 2 (RFP emission) | AHF Analysentechnik GmbH, Tübigen, Germany | 630/75 ET Bandpass | bandpass 630/75 nm |
| Pacing inset | Warner Instruments, Hamden, CT, USA | RC-37FS |
Odniesienia
- Sinnecker, D., Laugwitz, K. L., Moretti, A. Induced pluripotent stem cell-derived cardiomyocytes for drug development and toxicity testing. Pharmacology & Therapeutics. 143 (2), 246-252 (2014).
- Goedel, A., My, I., Sinnecker, D., Moretti, A. Perspectives and Challenges of Pluripotent Stem Cells in Cardiac Arrhythmia Research. Current Cardiology Reports. 19 (3), 23(2017).
- Rocchetti, M., et al. Elucidating arrhythmogenic mechanisms of long-QT syndrome CALM1-F142L mutation in patient-specific induced pluripotent stem cell-derived cardiomyocytes. Cardiovascular Research. 113 (5), 531-541 (2017).
- Sinnecker, D., et al. Modeling long-QT syndromes with iPS cells. Journal of Cardiovascular Translational Research. 6 (1), 31-36 (2013).
- Talkhabi, M., Aghdami, N., Baharvand, H. Human cardiomyocyte generation from pluripotent stem cells: A state-of-art. Life Sciences. , 98-113 (2016).
- Ben-Ari, M., et al. Developmental changes in electrophysiological characteristics of human-induced pluripotent stem cell-derived cardiomyocytes. Heart Rhythm. 13 (12), 2379-2387 (2016).
- Den Hartogh, S. C., Passier, R. Concise Review: Fluorescent Reporters in Human Pluripotent Stem Cells: Contributions to Cardiac Differentiation and Their Applications in Cardiac Disease and Toxicity. Stem Cells. 34 (1), 13-26 (2016).
- Schweizer, P. A., et al. Subtype-specific differentiation of cardiac pacemaker cell clusters from human induced pluripotent stem cells. Stem Cell Research & Therapy. 8 (1), 229(2017).
- Moretti, A., et al. Patient-specific induced pluripotent stem-cell models for long-QT syndrome. The New England Journal of Medicine. 363 (15), 1397-1409 (2010).
- Chen, Z., et al. Subtype-specific promoter-driven action potential imaging for precise disease modelling and drug testing in hiPSC-derived cardiomyocytes. European Heart Journal. 38 (4), 292-301 (2017).
- Lam, A. J., et al. Improving FRET dynamic range with bright green and red fluorescent proteins. Nature Methods. 9 (10), 1005-1012 (2012).
- Chen, G., et al. Chemically defined conditions for human iPSC derivation and culture. Nature Methods. 8 (5), 424-429 (2011).
- Burridge, P. W., et al. Chemically defined generation of human cardiomyocytes. Nature Methods. 11 (8), 855-860 (2014).
- Bhattacharya, S., et al. High efficiency differentiation of human pluripotent stem cells to cardiomyocytes and characterization by flow cytometry. Journal of Visualized Experiments. (91), e52010(2014).
- Wang, X., McManus, M. Lentivirus production. Journal of Visualized Experiments. (32), e1499(2009).
- Schneider, C. A., Rasband, W. S., Eliceiri, K. W. NIH Image to ImageJ: 25 years of image analysis. Nature Methods. 9 (7), 671-675 (2012).
- Schindelin, J., et al. Fiji: an open-source platform for biological-image analysis. Nature Methods. 9 (7), 676-682 (2012).
- R Development Core Team. R: A language and environment for statistical computing. , R Foundation for Statistical Computing. Vienna, Austria. Available from: http://www.R-project.org (2008).
- Jung, C. B., et al. Dantrolene rescues arrhythmogenic RYR2 defect in a patient-specific stem cell model of catecholaminergic polymorphic ventricular tachycardia. EMBO Molecular Medicine. 4 (3), 180-191 (2012).
- Lemoine, M. D., et al. Human iPSC-derived cardiomyocytes cultured in 3D engineered heart tissue show physiological upstroke velocity and sodium current density. Scientific Reports. 7, 5464(2017).
- Dorn, T., et al. Direct nkx2-5 transcriptional repression of isl1 controls cardiomyocyte subtype identity. Stem Cells. 33 (4), 1113-1129 (2015).
- Kaestner, L., et al. Genetically Encoded Voltage Indicators in Circulation Research. International Journal of Molecular Sciences. 16 (9), 21626-21642 (2015).
Access restricted. Please log in or start a trial to view this content.
Przedruki i uprawnienia
Zapytaj o uprawnienia na użycie tekstu lub obrazów z tego artykułu JoVE
Zapytaj o uprawnieniaPrzeglądaj więcej artyków
This article has been published
Video Coming Soon
Copyright © 2025 MyJoVE Corporation. Wszelkie prawa zastrzeżone