
The Implicit Association Test
Przegląd
Source: Julian Wills & Jay Van Bavel—New York University
One of the core constructs in social psychology is the notion of an attitude toward an object or person. Traditionally, psychologists measured attitudes by simply asking people to self-report their beliefs, opinions, or feelings. This approach has limitations, however, when measuring socially sensitive attitudes, like racial prejudice, because people are often motivated to self-report unprejudiced, egalitarian beliefs (despite harboring negative associations). In order to bypass this social-desirability bias, psychologists have developed a number of tasks that attempt to measure implicit attitudes that are less amenable to deliberate control (and potential distortion).
The Implicit Association Test, or IAT, is one of the most influential measures of these unconscious attitudes. The IAT was first introduced in a 1998 paper by Anthony Greenwald and colleagues.1 This video will demonstrate how to conduct the IAT used in the final experiment, where European American participants (who report explicit egalitarian attitudes) exhibit implicit preferences for their own race.
Procedura
1. Participant Recruitment
- Conduct a power analysis and recruit enough participants to obtain sufficient statistical power to detect the observed effect size and then obtain informed consent.
2. Data Collection
- Assemble a list of 12 words with pleasant—good—associations (e.g., happy, lucky, gift) and 12 words with unpleasant—bad— associations (e.g., hatred, disaster, poison).
- Assemble 12 European American and 12 African American faces (half male, half female), cropped at the chin and forehead.
- Create a stimulus presentation script with five blocks (i.e., sequences).
- The script should only allow three keyboard responses: (1) ‘SPACEBAR’ for advancing instructions, (2) ‘E’ to select anchors on the left, and (3) ‘I’ to select anchors on the right.
- In addition to recording the participant’s key presses, the script should also record their response latency (i.e., time between each stimulus presentation and response provided).
- Block 1: Initial target-concept discrimination. Setup the race anchors so that Black is displayed on one side of the screen and White is displayed on the opposite side. The specific orientation should be counterbalanced across subjects (i.e., half of the subjects should see Black on the left and White on the right). This block consists of 40 trials total: The first 20 are practice trials, whereas data are analyzed in the latter 20 trials. Randomly sample (without replacement) the fifty faces so that each is displayed exactly twice (once for practice trials, once for real trials). Separate the display of each trial by an inter-trial delay of 100 ms, 400 ms, or 700 ms (randomly chosen each trial).
- Block 2: Associated attribute discrimination. Setup the valence anchors so that pleasant is displayed on one side of the screen and unpleasant is displayed on the opposite side. This block has all the same characteristics as Block 1 (i.e., counterbalancing, number of trials, inter-trial delay) except that the valence words (e.g., good, bad) are displayed instead of faces.
- Block 3: Initial combined task. Display both the race and valence anchors using the same orientation as the preceding blocks (i.e., if Black was displayed on the right for Block 1 then it should also appear on the right for this block). Present each of the 12 faces and 12 valence words at least twice, for a total of 40 trials. Use the same inter-trial delays from the preceding blocks.
- Block 4: Reversed target-concept discrimination. Remove the valence anchors and swap the race anchors so that Black is now displayed on the screen where White was originally displayed (and vice versa). Otherwise, this block retains all the characteristics of Block 1.
- Block 5: Reversed combined task. This block is identical to Block 3 except that the race anchors are now in the same position as they were in Block 4. Block 3 and 5 should be counterbalanced across participants.
- For all blocks, instruct participants to classify the faces/terms as quickly as possible, based on the category they are associated with.
- After completing the computer-administered IAT tasks, distribute several questionnaires that measure race-related attitudes and beliefs.
- To allow participants to know that they have privacy, have them complete these questionnaires in personal experimental rooms. Also inform them that they will be placing their completed questionnaires in an unmarked envelope before returning them to the experimenter.
- The surveys should include a feeling thermometer and semantic differential measures targeted at the racial concepts of Black and White—the Modern Racism Scale2—as well as the Diversity and Discrimination Scales.3
- Use 7-point scales for each of the five semantic dimensions with the following polar-opposite adjective pairs as anchors: beautiful–ugly, good–bad, pleasant–unpleasant, honest–dishonest, nice–awful.
- Instruct participants to rate items from all four object categories using these five semantic dimensions.
- Instruct participants to mark the middle of the scale if they considered both anchoring adjectives to be irrelevant to the category.
- Debriefing: To complete the study, tell the participant about the exact nature of the study.
3. Data Analysis
- Recode reaction times less than 300 ms to 300 ms, as well as reaction times longer than 3000 ms to 3000 ms, so that these extreme observations do not unduly influence the analysis.
- Because the reaction time data is positively skewed, log transform all reaction times data so that it is more normally distributed.
- Then compare the mean reaction times on Block 3 with Block 5.
- Subtract these scores to compute an index for the IAT effect.
- Positive scores reflect an implicit preference for Black versus White (i.e., pro-Black), negative scores reflect an implicit preference for White versus Black (i.e., pro-White), whereas a score of zero indicates equivalent implicit preference for Black and White.
- Compute a semantic differential score by averaging explicit ratings for the five dimensions for each concept, using a scale from -3 (negative) to 3 (positive).
Wyniki
This procedure typically results in considerably slower responses during Black/pleasant compared to White/pleasant trials (Figure 1). Since slower responses are interpreted to reflect more difficult associations, this longer relative latency (i.e., delay) suggests an implicit attitudinal preference for White over Black. That is, subjects typically find it more challenging to associate Black faces with pleasant nouns. Moreover, when exclusively analyzing responses from White participants, for instance, they often self-report egalitarian preferences (i.e., no preference for either White or Black), despite IAT scores that reveal a strong implicit preference for White over Black (Figure 2).
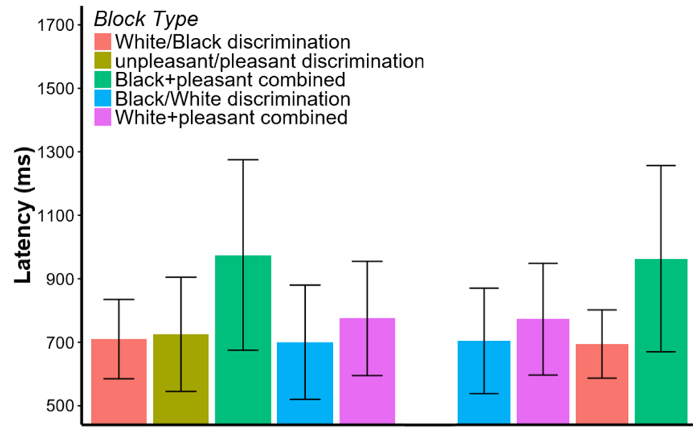
Figure 1. A typical outcome of the Implicit Association Test. White subjects who performed the Black/pleasant block first. The mean reaction time scores (untransformed) are displayed on the y-axis with error bars equal to one standard deviation. Although the reaction times are log transformed for the analysis, the untransformed scores are displayed for easier interpretation. The x-axis displays the order in which these subjects encountered these blocks. This figure was adapted from Greenwald, McGhee, and Schwartz.1
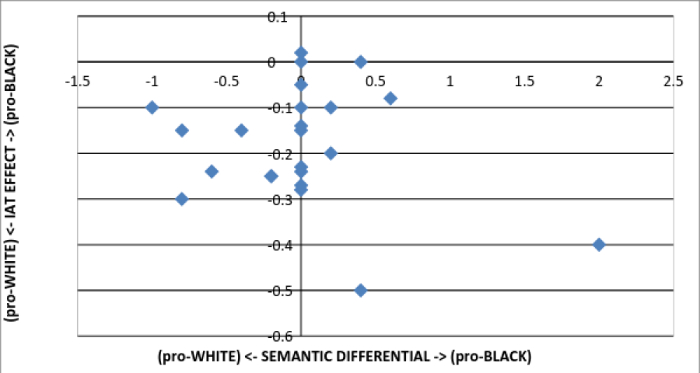
Figure 2. Relationship of IAT scores to explicit preferences among White participants. The IAT effects scores are displayed on the y-axis with positive scores indicating pro-Black preferences, negative scores indicating pro-White preferences, and zero indicating no differential preference. The semantic differential scores are displayed on the x-axis with positive scores indicating pro-Black preferences, negative scores indicating pro-White preferences, and zero indicating no differential preference. Virtually all White participants that report an explicit pro-Black or egalitarian (i.e., score of zero) semantic preference also show a pro-White preference on the IAT. This figure was adapted from Greenwald, McGhee, and Schwartz.1
Wniosek i Podsumowanie
Since the original paper, the IAT has been extended to examine prejudice in many other domains, such as gender, religion, and sexuality.4 In addition, the IAT has been adapted to (1) dissociate implicit attitudes from stereotypes, (2) measure self-esteem by pairing self/other with pleasant/unpleasant words, and (3) reveal implicit attitudes in children. In some cases, the IAT provides better predictive validity than self-report measures, such as discrimination and suicidal behavior.5
One of the reasons it has become so influential is that it had been made available online at a website called Project Implicit (https://implicit.harvard.edu/implicit/) where anyone can participate in multiple versions. Millions of people have now completed the measure and they have received immediate feedback on how their own implicit preferences compare to other people who have completed the test. The research on implicit bias has had massive implications outside the field of psychology, and implicit bias training is now common in major organizations, governmental agencies, and police departments.
Odniesienia
- Greenwald, A. G., McGhee, D. E., & Schwartz, J. L. (1998). Measuring individual differences in implicit cognition: the Implicit Association Test. Journal of personality and social psychology, 74, 1464.
- McConahay, J. B., Hardee, B. B., & Batts, V. (1981). Has racism declined in America? It depends on who is asking and what is asked. Journal of Conflict Resolution, 25, 563-579.
- Wittenbrink, B., Judd, C. M., & Park, B. ( 1997). Evidence for racial prejudice at the implicit level and its relationship with questionnaire measures. Journal of Personality and Social Psychology, 72, 262-274.
- Nosek, B. A., Smyth, F. L., Hansen, J. J., Devos, T., Lindner, N. M., Ranganath, K. A., Smith, C.T., et al. (2007). Pervasiveness and correlates of implicit attitudes and stereotypes. European Review of Social Psychology, 18, 36-88.
- Nock, M. K., Park, J. M., Finn, C. T., Deliberto, T. L., Dour, H. J., & Banaji, M. R. (2010). Measuring the suicidal mind: implicit cognition predicts suicidal behavior. Psychological Science, 21, 511-517.
Tagi
Przejdź do...
Filmy z tej kolekcji:

Now Playing
The Implicit Association Test
Social Psychology
52.8K Wyświetleń
The Implicit Association Test
Social Psychology
52.8K Wyświetleń

Persuasion: Motivational Factors Influencing Attitude Change
Social Psychology
25.7K Wyświetleń

Misattribution of Arousal and Cognitive Dissonance
Social Psychology
16.7K Wyświetleń
Copyright © 2025 MyJoVE Corporation. Wszelkie prawa zastrzeżone