A subscription to JoVE is required to view this content. Sign in or start your free trial.
Method Article
Photobleaching Assays (FRAP & FLIP) to Measure Chromatin Protein Dynamics in Living Embryonic Stem Cells
In This Article
Summary
We describe photobleaching methods including Fluorescence Recovery After Photobleaching (FRAP) and Fluorescence Loss In Photobleaching (FLIP) to monitor chromatin protein dynamics in embryonic stem (ES) cells. Chromatin protein dynamics, which is considered to be one of the means to study chromatin plasticity, is enhanced in pluripotent cells.
Abstract
Fluorescence Recovery After Photobleaching (FRAP) and Fluorescence Loss In Photobleaching (FLIP) enable the study of protein dynamics in living cells with good spatial and temporal resolution. Here we describe how to perform FRAP and FLIP assays of chromatin proteins, including H1 and HP1, in mouse embryonic stem (ES) cells. In a FRAP experiment, cells are transfected, either transiently or stably, with a protein of interest fused with the green fluorescent protein (GFP) or derivatives thereof (YFP, CFP, Cherry, etc.). In the transfected, fluorescing cells, an intense focused laser beam bleaches a relatively small region of interest (ROI). The laser wavelength is selected according to the fluorescent protein used for fusion. The laser light irreversibly bleaches the fluorescent signal of molecules in the ROI and, immediately following bleaching, the recovery of the fluorescent signal in the bleached area - mediated by the replacement of the bleached molecules with the unbleached molecules - is monitored using time lapse imaging. The generated fluorescence recovery curves provide information on the protein's mobility. If the fluorescent molecules are immobile, no fluorescence recovery will be observed. In a complementary approach, Fluorescence Loss in Photobleaching (FLIP), the laser beam bleaches the same spot repeatedly and the signal intensity is measured elsewhere in the fluorescing cell. FLIP experiments therefore measure signal decay rather than fluorescence recovery and are useful to determine protein mobility as well as protein shuttling between cellular compartments. Transient binding is a common property of chromatin-associated proteins. Although the major fraction of each chromatin protein is bound to chromatin at any given moment at steady state, the binding is transient and most chromatin proteins have a high turnover on chromatin, with a residence time in the order of seconds. These properties are crucial for generating high plasticity in genome expression1. Photobleaching experiments are therefore particularly useful to determine chromatin plasticity using GFP-fusion versions of chromatin structural proteins, especially in ES cells, where the dynamic exchange of chromatin proteins (including heterochromatin protein 1 (HP1), linker histone H1 and core histones) is higher than in differentiated cells2,3.
Protocol
1. Plating the ES Cells
T = 0 hrs
MEF plating
- Coat the live imaging 8-well μ-Slides (ibidi; Munich, Germany) with gelatin or in chambered cover glasses (Lab-Tek; Rochester, NY) or in glass-bottom culture dishes (MatTek; Ashland, MA). Leave for 5-30 min and aspirate away the free gelatin.
- Seed 22,000 MEFs/well in 250 μl total volume of DMEM [supplemented with 10% fetal bovine serum (FBS)]. Allow cells to grow in a tissue culture incubator (37°C, 5% CO2).
T = 6 hrs
ES cell plating
- Aspirate DMEM.
- Seed each MEF coated well with 15,000 R1 cells/well in 250 μl total volume of ES cell media [supplemented with 10% ESC-grade fetal bovine serum (FBS), 1 mM sodium pyruvate, 0.1 mM nonessential amino acids, 0.1 mM β-mercaptoethanol, and 1000 U/ml leukemia inhibitory factor (LIF)], to obtain 30% to 50% confluence the following day.
2. Transfecting the ES Cells
T = 24 hrs
Transient transfection
- Replace the ES cell media with 250 μl/well of fresh ES cell media.
- In a 1.5-ml sterile test tube, add 100 μl serum free media [Opti-MEM (Gibco)], then add 10 μl TransIT-LT1 transfection reagent (Mirus) directly into the serum free media. Mix by gentle pipetting and incubate at room temperature for 5-20 min.
- Add 1.5 μg GFP fusion plasmid DNA (H1e, H1o or HP1) to the diluted transit-LT1 reagent. Mix by gentle pipetting and incubate at room temperature for 15-30 min.
- Add 13.5 μl/well of the transfection mixture. Swirl the 8-well μ-Slides to ensure even dispersal. After 24 hrs replace the old ES cell media with 250 μl of fresh ES cell media.
3. Performing FRAP and FLIP
T = 48-72 hrs
- The experiment can be performed on any confocal laser scanning microscope (CLSM) but since in a normal FRAP/FLIP experiment, many consecutive images are acquired, it is recommended to use a spinning-disk confocal microscope, which enables acquisition speed and ensures that no undesired sample bleaching will occur following the initial intentional bleaching event. Here, we recommend using the Revolution spinning disk confocal system (www.Andor.com), with the Yokogawa CSU-X spinning disk head. This system has the dual capacity to photobleach using a specialized FRAPPA module with a point scanning system, and to rapidly switch the light back to collect images using the spinning disk. The 3 most common fluorescing proteins used for photobleaching experiments are GFP, YFP and Cherry. If GFP or YFP are used, a ~488 nm laser is required. For Cherry, use a ~560 nm laser. In all cases, we recommend using solid state lasers. Having an automated stage is useful but not required. Since live cells are imaged, it is essential to use an environmental chamber (we use one from LIS, Switzerland), controlling oxygen, humidity, CO2 and temperature. FRAP is performed using maximum laser intensity while imaging is done with the minimal laser power required (usually in the area of 10%, when fluorescence level is adequate).
Observe the cells with fluorescent light of the appropriate wavelength and select a cell expressing GFP using a 60X oil immersion lens. Ensure correct subcellular distribution. Occasionally, when expression levels are too high, the protein's localization may 'spill' to other compartments such as the nucleolus. Such cells should not be selected. - Now set an imaging protocol: collect 3-5 frames before the photobleaching, then photobleach at euchromatin or heterochromatin (viewed as condensed GFP foci) and collect 90-120 frames after the photobleach, with 250-1000 ms intervals: H1e-GFP, 1000 ms, H1o and HP1-GFP, 250 ms (interval time changes according to the protein dynamics, where highly dynamic proteins require shorter interval time). We normally use 80-100% laser intensity for photobleaching with a laser pulse of 20-40 μseconds (1-2 iterations), but these numbers can change according to the analyzed protein and the expression levels. When photobleaching is appropriate, you should observe a "black hole" in your GFP fluorescence. The black hole is gradually re-filled with fluorescence following recovery. Although the spinning disk can obtain up to around 60 images per second (with good fluorescence intensity and when zooming in on a single cell), we do not recommend using the system at such high speeds due to low image quality and potential increased phototoxicity.
- For a FLIP experiment, set up a different imaging protocol: collect 3-5 frames before bleaching, then start repeated bleaching on the same spot while collecting images. For H1e-GFP, bleach every 5 sec, for H1o-GFP, bleach every 2 sec, and for HP1-GFP bleach every 1 sec. Bleach and collect images repeatedly throughout the entire experiment.
- For either technique, repeat the process on 20-30 cells. For statistical purposes, repeat experiment 3 times or more, preferably on different days. In homogenous populations and correct settings, standard deviation is usually low (< 5%).
For both FRAP and FLIP, the size and shape of the bleached region influences the recovery dynamics and must remain constant within an experiment. Also, when two cells are compared, identical protocols must be used and the cells must be analyzed sequentially on the same day as power laser and other conditions may fluctuate and may affect the outcome of the experiment.
4. FRAP and FLIP Data Analysis
- In all FRAP frames collected, measure the fluorescence intensity in the ROI (ROIb = bleached area), the background area (ROIbg), and the non-bleached nuclear area (ROInb) as a function of time before and after bleaching. When the bleached region is negligible the entire nucleus can be selected for normalization purposes.
- For every time point, normalize data according to the formula: (ROIb - ROIbg)/(ROInb - ROIbg) / (pbROIb - pbROIbg)/(pbROInb - pbROIbg), pb denotes pre-bleached. For pre-bleach images you should get a value of approximately 1. The first image after the bleach will indicate the Bleach Depth. Subtract the value from 1 for the actual Bleach Depth value. Repeat for every cell and average 20-30 cells from each experiment.
- In all FLIP frames collected, measure the fluorescence intensity in the non-bleached nuclear area, and the background area (ROInb = non-bleached area,
ROIbg = background). Calculation of FLIP data is similar to a FRAP curve, only the analyzed ROI (ROInb) should be different than the actual bleached region, which is not used for calculation: (ROInb - ROIbg)/(pbROInb - pbROIbg). It is also possible to use a neighboring cell (ROIn = neighbor cell) for normalization purposes: (ROInb - ROIbg)/(ROIn - ROIbg) / (pbROInb - pbROIbg)/(pbROIn - pbROIbg).
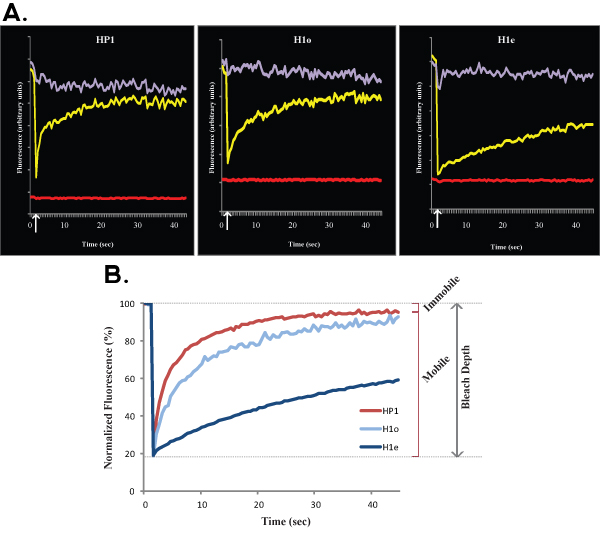
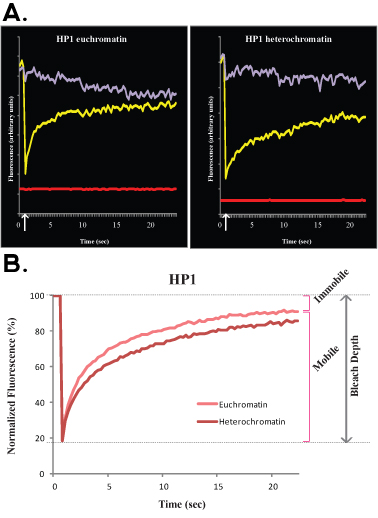
Following data collection, it is possible to fit the experimental data to computer simulation. This allows calculating, with a good proximity, the mobile fraction, the immobile fraction and the half-maximum. We will not discuss the mathematical and statistical aspects of FRAP analyses here and refer the reader to other excellent publications4-9. The bleach depth refers to the distance (on the y-axis) between the pre-bleach (100%) signal and the first image after bleach; the mobile fraction refers to the distance (on the y-axis) between the bleach depth and the recovered signal when the kinetics reaches a plateau, and the immobile fraction refers to the distance (on the y-axis) between the recovered signal and the pre-bleach (100%) signal (see Figures 1B and 2B). Beyond this analysis, there are good mathematical models to fit the data. For a single exponent, the equation

where t is time, A is the mobile fraction, 1-A is the immobile fraction and koff is the dissociation constant, can be used to fit the data, and a direct estimate of the off rate of binding (koff) can be obtained, as well as for the parameter A, which can be used to calculate the association rate.
5. Representative Results:

Figure 1. A and B show representative FRAP curves of HP1 (left), H1o (middle) and H1e (right) in R1 ES cells. For simplicity and clarity Figure 1A shows the raw data of a single cell before any normalization and calculation. The yellow curve corresponds to the bleached region, the purple curve corresponds to the non-bleached nuclear area (when the bleached region is negligible the entire nucleus can be selected for normalization purposes), and the red line corresponds to the background fluorescence, which is minimal in this case. Vertical arrow represents the bleach time. Normalized and averaged data is shown in Figure 1B. Note the slower recovery of H1 (blue) compared with HP1 (red). Also the H1e variant (dark blue) is slower than the H1o variant (light blue). Mobile and immobile fractions and Bleach Depth are indicated for HP1.

Figure 2. A and B show representative FRAP curves comparing euchromatin (left) with heterochromatin (right) of HP1 in R1 ES cells. Similarly to Figure 1, Figure 2A shows raw data of a single cell, yellow curve corresponds to the bleached region, purple curve corresponds to the non-bleached nuclear area, and the red line corresponds to the background fluorescence. Vertical arrow represents the bleach time. Normalized and averaged data is shown in Figure 2B. Note the slower recovery of heterochromatin (dark red) compared with euchromatin (light red). Mobile and immobile fractions and Bleach Depth are indicated for euchromatin.

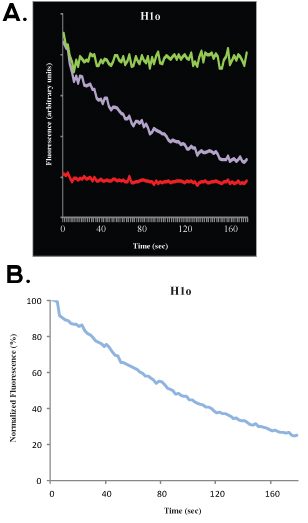
Figure 3.. A typical FLIP experiment of H1o R1 ES cells is shown in Figure 3A (raw, un-normalized data) and B (normalized and averaged data). In this experiment the purple curve corresponds to the non-bleached nuclear area, the green line corresponds to a neighboring cell nucleus and the red line corresponds to the background fluorescence.
Discussion
Unlike most available techniques, which involve purified chromatin from cell populations or fixed cells, FRAP experiments follow changes in chromatin protein dynamics in living cells. We found chromatin protein dynamics to be a good indicator for chromatin plasticity. However, because it requires fusing the gene of interest with GFP, the addition of the fluorescent tag can interfere with the protein's function. Thus, prior to proceeding with FRAP, the fusion protein must be rigorously tested to ensure it has the same pro...
Disclosures
No conflicts of interest declared.
Acknowledgements
We thank members of the Meshorer lab, especially Shai Melcer, Adi Alajem, Edupuganti Raghu Ram, Badi Sri Sailaja, Anna Mattout and Alva Biran, for critical comments and for trouble-shooting photobleaching experiments on a daily basis. EM is a Joseph H. and Belle R. Braun Senior Lecturer in Life Sciences and is supported by the Israel Science Foundation (ISF 943/09), the Israel Ministry of Health (6007) the European Union (IRG-206872 and 238176), the Israel Cancer Research Foundation, the Internal Applicative Medical Grants of the Hebrew University and the Israel Psychobiology Institute.
Materials
| Name | Company | Catalog Number | Comments |
| DMEM | Sigma-Aldrich | D5671 | |
| Gelatin | Merck & Co., Inc. | 1.04078 | |
| Opti-MEM | GIBCO, by Life Technologies | 31985 | |
| TransIT-LT1 | Mirus Bio LLC | MIR2300 | |
| 8-well μ-Slides | ibidi | 80826 |
References
- Phair, R. D. Global nature of dynamic protein-chromatin interactions in vivo: three-dimensional genome scanning and dynamic interaction networks of chromatin proteins. Mol Cell Biol. 24, 6393-6402 (2004).
- Meshorer, E., Girard, L. . Imaging chromatin in embyonic stem cells in StemBook. , (2008).
- Meshorer, E. Hyperdynamic plasticity of chromatin proteins in pluripotent embryonic stem cells. Dev Cell. 10, 105-116 (2006).
- Bancaud, A., Huet, S., Rabut, G., Ellenberg, J. . Fluorescence perturbation techniques to study mobility and molecular dynamics of proteins in live cells: FRAP, photoactivation, photo conversion, and FLIP. , (2009).
- Dundr, M., Misteli, T. Measuring dynamics of nuclear proteins by photobleaching. Curr Protoc Cell Biol. Chapter 13, Unit 13-Unit 13 (2003).
- Ellenberg, J. Nuclear membrane dynamics and reassembly in living cells: targeting of an inner nuclear membrane protein in interphase and mitosis. J Cell Biol. 138, 1193-1206 (1997).
- Lenser, T., Weisshart, K., Ulbricht, T., Klement, K., Hemmerich, P. Fluorescence fluctuation microscopy to reveal 3D architecture and function in the cell nucleus. Methods Cell Biol. 98, 2-33 (2010).
- Mueller, F., Mazza, D., Stasevich, T. J., McNally, J. G. FRAP and kinetic modeling in the analysis of nuclear protein dynamics: what do we really know. Curr Opin Cell Biol. 22, 403-411 (2010).
- Phair, R. D., Misteli, T. Kinetic modelling approaches to in vivo imaging. Nat Rev Mol Cell Biol. 2, 898-907 (2001).
- Poser, I. BAC TransgeneOmics: a high-throughput method for exploration of protein function in mammals. Nat Methods. 5, 409-415 (2008).
- Sigal, A. Generation of a fluorescently labeled endogenous protein library in living human cells. Nat Protoc. 2, 1515-1527 (2007).
- Cohen, A. A. Dynamic proteomics of individual cancer cells in response to a drug. Science. 322, 1511-1516 (2008).
Reprints and Permissions
Request permission to reuse the text or figures of this JoVE article
Request PermissionThis article has been published
Video Coming Soon
Copyright © 2025 MyJoVE Corporation. All rights reserved