A subscription to JoVE is required to view this content. Sign in or start your free trial.
Method Article
Utilizing Transcranial Magnetic Stimulation to Study the Human Neuromuscular System
In This Article
Summary
Transcranial magnetic stimulation (TMS) is a non-invasive tool to gain insight on the physiology and function of the human nervous system. Here, we present our TMS techniques to study cortical excitability of the upper limb and lumbar musculature.
Abstract
Transcranial magnetic stimulation (TMS) has been in use for more than 20 years 1, and has grown exponentially in popularity over the past decade. While the use of TMS has expanded to the study of many systems and processes during this time, the original application and perhaps one of the most common uses of TMS involves studying the physiology, plasticity and function of the human neuromuscular system. Single pulse TMS applied to the motor cortex excites pyramidal neurons transsynaptically 2 (Figure 1) and results in a measurable electromyographic response that can be used to study and evaluate the integrity and excitability of the corticospinal tract in humans 3. Additionally, recent advances in magnetic stimulation now allows for partitioning of cortical versus spinal excitability 4,5. For example, paired-pulse TMS can be used to assess intracortical facilitatory and inhibitory properties by combining a conditioning stimulus and a test stimulus at different interstimulus intervals 3,4,6-8. In this video article we will demonstrate the methodological and technical aspects of these techniques. Specifically, we will demonstrate single-pulse and paired-pulse TMS techniques as applied to the flexor carpi radialis (FCR) muscle as well as the erector spinae (ES) musculature. Our laboratory studies the FCR muscle as it is of interest to our research on the effects of wrist-hand cast immobilization on reduced muscle performance6,9, and we study the ES muscles due to these muscles clinical relevance as it relates to low back pain8. With this stated, we should note that TMS has been used to study many muscles of the hand, arm and legs, and should iterate that our demonstrations in the FCR and ES muscle groups are only selected examples of TMS being used to study the human neuromuscular system.
Protocol
1. Single and Paired-Pulse TMS of the FCR and ES Muscles
- Basic Safety Precautions: Prior to performing TMS on a human subject it is necessary to first screen them for basic safety precautions as it pertains to exposure to a magnetic field. In our laboratory we follow the screening guidelines set forth by the Institute for Magnetic Resonance Safety, Education and Research 10. In our laboratory we also routinely exclude individuals with a family history of epilepsy seizures. We also require subjects undergoing TMS of the ES muscles to wear earplugs and a mouth guard due to the less focal and stronger stimulation intensities.
- Electrical Recordings: To examine TMS responses in the motor system it is necessary to record electromyographic (EMG) signals from skeletal muscles. For the FCR muscle we place surface electrodes on the forearm using a bipolar electrode arrangement located longitudinally over the muscle on shaved and abraded skin as we have previously described 7,11. For the erector spinae muscles we use a similar electrode arrangement located longitudinally over the muscles at the L3-L5 vertebral level on shaved and abraded skin 8.
- TMS Coil Orientation: To predominantly activate corticospinal neurons transsynaptically it is necessary to position the TMS coil appropriately 12. For the FCR muscles we place a 70-mm figure-of-eight TMS coil tangential to the scalp and 45-degrees to the midline so that the induced current flows in a lateral-posterior to medial-anterior direction. For the ES muscles we use a double-cone coil that has greater penetration depth and is needed due to the representation of these muscles being deeper in the homunculus. Here, the coil is positioned such that the current flows in an anterior to posterior direction. We have custom-modified our coil with a laser attachment system to assist us in subsequent re-positioning of the double cone coil.
- Identifying 'Hotspot': It is necessary to determine the stimulation location that elicits the largest motor evoked potential. For the FCR muscle we do this by subtly moving the TMS coil around in very small increments and determining where we observe the largest motor evoked potential amplitude. Once located we note this area with indelible ink on either the scalp or a lycra cap. TMS of the ES muscles is considerably more uncomfortable to human subjects than TMS of upper limb muscles. Accordingly, we have streamlined our TMS protocol for the ES muscles to increase it's tolerability and feasibility. Here, instead of locating the "hotspot" we use anthropometric measurements to identify the vertex of the skull. Specifically, we identify the vertex as the intersection of the skull in the sagittal (between the nasinon and inion) and coronal (between the tragus) planes.
- Biomechanical Positioning: In our laboratory when we perform TMS of the FCR muscles subjects are seated with the arm resting in an extended position in a BioDex System 4 Dynamometer (Figure 2). However, we should note that this is only an example of one possible set-up for measuring exerted forces. For the ES muscles subjects are asked to sit with an upright posture while their hands rest in their lap (Figure 3). They are seated in a swivel base chair with the thigh at 90° relative to the trunk, the lower leg at ~45° relative to the thigh, and the lumbar spine in a neutral posture8.
- Quantifying Motor Threshold: For the FCR, we determine motor threshold (MT) by delivering single pulses at gradually increasing stimulation intensities until motor evoked potentials have peak-to-peak amplitudes greater than 50 microvolts in more than 50% of trials (Figure 4). To streamline the TMS protocol and increase tolerability and feasibility we do not determine motor threshold in the ES muscles with the same precision as when we test the upper limb musculature. Rather, we begin the TMS protocol by delivering an initial single pulse at 50% of the maximum stimulator output to determine if this stimulus intensity is above or below motor threshold. If an MEP is observed at this stimulus intensity-defined as discernable MEP relative to the level of the background EMG-the intensity is reduced to 40% of stimulator output to determine if this stimulus intensity is sub- or supra-threshold 8.
- Quantifying MEP Amplitude using Single-Pulse TMS: To examine the motor evoked potential amplitude of the FCR we deliver a single TMS pulse to the 'hotspot' at an intensity equal to 130% of motor threshold, and calculate the peak-to-peak amplitude. Generally, we normalize this outcome to the maximal compound muscle fiber action potential observed following supramaximal electrical stimulation of the median nerve. We should note that the MEP size is very dependent on the degree of cortical excitability. Accordingly, when the TMS pulse is delivered during a background contraction, when cortical excitability is increased, the MEP size will dramatically increase. For the ES muscles, we deliver a single TMS pulse to the vertex at an intensity 40 or 50% above the sub-motor threshold intensity 8. Unfortunately, because peripheral nerves innervating the ES muscles are not accessible to electrical stimulation we are not able to normalize these motor evoked potentials to the compound muscle fiber action potential.
- Quantifying Silent Period Duration using Single-Pulse TMS: When a TMS pulse to the cortex is delivered during a muscle contraction it will produce a motor evoked potential followed by electrical quiescence before activity resumes that is indicative of corticospinal inhibition and commonly referred to as the silent period 13 (Figure 5). To quantify the silent period we deliver a single TMS pulse to the 'hotspot' at an intensity equal to 130% of motor threshold while the study participant is performing a wrist flexion muscle contraction at 15% of their maximal strength. We have not previously quantified the silent period duration of the ES muscles; however, we should note that we have anecdotally observed its existence in this muscle group when the TMS pulse id delivered during a background contraction.
- Quantifying Intracortical Facilitation using Paired-Pulse TMS: We use paired-pulse TMS to quantify intracortical facilitation 6,7 (Figure 6 and 7 represents this measurement for the FCR and ES muscles, respectively). For the FCR muscle we first determine the stimulus intensity needed to elicit a motor evoked potential that is between 0.5-1.0 mV. Next, we deliver a subthreshold conditioning pulse-which in our laboratory is commonly set equal to 70% of motor threshold- 15-msec before the suprathreshold test pulse. This conditioning pulse delivered at this time period prior to the test pulse will increase, or facilitate, the amplitude of the motor evoked potential more than a single unconditioned pulse of the same intensity. For the ES muscle group the conditioning pulse intensity is set to the observed sub-motor threshold intensity (either 40% or 50% of stimulator output) and the test pulse intensity is set to 40% above the sub-motor threshold level (80% or 90% of stimulator output)8. We should note that the intensity of the conditioning pulses could be varied depending on the objective of the study. Similarly, the pulse intervals can vary depending on the muscle and its location relative to the cortex.
- Quantifying Short-Interval Intracortical Inhibition using Paired-Pulse TMS: We also use paired-pulse TMS to quantify short-interval intracortical inhibition 6,7 (Figure 6 and 7 represents this measurement for the FCR and ES muscles, respectively). Here, for both the FCR and ES muscles, the procedures are the same as described for measuring intracortical facilitation with the exception that the interstimulus interval between the two pulses is reduced to 3 msec. This conditioning pulse delivered at this time period prior to the test pulse will decrease, or inhibit, the amplitude of the motor evoked potential more than a single unconditioned pulse of the same intensity.
- Quantifying Long-Interval Intracortical Inhibition using Paired-Pulse TMS: Delivering two identical suprathreshold test pulses that are separated by 100 milliseconds can also be used to assess long-interval intracortical inhibition 6,7. In this case-for the FCR muscle- the motor evoked potential associated with the second pulse will be smaller, or inhibited more, than that associated with the first (Figure 8). We have not previously quantified long-interval intracortical inhibition in the ES muscles due to concerns over subject tolerability.
2. Representative Results:
Following the delivery of a suprathreshold TMS pulse, the muscles being stimulated should demonstrate an easily observable EMG response (the MEP) (illustrated in Figures 4-8). The latency between the stimulus onset and the MEP will vary between the muscle groups being examined, but for the FCR it is generally 16-19 msec (Figure 6) and for the ES it is 17-22 msec (Figure 7; although it should be noted that in some subjects definitive MEP onset in the ES muscles is more difficult to visually identify). It should be noted that when testing the ES muscle group several other muscle groups are also visibly and dramatically stimulated concomitantly (including the muscles of the lower extremity, which are represented within the same general region of the homunculus). During the measurement of intracortical facilitation the MEP amplitude is generally larger than that observed with a single unconditioned pulse (Figure 6 and 7). However, it is our experience that the degree of facilitation varies between muscles groups with some muscle groups-such as the FCR- showing only modest facilitation in many subjects. For the measurement of short-interval and long-interval intracortical inhibition a decrease in the MEP amplitude is generally observed in comparison to a single unconditioned pulse of the same intensity (Figures 6-8).
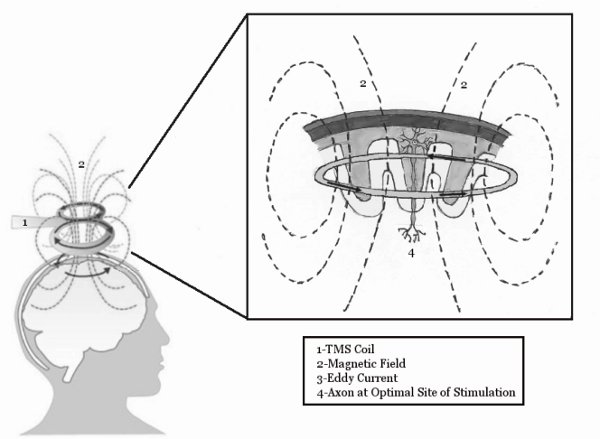
Figure 1. The basic mechanisms of TMS. The TMS coil induces a magnetic field, which penetrates the scalp and induces an Eddy current within the motor cortex. This eddy current is then able to stimulate neurons within the brain. Figure reprinted from McGinley and Clark, In Press14.
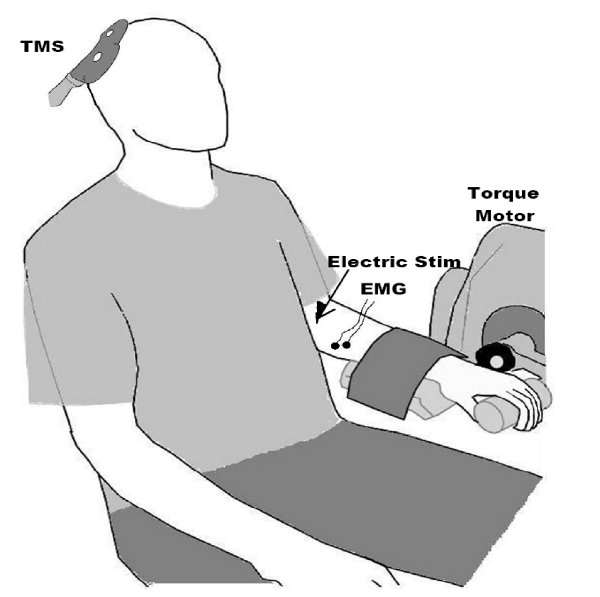
Figure 2. Setup for performing TMS on the FCR muscle. Note the recording of electromyogram (EMG) signals from the forearm, and the TMS paddle over the motor cortex. We generally also record muscle forces, and use electrical peripheral nerve stimulation to obtain the maximal compound muscle fiber action potential, as this is useful in interpreting amplitude values (e.g., one can express and MEP relative to the maximal muscle response as opposed to a absolute mV value which can be heavily influenced by non-physiologic factors such as subcutaneous adipose tissue). Figure reprinted from the following: Clark et al. 20089, Clark et al., 20106, and McGinley et al. 20107.

Figure 3. Setup for performing TMS on the erector spinale muscles. Figure reprinted from Goss et al. 20118.
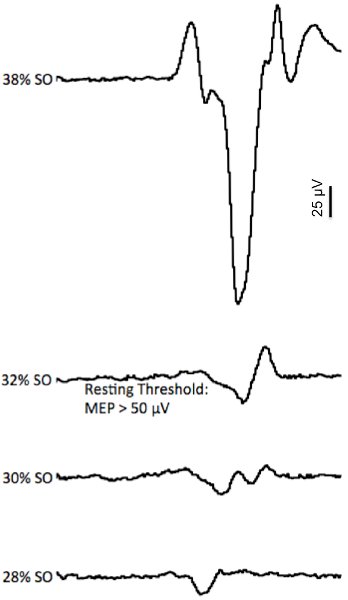
Figure 4. Example of the motor threshold determination. The EMG traces represent the motor evoked potential (MEP) response to gradually increasing stimulus intensities (represented as a percentage of stimulator output (SO)). Note that at the lower intensities (28-30% of SO) very small MEPs were elicited (sub-threshold), but that at 32% SO a MEP was elicited that reached motor threshold (typically defined as an MEP with a p-p amplitude > 50 μV).
Figure reprinted from McGinley and Clark, In Press14.
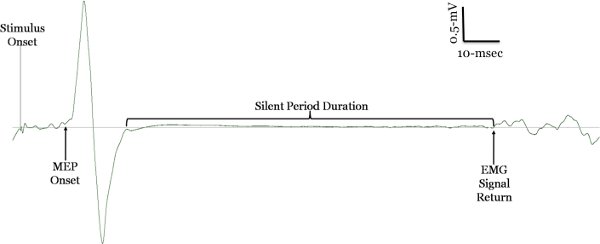
Figure 5. TMS during a contraction: motor evoked potential & silent period. The silent period is observed when a subject performs a slight contraction and a single stimulus is applied to the motor cortex. The first part of the silent period is due to spinal cord inhibition and the latter part is attributed to cortical inhibition, specifically GABAB receptors. There is no consensus way to quantify the duration of the silent period, but our findings indicate that either defining it from stimulus onset or MEP onset to the return of the voluntary interference electromyogram signal is the most reliable15.
Figure reprinted from Clark and Quick, 201116, and McGinley and Clark, In Press14.
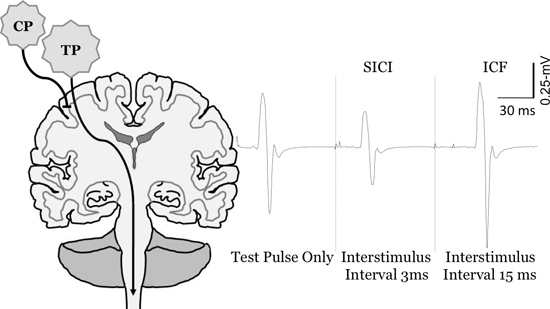
Figure 6. Change in motor evoked potential sized ith paired pulse TMS of the FCR muscle. Measurement of short-interval intracortical inhibition (SICI) and intracortical facilitation (ICF). To quantify SICI and ICF the conditioning pulse (CP) is set below motor threshold, and the test pulse (TP) is set to evoke MEP's between 0.5-1 mV. At short interstimulus intervals (e.g., 3-msec) the CP inhibits the MEP in comparison to the TP only (SICI), whereas at longer interstimulus intervals (e.g., 15-msec) it facilitates the MEP (ICF).
CP: conditioning pulse, TP: test pulse Figure reprinted from Clark et al., 20106, McGinley et al. 201014, Clark and Quick, 201116, and McGinley and Clark, In Press14.
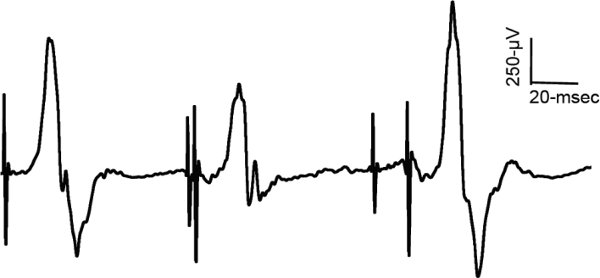
Figure 7. Change in motor evoked potential sized with paired pulse TMS of the ES muscle. Example of EMG traces from the erector spinae muscles and the measurement of short-interval intracortical inhibition (SICI) and intracortical facilitation (ICF).
Figure reprinted from Goss et al. 20118.
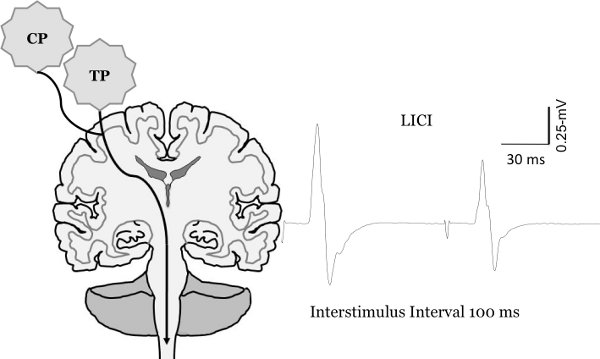
Figure 8. Change in motor evoked potential sized with paired pulse TMS. Measurement of long-interval intracortical inhibition (LICI). To quantify LICI two test pulses are delivered at an interstimulus interval of 100-msec. This results in the second MEP being inhibited in comparison to the first MEP.
Figure reprinted from Clark et al., 20106, McGinley et al. 20107 and McGinley and Clark, In Press14.
Discussion
The overall goal of this article is to provide scientists and clinicians a visual account of our laboratories use of transcranial magnetic stimulation. However, in addition to providing a visualization of these experiments, below we discuss basic issues to consider when performing TMS in this manner, provide a brief overview of the physiology of TMS responses, and also discuss our use of TMS with regards to the usage of others.
General Issues To Be Aware of When Performing TMS As Described in th...
Disclosures
No conflicts of interest declared.
Acknowledgements
This work was funded in part by a grant from the Osteopathic Heritage Foundations to BC Clark. We would like to state a special thank you to Marissa McGinley for her assistance in creating many of the figure graphics.
Materials
| Name | Company | Catalog Number | Comments |
| Transcranial Magnetic Stimulator 2002 Transcranial Magnetic Stimulator Bi-Stim2 Figure-Eight 70-mm coil Double Cone Coil | Magstim | NA | TMS equipment (including coils) |
| Biodex System 4 | Biodex | NA | Dynamometer |
| Biopac MP150 Data Acquisition System | Biopac Systems, Inc. | MP150WSW | A-D converter for EMG and force |
| AcqKnowledge 4.0 Data acquisition software | Biopac Systems, Inc. | ACK100W | |
| Nikomed Trace 1 ECG electrodes | Nikomed | 2015 | EMG electrodes |
| Constant Current Stimulator |  Digitimer Ltd. Digitimer Ltd. | DS7A | Peripheral nerve stimulator |
References
- Barker, A. T., Jalinous, R., Freeston, I. L. Non-invasive magnetic stimulation of human motor cortex. Lancet. 1, 1106-1107 (1985).
- Werhahn, K. J., et al. The effect of magnetic coil orientation on the latency of surface EMG and single motor unit responses in the first dorsal interosseous muscle. Electroencephalography and Clinical Neurophysiology. 93, 138-146 (1994).
- Kobayashi, M., Pascual-Leone, A. Transcranial magnetic stimulation in neurology. Lancet. Neurol. 2, 145-156 (2003).
- Reis, J., et al. Contribution of transcranial magnetic stimulation to the understanding of cortical mechanisms involved in motor control. J. Physiol. 586, 325-351 (2008).
- Taylor, J. L. Stimulation at the cervicomedullary junction in human subjects. Journal of Electromyography and Kinesiology: Official Journal of the International Society of Electrophysiological Kinesiology. 16, 215-223 (2006).
- Clark, B. C., Taylor, J. L., Hoffman, R. L., Dearth, D. J., Thomas, J. S. Cast immobilization increases long-interval intracortical inhibition. Muscle & Nerve. 42, 363-372 (2010).
- McGinley, M., Hoffman, R. L., Russ, D. W., Thomas, J. S., Clark, B. C. Older adults exhibit more intracortical inhibition and less intracortical facilitation than young adults. Exp. Gerontol. 45, 671-678 (2010).
- Goss, D. A., Thomas, J. S., Clark, B. C. Novel methods for quantifying neurophysiologic properties of the human lumbar paraspinal muscles. Journal of Neuroscience Methods. 194, 329-335 (2011).
- Clark, B., Issac, L. C., Lane, J. L., Damron, L. A., Hoffman, R. L. Neuromuscular plasticity during and following 3-weeks of human forearm cast immobilization. J. Appl. Physiol. 105, 868-878 (2008).
- Clark, B. C., Issac, L. C., Lane, J. L., Damron, L. A., Hoffman, R. L. Neuromuscular plasticity during and following 3 wk of human forearm cast immobilization. J. Appl. Physiol. 105, 868-878 (2008).
- Brasil-Neto, J. P., et al. Optimal focal transcranial magnetic activation of the human motor cortex: effects of coil orientation, shape of the induced current pulse, and stimulus intensity. J. Clin. Neurophysiol. 9, 132-136 (1992).
- Damron, L. A., Dearth, D. J., Hoffman, R. L., Clark, B. C. Quantification of the corticospinal silent period evoked via transcranial magnetic stimulation. Journal of Neuroscience Methods. 173, 121-128 (2008).
- McGinley, M. P., Clark, B. C. Transcranial magnetic stimulation and the human neuromuscular system. Horizons in Neuroscience Research. , (2012).
- Damron, L. A., Hoffman, R. L., Dearth, D. J., Clark, B. C. Quantification of the corticospinal silent period evoked via transcranial magnetic brain stimulation. J. Neurosci. Methods. 173, 121-128 (2008).
- Clark, B. C., Quick, A. Exploring the pathophysiology of Mal de Debarquement. J. Neurol. 258, 1166-1168 (2011).
- Ortu, E., Deriu, F., Suppa, A., Tolu, E., Rothwell, J. C. Effects of volitional contraction on intracortical inhibition and facilitation in the human motor cortex. J. Physiol. 586, 5147-5159 (2008).
- Dishman, J. D., Greco, D. S., Burke, J. R. Motor-evoked potentials recorded from lumbar erector spinae muscles: a study of corticospinal excitability changes associated with spinal manipulation. J. Manipulative. Physiol. Ther. 31, 258-270 (2008).
- Kuppuswamy, A. Cortical control of erector spinae muscles during arm abduction in humans. Gait. Posture. 27, 478-484 (2008).
- Strutton, P. H., Theodorou, S., Catley, M., McGregor, A. H., Davey, N. J. Corticospinal excitability in patients with chronic low back pain. J. Spinal. Disord. Tech. 18, 420-424 (2005).
- Taniguchi, S., Tani, T. Motor-evoked potentials elicited from human erector spinae muscles by transcranial magnetic stimulation. Spine (Philadelphia. 24, 154-157 (1999).
- Taniguchi, S., Tani, T., Ushida, T., Yamamoto, H. Motor evoked potentials elicited from erector spinae muscles in patients with thoracic myelopathy. Spinal. Cord. 40, 567-573 (2002).
- O'Connell, N. E., Maskill, D. W., Cossar, J., Nowicky, A. V. Mapping the cortical representation of the lumbar paravertebral muscles. Clin. Neurophysiol. 118, 2451-2455 (2007).
- Maeda, F., Pascual-Leone, A. Transcranial magnetic stimulation: studying motor neurophysiology of psychiatric disorders. Psychopharmacology (Berl). 168, 359-376 (2003).
- Ziemann, U. TMS and drugs. Clin. Neurophysiol. 115, 1717-1729 (2004).
- Tergau, F., et al. Complete suppression of voluntary motor drive during the silent period after transcranial magnetic stimulation. Exp. Brain. Res. 124, 447-454 (1999).
- Di Lazzaro, V., et al. The physiological basis of transcranial motor cortex stimulation in conscious humans. Clin. Neurophysiol. 115, 255-266 (2004).
- Iles, J. F., Pisini, J. V. Cortical modulation of transmission in spinal reflex pathways of man. J. Physiol. 455, 425-446 (1992).
- Gandevia, S. C., Petersen, N., Butler, J. E., Taylor, J. L. Impaired response of human motoneurones to corticospinal stimulation after voluntary exercise. J. Physiol. 521 (Pt. 3), 749-759 (1999).
- Hallett, M. Transcranial magnetic stimulation: a primer. Neuron. 55, 187-199 (2007).
- Damron, L. A., Dearth, D. J., Hoffman, R. L., Clark, B. C. Quantification of the corticospinal silent period evoked via transcranial magnetic stimulation. J. Neurosci. Methods. 173, 121-128 (2008).
- Cantello, R. Applications of transcranial magnetic stimulation in movement disorders. J. Clin. Neurophysiol. 19, 272-293 (2002).
- Chen, R. The clinical diagnostic utility of transcranial magnetic stimulation: report of an IFCN committee. Clin. Neurophysiol. 119, 504-532 (2008).
- Edwards, M. J., Talelli, P., Rothwell, J. C. Clinical applications of transcranial magnetic stimulation in patients with movement disorders. Lancet. Neurol. 7, 827-840 (2008).
- Terao, Y., Ugawa, Y. Basic mechanisms of TMS. J. Clin. Neurophysiol. 19, 322-343 (2002).
- McDonnell, M. N., Orekhov, Y., Ziemann, U. The role of GABA(B) receptors in intracortical inhibition in the human motor cortex. Exp. Brain. Res. 173, 86-93 (2006).
- Perez-de-Sa, V., et al. High brain tissue oxygen tension during ventilation with 100% oxygen after fetal asphyxia in newborn sheep. Pediatr. Res. 65, 57-61 (2009).
- Anand, S., Hotson, J. Transcranial magnetic stimulation: neurophysiological applications and safety. Brain. Cogn. 50, 366-386 (2002).
- Chen, R. Depression of motor cortex excitability by low-frequency transcranial magnetic stimulation. Neurology. 48, 1398-1403 (1997).
- Tokay, T., Holl, N., Kirschstein, T., Zschorlich, V., Kohling, R. High-frequency magnetic stimulation induces long-term potentiation in rat hippocampal slices. Neurosci. Lett. 461, 150-154 (2009).
- Taylor, J. L., Gandevia, S. C. Noninvasive stimulation of the human corticospinal tract. J. Appl. Physiol. 96, 1496-1503 (2004).
- Martin, P. G., Hudson, A. L., Gandevia, S. C., Taylor, J. L. Reproducible measurement of human motoneuron excitability with magnetic stimulation of the corticospinal tract. J. Neurophysiol. 102, 606-613 (2009).
- Cohen, L. G., Bandinelli, S., Findley, T. W., Hallett, M. Motor reorganization after upper limb amputation in man. A study with focal magnetic stimulation. Brain. 114 (Pt. 114 1B), 615-627 (1991).
- Penfield, W., Boldrey, E. Somatic motor and sensory representation in cerebral cortex of man as studied by electrical stimulation. Brain. 60, 389-443 (1937).
- Sohn, Y. H., Hallett, M. Motor evoked potentials. Phys. Med. Rehabil. Clin. N. Am. 15, 117-131 (2004).
- Thickbroom, G. W., Mastagliam, F. L., Pascual-Leone, A. . Handbook of Transcranial Magnetic Stimulation. , (2002).
- Wolf, S. L., Butler, A. J., Alberts, J. L., Kim, M. W. Contemporary linkages between EMG, kinetics and stroke rehabilitation. J. Electromyogr. Kinesiol. 15, 229-239 (2005).
- Butler, A. J., Wolf, S. L. Putting the brain on the map: use of transcranial magnetic stimulation to assess and induce cortical plasticity of upper-extremity movement. Phys. Ther. 87, 719-736 (2007).
- Curra, A. Transcranial magnetic stimulation techniques in clinical investigation. Neurology. 59, 1851-1859 (2002).
- Nudo, R. J. Plasticity. NeuroRx. 3, 420-427 (2006).
- Rossini, P. M., Dal Forno, G. Integrated technology for evaluation of brain function and neural plasticity. Phys. Med. Rehabil. Clin. N. Am. 15, 263-306 (2004).
- Lefaucheur, J. P. Methods of therapeutic cortical stimulation. Neurophysiol. Clin. 39, 1-14 (2009).
- Tyvaert, L., et al. The effect of repetitive transcranial magnetic stimulation on dystonia: a clinical and pathophysiological approach. Neurophysiol. Clin. 36, 135-143 (2006).
- Webster, B. R., Celnik, P. A., Cohen, L. G. Noninvasive brain stimulation in stroke rehabilitation. NeuroRx. 3, 474-481 (2006).
Reprints and Permissions
Request permission to reuse the text or figures of this JoVE article
Request PermissionThis article has been published
Video Coming Soon
Copyright © 2025 MyJoVE Corporation. All rights reserved