A subscription to JoVE is required to view this content. Sign in or start your free trial.
Method Article
Monitoring Kinase and Phosphatase Activities Through the Cell Cycle by Ratiometric FRET
In This Article
Summary
FRET-based reporters are increasingly used to monitor kinase and phosphatase activities in live cells. Here we describe a method on how to use FRET-based reporters to assess cell cycle-dependent changes in target phosphorylation.
Abstract
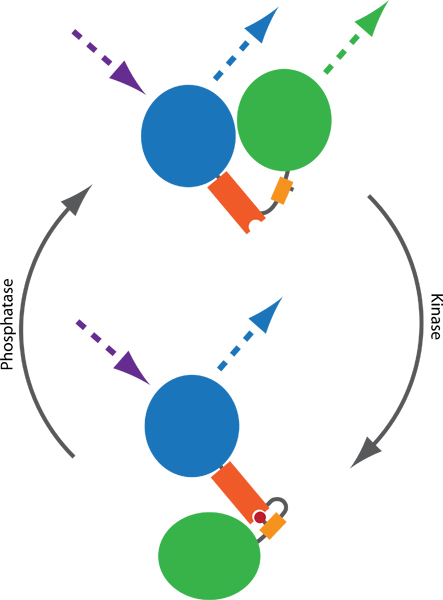
Förster resonance energy transfer (FRET)-based reporters1 allow the assessment of endogenous kinase and phosphatase activities in living cells. Such probes typically consist of variants of CFP and YFP, intervened by a phosphorylatable sequence and a phospho-binding domain. Upon phosphorylation, the probe changes conformation, which results in a change of the distance or orientation between CFP and YFP, leading to a change in FRET efficiency (Fig 1). Several probes have been published during the last decade, monitoring the activity balance of multiple kinases and phosphatases, including reporters of PKA2, PKB3, PKC4, PKD5, ERK6, JNK7, Cdk18, Aurora B9 and Plk19. Given the modular design, additional probes are likely to emerge in the near future10.
Progression through the cell cycle is affected by stress signaling pathways 11. Notably, the cell cycle is regulated differently during unperturbed growth compared to when cells are recovering from stress12.Time-lapse imaging of cells through the cell cycle therefore requires particular caution. This becomes a problem particularly when employing ratiometric imaging, since two images with a high signal to noise ratio are required to correctly interpret the results. Ratiometric FRET imaging of cell cycle dependent changes in kinase and phosphatase activities has predominately been restricted to sub-sections of the cell cycle8,9,13,14.
Here, we discuss a method to monitor FRET-based probes using ratiometric imaging throughout the human cell cycle. The method relies on equipment that is available to many researchers in life sciences and does not require expert knowledge of microscopy or image processing.
Protocol
1. Introducing the probe to cells
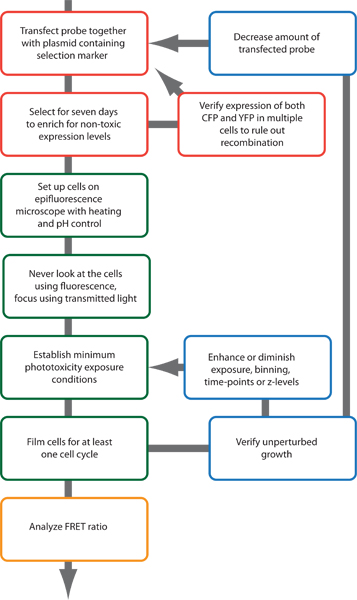
- Co-transfect cells with a FRET-based probe and a plasmid conferring resistance. Choose a transfection method that is efficient in your cell-type of interest. For U2OS cells, standard calcium phosphate transfection methods give adequate results15.
- Select cells in the appropriate antibiotic for at least seven days. This enriches the amount of cells expressing the probe and limits the amount of cells with toxic expression levels, or expression levels that severely affect the cell cycle.
- (optional) Select for stable clones.
- Using fixed or live cells, verify that both CFP and YFP are present in all cells at approximately the same ratio.
- In case some cells contain only CFP or YFP, recombination has likely occurred. Recombination can occur either during bacterial growth or after transfection of the probe and may in the latter case depend on plasmid quality. Repeat plasmid preparation and linearize the plasmid before transfection if the problem persists.
2. Monitoring ratiometric FRET
- Seed cells on glass bottom dishes, or cover slips for mounting in a chamber. Make sure that dishes/cover slips are no 1.5 (170 μm thick).
- Mount cells in growth medium without phenol red on a motorized epifluorescence microscope with temperature control set to 37 °C. Ensure pH regulation of media, either by CO2 or by using CO2-independent media such as Liebowitz-15.
- Focus on cells using transmitted light. Do not look on cells using fluorescent light.
- Start by acquiring a 12 or 16 bit image using YFP excitation (YFPex) and YFP emission (YFPem) filters and a suitable dichroic mirror. Use maximal binning available that still permits the required subcellular resolution. Using a high binning to decrease exposure time or intensity is crucial to avoid phototoxicity.
- Measure or estimate the background intensity and the approximate noise by measuring or estimating the rough average, minimum and maximum pixel values in an area devoid of cells. Change exposure time and neutral density filters so that the average signal in the cell is approximately the background intensity plus five to ten times the difference between max and min background intensities.
- Verify that images are not close to being saturated. The maximum intensity in the image should be less than half of the dynamic range (e.g. max 2000 in a 12 bit image) to allow for intensity differences when cells enter mitosis.
- Repeat step 2.4 to 2.6 using CFP excitation and YFP emission filters and a suitable dichroic mirror.
- Select multiple regions with transfected cells, excluding the regions used for point 2.4 to 2.7, and ensure that maximum intensity is less than half of the dynamic range in all cells.
- Start a time-lapse experiment acquiring two images every 45 min using YFPex - YFPem and CFPex - YFPem filter sets.
3. Verifying and optimizing conditions
- Open the acquired images and monitor the cell cycle time from mitosis to mitosis for cells that express the transfected probe.
- Compare the measured cell cycle time to published data for the cell type used. Alternatively, film untransfected cells by acquiring one image of transmitted light only (e.g. DIC or phase-contrast) every hour to get reference cell cycle times.
- In case the time from mitosis to mitosis corresponds to reference cell cycle timings, proceed to step 4. Alternatively, re-acquire images using harder exposure, more time-points or multiple z-levels and repeat step 3.
- In case the time from mitosis to mitosis does not correspond to reference cell cycle timings, film transfected cells by acquiring one image of transmitted light only (e.g. DIC or phase-contrast) every hour followed by one image at the end of the experiment to identify transfected cells.
- If the transfected cells still show longer cell cycle times, repeat step 1 but transfect less probe or select for stable clones that contain very low amounts of probe.
- If the transfected cells show normal cell cycle times in the absence of fluorescent light, repeat step 2 but lower exposure by modifying binning, neutral density filters, exposure time, and time between images.
4. Analysing FRET
- The analysis can be performed by most software dedicated to microscopy. Here we describe how to perform the analysis using the freeware ImageJ (http://rsb.info.nih.gov/ij) utilizing the plugin Ratio Plus (http://imagej.nih.gov/ij/plugins/ratio-plus.html).
- Open the images in ImageJ. In case your images are in the format of a multicolor stack (e.g. Deltavision), separate the individual channels by first converting them to a hyperstack: Image-hyperstack-stack to hyperstack and subsequently split them to single channel stacks using: Image-hyperstack-reduce dimensionality
- Multiply the YFPex - YFPem stack with 3 using: Process-Math-Multiply This step is optional, as it is only intended to increase the visual clarity of the images by ensuring that ratios are not in the range between 0 and 1.
- In the YFPex - YFPem stack, draw a region of interest (ROI) in an area that is devoid of cells, but that is close to a cell to be measured. Different cells in the same image may require different regions, as both background and signal intensity typically is strongest in the center of an image.
- Add the ROI to ROI manager: Analyze-tools-ROI manager.
- Measure the average intensity of the ROI in both the YFPex - YFPem and the CFPex - YFPem stack: Analyze-Measure.
- Repeat at multiple timepoints and verify that background intensities close to the cell of interest are similar throughout the film.
- Set measurements to include minimal intensity: Analyze-Set measurements-Min and Max grey value.
- Draw a region of interest covering most of a cell and measure the minimal intensity in both the YFPex - YFPem and the CFPex - YFPem stack. Take the difference between the measured minimal intensity and the background intensity from 4.6 and divide it by two. This provides a starting estimate for a clipping value.
- Open Ratio Plus. Select the YFPex - YFPem and the CFPex - YFPem stack. For FRET ratio, select CFPex - YFPem as stack 1, for inverted FRET ratio visualizing probes where FRET efficiency decreases upon phosphorylation, select YFPex - YFPem as stack 1.
- Insert the measured background intensities and clipping values.
- Set the scaling of the resulting ratio stack and apply a suitable look up table (LUT) to visualize ratio changes.
5. Representative Results
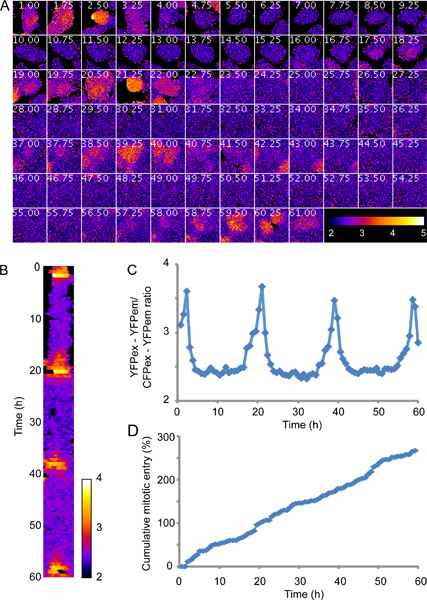
Plk1 activity is first visible in the nucleus in G2 phase and peaks during mitosis. Figure 3 shows an experiment using minimal phototoxicity settings as described in section 2. Please note that this is a representative initial result and that exposure conditions or time between images can be modified to increase signal to noise ratio or temporal resolution. Figure 3D shows that a majority of the cells expressing the probe proliferate with a cell cycle time of between 20 and 25 hours, indicating that the imaging conditions and expression levels of the probe do not affect cell cycle timings. Although there is considerable noise, the trend of Plk1 activity increasing in G2 and peaking in mitosis14 is clearly visible (fig 3A). Processing the raw data, here by mean filtering presented as a kymograph (fig 3B), or quantification of the average inverted ratio (fig 3C) can enhance clarity.

Figure 1. Principle of a FRET-based probe to monitor kinase and phosphatase activities. Two fluorophores, typically CFP (blue) and YFP (green), are connected by a phospho-binding domain (orange) and a phosphorylatable sequence (yellow). Phosphorylation (red) mediates binding to the phospho-binding domain, thereby inducing a conformational change in the probe. The conformational change results in a difference in the distance or orientation between the two fluorophores, which affects the FRET efficiency between CFP and YFP. FRET can be visualized by exciting CFP and monitoring YFP emission (dotted lines).

Figure 2. Schematic outline of the experimental procedure.

Figure 3. Plk1 activity is first visible in the nucleus in G2 phase and peaks during mitosis. U2OS cells expressing a FRET-based probe monitoring Plk1 activity9,14 were filmed for 60 hr using a Deltavision Spectris Imaging system equipped with a 20x NA 0.7 air objective and a mercury lamp. Imaging conditions were selected to cause minimal phototoxicity, as outlined in section 2, using 4x binning and neutral density filters that block 99% of the incoming light. A, false color representation of inverted FRET-ratio, following one cell through 4 divisions. B, kymograph of the cell shown in A after applying a mean filter. C, quantification of the inverted FRET ratio of the cell shown in A. D, cumulative mitotic entry of 50 FRET-probe expressing cells, including divisions of daughter cells.
Discussion
Monitoring FRET throughout the cell cycle requires considerations that are less crucial when assessing short-term responses to external stimuli. First, cell cycle progression is easily perturbed by stress signaling, requiring that phototoxicity is kept to a minimum. Second, all reporters can potentially affect cellular processes by titrating out kinases, phosphatases or interaction domains. The probably most straightforward way to assess if the experimental conditions are adequate is to measure the cell cycle length from...
Disclosures
We have nothing to disclose.
Acknowledgements
The authors are supported by the Swedish research council, the Swedish foundation for strategic research, the Swedish cancer society, the Swedish child cancer society, Åke Wibergs foundation and Jeanssons foundation.
Materials
| Name | Company | Catalog Number | Comments |
| Leibovitz L-15, no phenol red | GIBCO, by Life Technologies | 21083-027 | |
| DMEM+Glutamax-I | GIBCO, by Life Technologies | 31966 | |
| Fetal Bovine Serum (FBS) | Hyclone | SV30160.03 | |
| 0.05% Trypsin EDTA | Hyclone | SH30236.01 | |
| Penicillin-Streptomycin | Hyclone | SV30010 | |
| DPBS | GIBCO, by Life Technologies | 14287 | |
| Puromycin | Sigma-Aldrich | P8833 |
References
- Sun, Y., Wallrabe, H., Seo, S. A., Periasamy, A. FRET microscopy in 2010: the legacy of Theodor Forster on the 100th anniversary of his birth. Chemphyschem. 12, 462-474 (2011).
- Allen, M. D., Zhang, J. Subcellular dynamics of protein kinase A activity visualized by FRET-based reporters. Biochem. Biophys. Res. Commun. 348, 716-721 (2006).
- Kunkel, M. T., Ni, Q., Tsien, R. Y., Zhang, J., Newton, A. C. Spatio-temporal dynamics of protein kinase B/Akt signaling revealed by a genetically encoded fluorescent reporter. J. Biol. Chem. 280, (2005).
- Violin, J. D., Zhang, J., Tsien, R. Y., Newton, A. C. A genetically encoded fluorescent reporter reveals oscillatory phosphorylation by protein kinase. C. J. Cell. Biol. 161, 899-909 (2003).
- Kunkel, M. T., Toker, A., Tsien, R. Y., Newton, A. C. Calcium-dependent regulation of protein kinase D revealed by a genetically encoded kinase activity reporter. Journal of Biological Chemistry. 282, 6733-6742 (2007).
- Harvey, C. D. A genetically encoded fluorescent sensor of ERK activity. Proc. Natl. Acad. Sci. U.S.A. 105, 19264-19269 (2008).
- Fosbrink, M., Aye-Han, N. N., Cheong, R., Levchenko, A., Zhang, J. Visualization of JNK activity dynamics with a genetically encoded fluorescent biosensor. Proc. Natl. Acad. Sci. U.S.A. 107, 5459-5464 (2010).
- Gavet, O., Pines, J. Progressive activation of CyclinB1-Cdk1 coordinates entry to mitosis. Dev. Cell. 18, 533-543 (2010).
- Fuller, B. G. Midzone activation of aurora B in anaphase produces an intracellular phosphorylation gradient. Nature. 453, 1132-1136 (2008).
- Ni, Q., Titov, D. V., Zhang, J. Analyzing protein kinase dynamics in living cells with FRET reporters. Methods. 40, 279-286 .
- Morgan, D. O. . The cell cycle : principles of control. , (2007).
- Lindqvist, A., Rodriguez-Bravo, V., Medema, R. H. The decision to enter mitosis: feedback and redundancy in the mitotic entry network. J. Cell. Biol. 185, 193-202 (2009).
- Gavet, O., Pines, J. Activation of cyclin B1-Cdk1 synchronizes events in the nucleus and the cytoplasm at mitosis. J. Cell. Biol. 189, 247-259 (2010).
- Macurek, L. Polo-like kinase-1 is activated by aurora A to promote checkpoint recovery. Nature. 455, 119-123 (2008).
- van der Eb, A. J., Graham, F. L. Assay of transforming activity of tumor virus DNA. Methods. Enzymol. 65, 826-839 (1980).
- Lamprecht, M. R., Sabatini, D. M., Carpenter, A. E. CellProfiler: free, versatile software for automated biological image analysis. Biotechniques. 42, 71-75 (2007).
- Roszik, J., Lisboa, D., Szollosi, J., Vereb, G. Evaluation of intensity-based ratiometric FRET in image cytometry--approaches and a software solution. Cytometry A. 75, 761-767 (2009).
Reprints and Permissions
Request permission to reuse the text or figures of this JoVE article
Request PermissionExplore More Articles
This article has been published
Video Coming Soon
Copyright © 2025 MyJoVE Corporation. All rights reserved